
Content ITV PRO
This is Itvedant Content department
StreamCheck Handling Dynamic Elements & Network Calls
Business Scenario
Welcome to the QA Automation Team at StreamCheck Media Solutions.
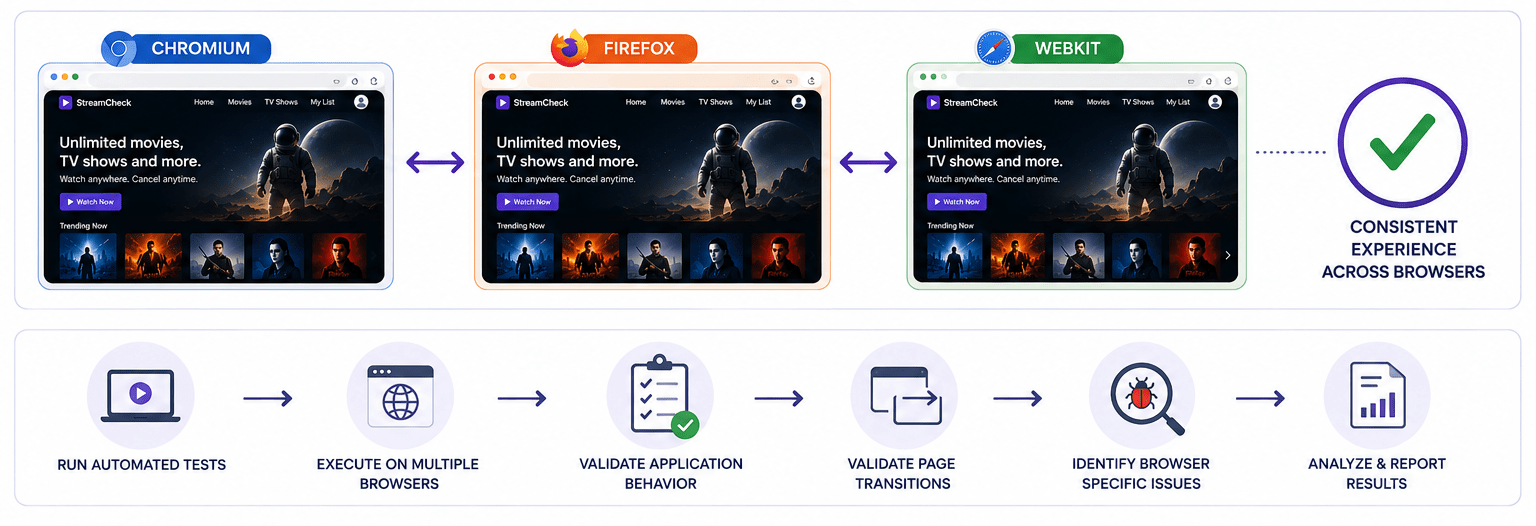
The QA Manager has assigned you the task of validating the StreamCheck media streaming application across multiple browsers using Playwright. In this lab, you will execute automated tests on Chromium, Firefox, and WebKit, verify application behavior, validate page transitions, and ensure a consistent user experience across different browsers. You will also identify and analyze any browser-specific issues encountered during test execution.
Pre-Lab Preparation
media streaming application using Playwright with Java.
As part of this lab, you will work with dynamically loaded web elements such as media recommendations, search suggestions, loading indicators, and asynchronously updated content. You will also monitor and validate network requests and API responses triggered during user interactions. Using Playwright's waiting mechanisms and network interception capabilities, you will ensure that automation scripts execute reliably and accurately validate application behavior.
Topic: Core Playwright Concepts
1)Locators (getByRole, getByText, CSS, XPath)
2)Actions (click, fill, hover, press)
3)Wait mechanisms (auto-wait, explicit wait)
4)Assertions (visibility, text, URL, state validation)
git pull origin branchNameGit Pull
Task 1: Handle dynamic UI elements
Learning Objective
The objective of this task is to learn how to monitor a Jenkins pipeline while it is executing. You will understand how Jenkins displays the progress of each stage, monitor build execution in real time, check the build status, and verify whether the PayFlow automation pipeline completes successfully.
Understand Jenkins Pipeline Monitoring
1
Step Objective
Learn what Pipeline Monitoring is and why it is important in a CI/CD environment.
What is Pipeline Monitoring?
Pipeline Monitoring is the process of observing the execution of every stage in a Jenkins pipeline. It helps QA engineers and developers monitor the build process, automated test execution, deployment progress, and final build status.
Instead of manually checking each activity, Jenkins displays the pipeline stages and updates the execution status in real time.
Why is Pipeline Monitoring Required?
Pipeline Monitoring helps to:
Track build progress.
Monitor automated test execution.
Identify failed stages quickly.
Reduce manual monitoring effort.
Provide continuous feedback to developers and QA teams.
Ensure successful software delivery.
What is Log Analysis Documentation?
Log Analysis Documentation is the process of recording identified errors, their causes, corrective actions, and the outcome after reviewing Jenkins Console Logs.
Why is Documentation Required?
Documentation helps to:
Maintain troubleshooting records.
Share findings with developers.
Track recurring issues.
Improve future pipeline executions.
Support continuous improvement.
How Does It Work?
Review the Console Logs.
Record the identified error.
Document the root cause.
Suggest corrective actions.
Prepare the final Log Analysis Report.
Example (PayFlow Project)
Log Analysis Report
| Build No. | Issue | Root Cause | Resolution | Status |
|---|---|---|---|---|
| #22 | Payment Test Failed | Payment API returned HTTP 500 | API issue fixed and pipeline re-executed | Resolved |
Observation: After fixing the Payment API issue and re-running the Jenkins pipeline, all automated test cases passed successfully and the build completed without errors.
Activity
Demonstrate how to prepare a Log Analysis Report.
Explain documentation best practices.
Review the completed report with learners.
Demonstrate how to prepare a Log Analysis Report.
Explain documentation best practices.
Review the completed report with learners.
Activity
Prepare the Log Analysis Report.
Record the build number, error, root cause, and resolution.
Submit the report for evaluation.
Great job!
Congratulations! You have completed the PayFlow Test Monitoring & Reporting in CI/CD lab. In this lab, you learned how to monitor Jenkins pipeline execution, generate automation test reports, track build and test failures, and analyse Jenkins console logs. You also learned how to interpret build status, identify the root cause of failures, and document test execution results. These skills are essential for ensuring software quality and maintaining reliable CI/CD pipelines in DevOps projects.
Checkpoint
Next-Lab Preparation
Git Push
git push origin branchNameTopic: AI in Testing
1)Monitor pipeline execution
2)Generate test reports
3)Track failures
4)Analyse logs
By Content ITV