


Content ITV PRO
This is Itvedant Content department
Analyze CartForge Logs for Errors & Failures
Business Scenario
After automation and monitoring are in place, the CartForge system becomes stable and efficient.
One day, unexpected issues appear:
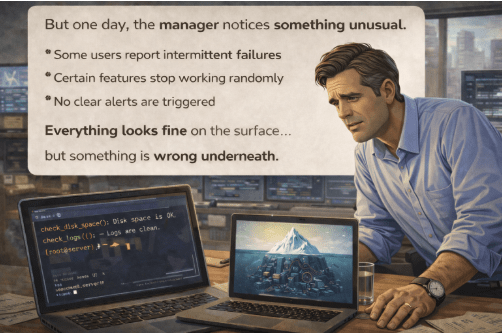
Some features fail randomly, users face intermittent errors, and no alerts are triggered.
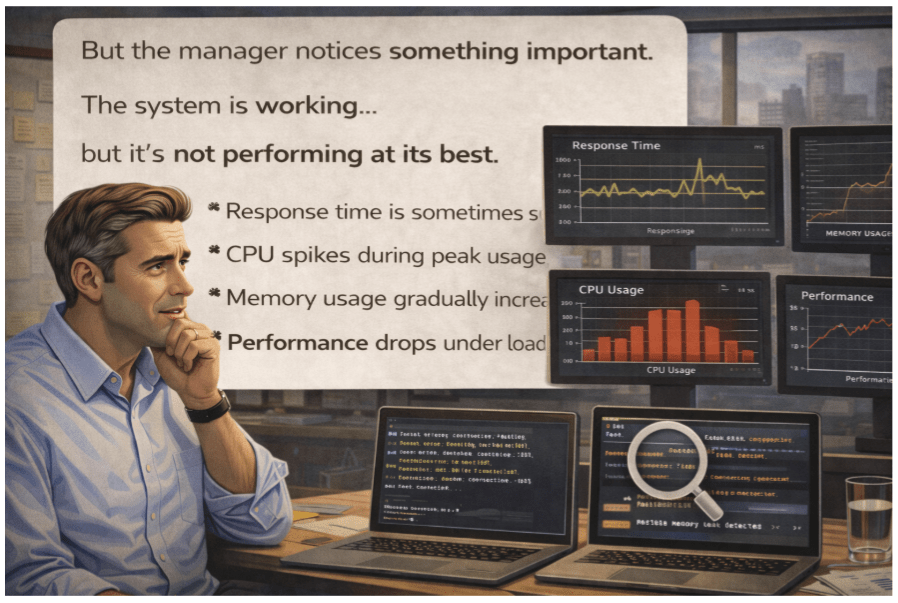
Everything looks normal on the surface, but hidden problems exist underneath.
The manager calls the Junior DevOps Engineer and explains:
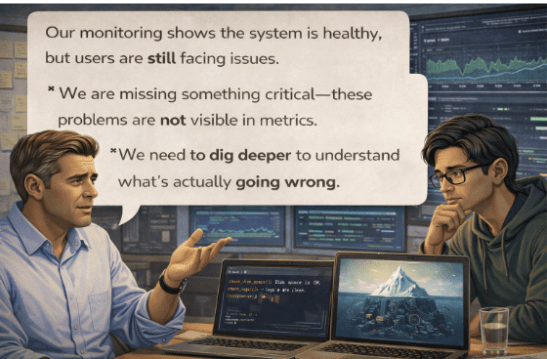
“Our monitoring shows the system is healthy, but users are still facing issues.”
He continues:
“We are missing something critical—these problems are not visible in metrics.”
“We need to dig deeper to understand what’s actually going wrong.”
The Junior DevOps Engineer gathers the team and explains:
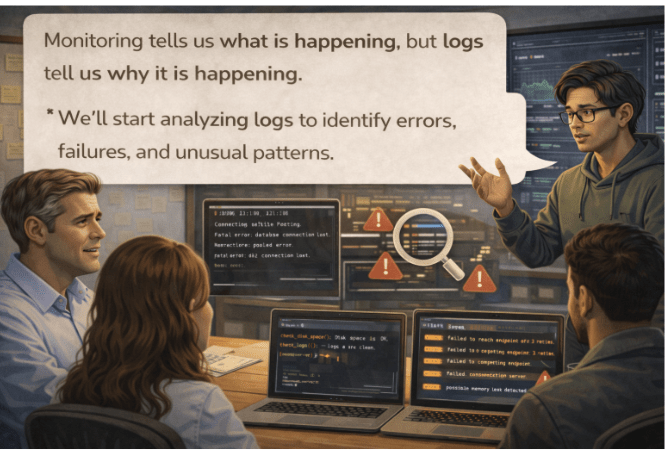
“Monitoring tells us what is happening, but logs tell us why it is happening.”
“We’ll start analyzing logs to identify errors, failures, and unusual patterns.”
Pre-Lab Preparation
What is logs
Different between Syslog and Journal Ctl
What is Monitoring
Task 1: Analyze CartForge Logs for Errors & Failures
1
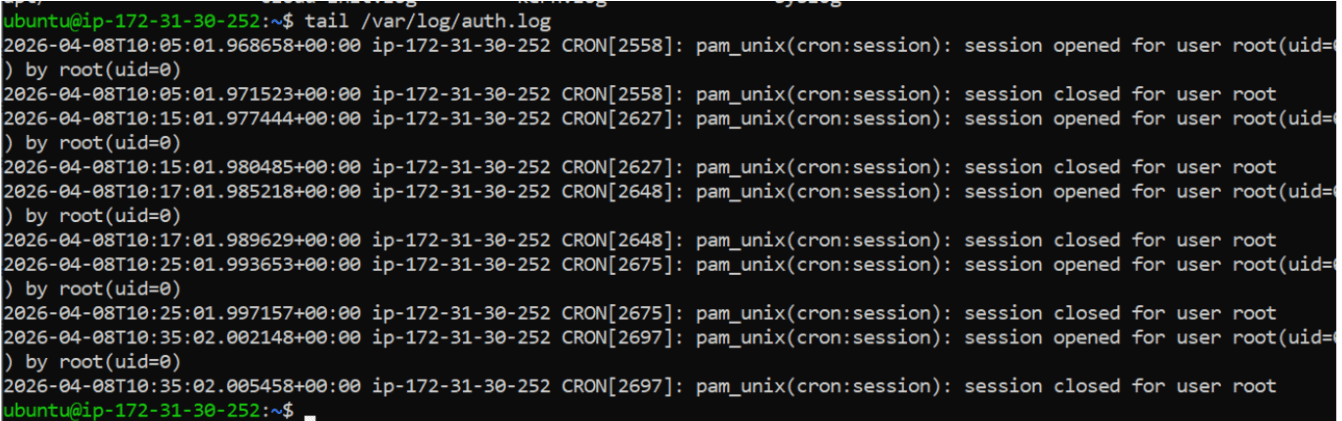
View Last Logs
tail /var/log/auth.log
(Shows last 10 lines)
2
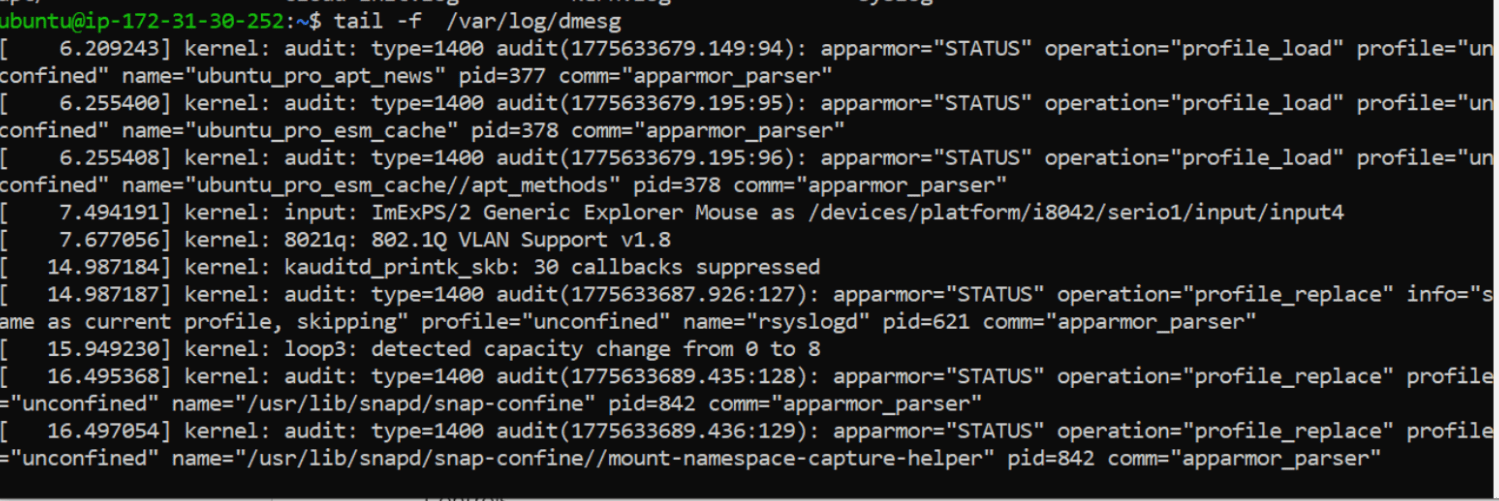
Live Logs
tail -f /var/log/dmesg
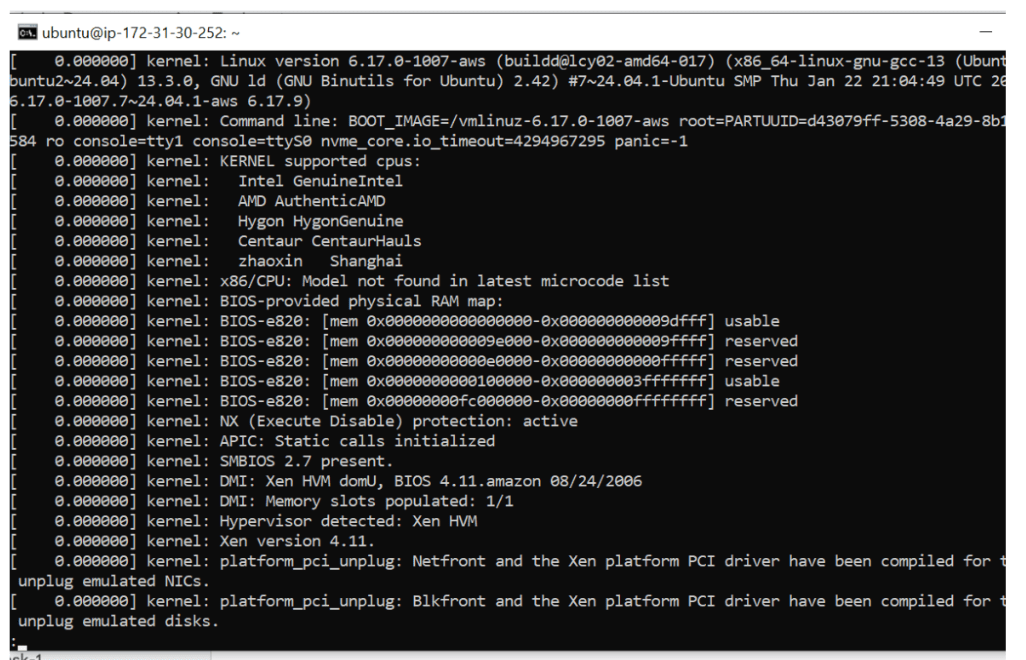
3
Using less
less /var/log/dmesg4
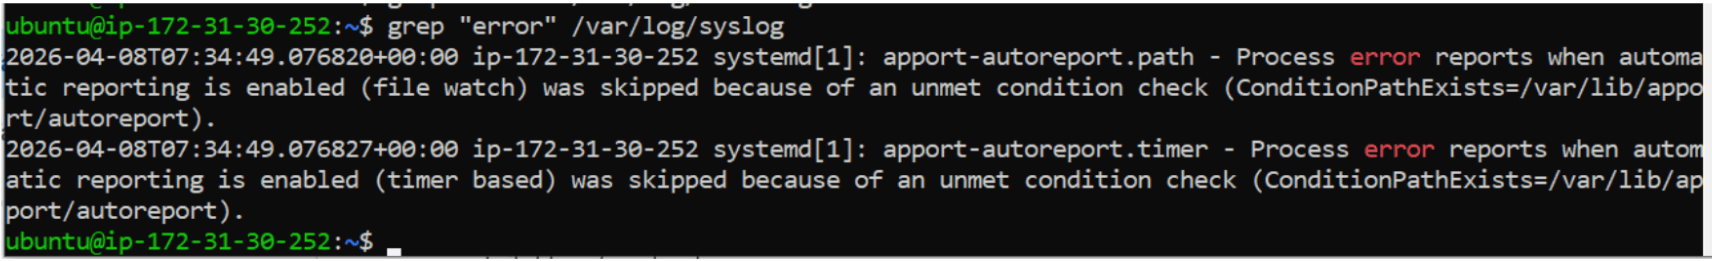
Find Errors
grep "error" /var/log/syslog
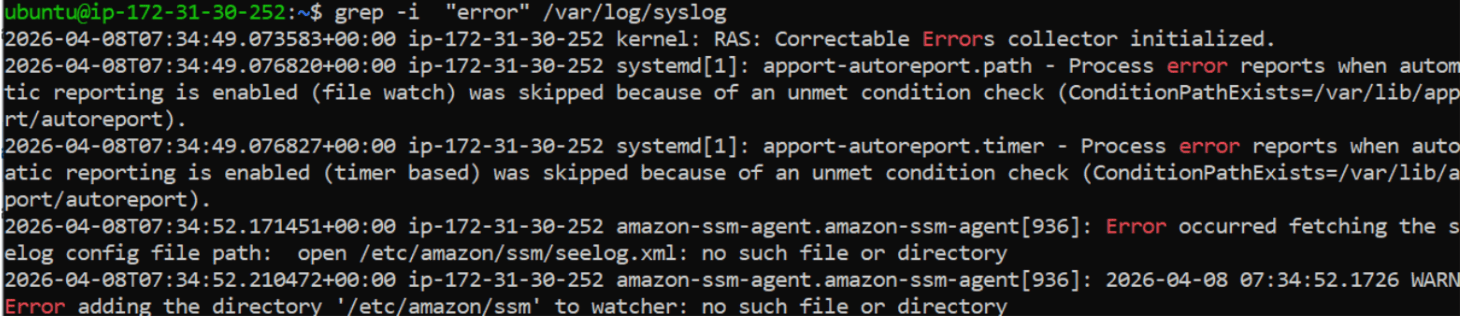
5
Ignore Case
grep "error" /var/log/syslog
6
Real DevOps Combo
tail -f logs/app.log | grep error
7
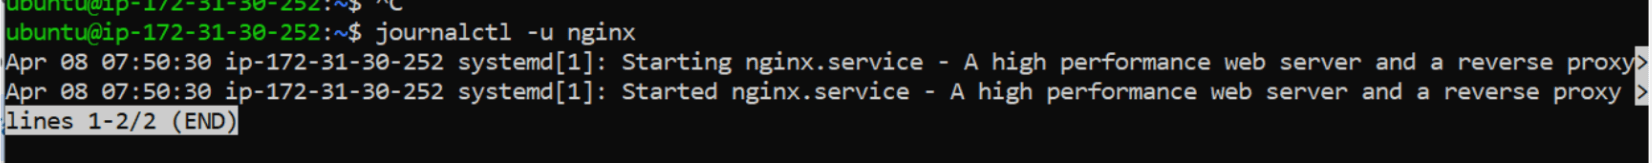
Service Logs
journalctl -u nginx8
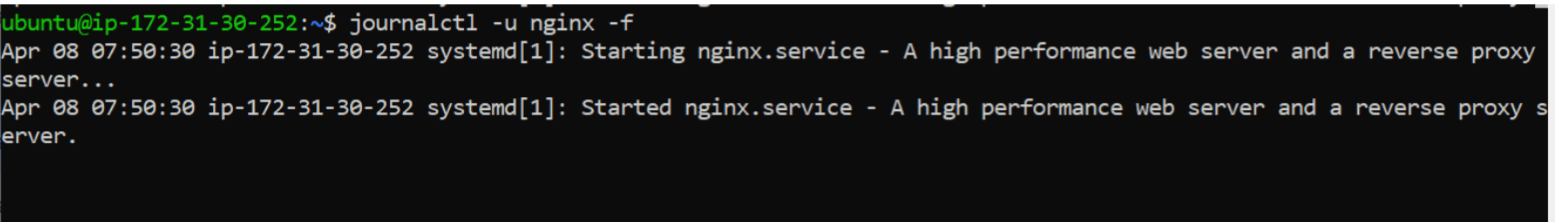
Live Logs
journalctl -u nginx -f
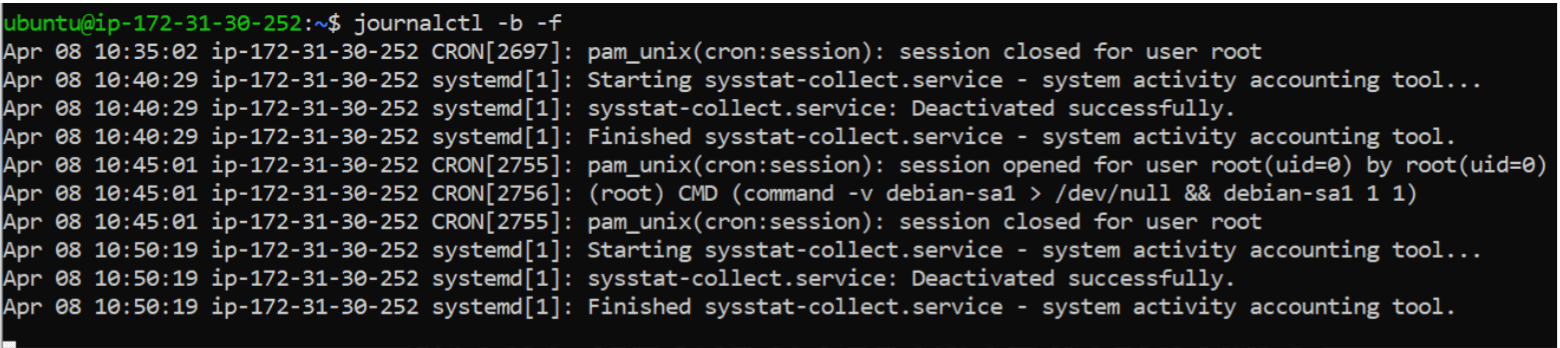
9
Last 50 Logs
journalctl -b -f
Task 2: Monitor Real-Time Metrics & Optimize Performance
After implementing log analysis, the CartForge system becomes stable and reliable.
Errors are detected early.
Failures are resolved quickly.
The manager calls the Junior DevOps Engineer and explains:
“Our system is stable now, but performance is inconsistent.”He continues:
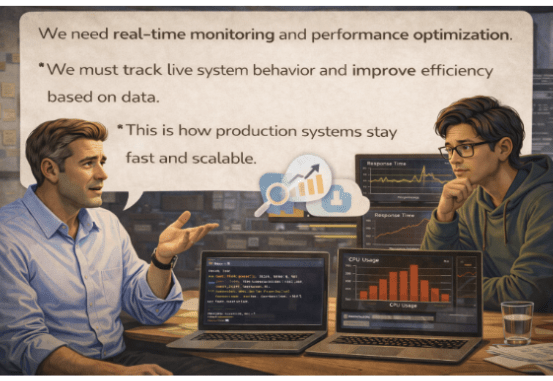
“Users expect fast responses, but during peak time, the application slows down.”
“We need to continuously monitor real-time metrics and optimize performance.”
The Junior DevOps Engineer gathers the team and explains:
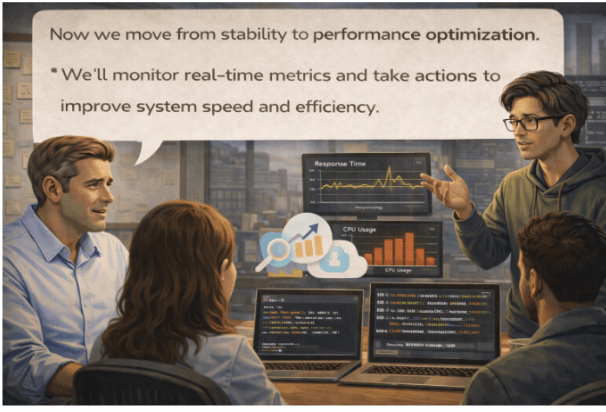
“Now we move from stability to performance optimization.”
“We’ll monitor real-time metrics and take actions to improve system speed and efficiency.”
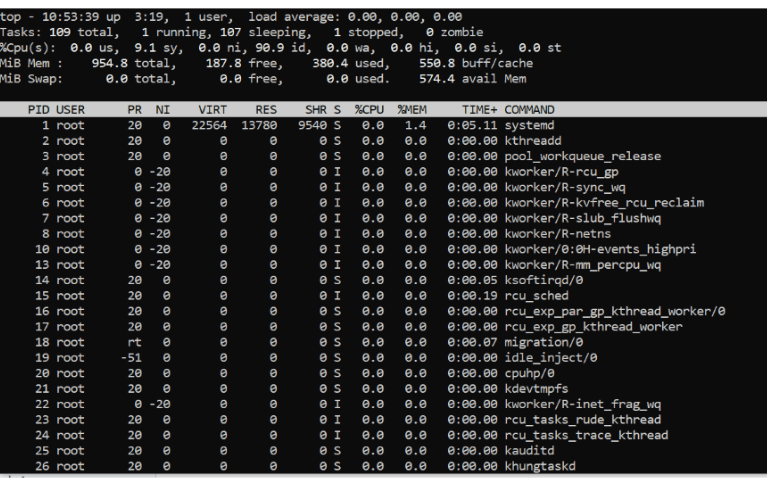
1
CPU & Memory (Live View)
top2
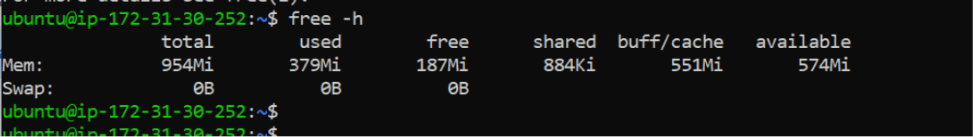
Memory Usage
free -h3
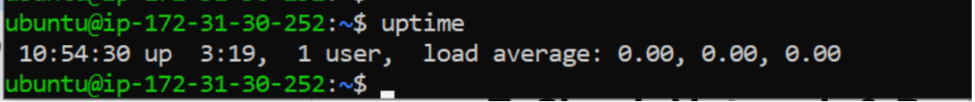
System Load
Uptime
4
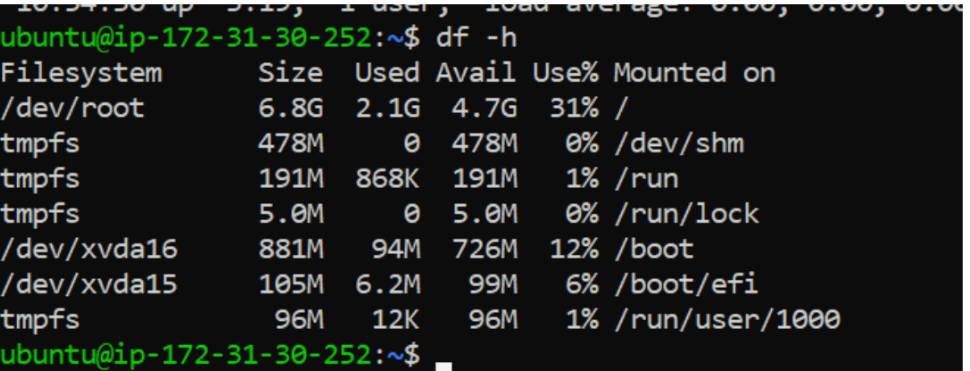
Disk Usage
df -h
5
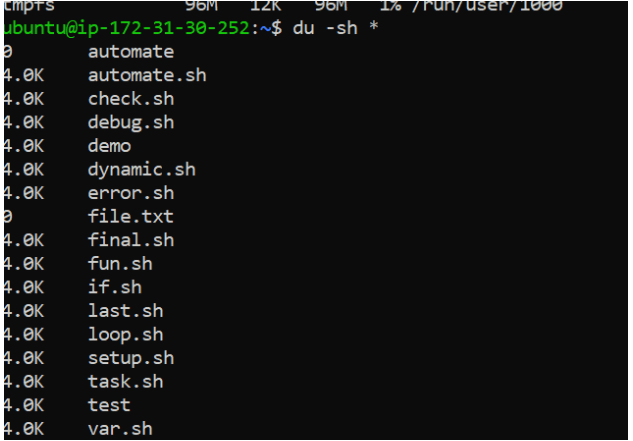
Folder Size
du -sh *6
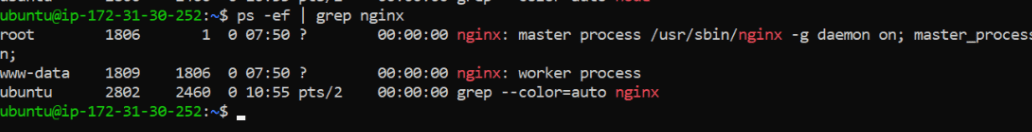
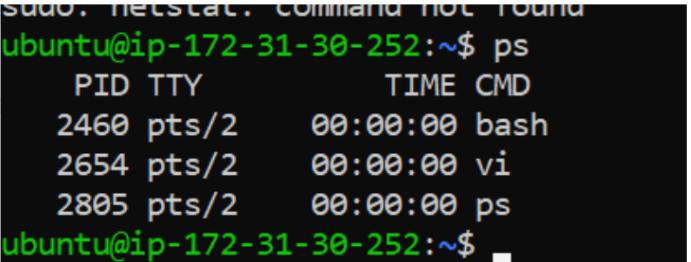
Check Running Processes
ps -ef | grep nginx
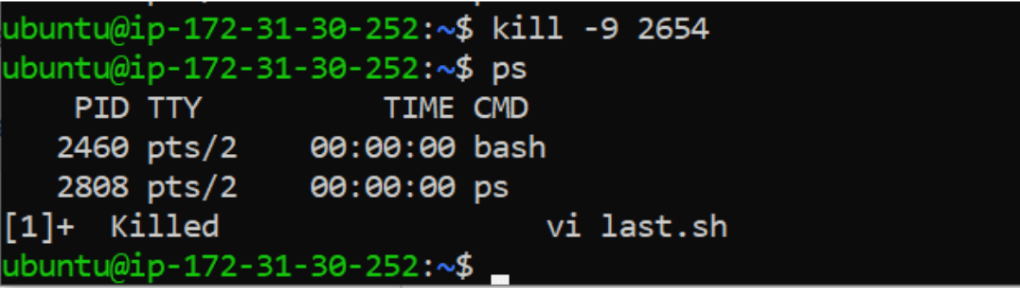
Ps
Kill -9 2654
Great job!
Built and deployed a production-ready application with secure server configuration and Linux-based execution
Implemented monitoring, automation, and Bash scripting for system health, reliability, and error handling
Completed an end-to-end real-world DevOps workflow ensuring stability, scalability, and production readiness
Checkpoint
Next-Lab Preparation
What is AWS and Why AWS ?
Cloud Service and Deployment method ?
What is IAM in AWS ?
Different between policy and roles ?
Define user group ?
By Content ITV


