


Content ITV PRO
This is Itvedant Content department
Learning Outcome
6
Calculate and interpret a T-score
5
Understand when to use T-score
4
Define standard error
3
Explain sampling variability
2
Understand why sampling is necessary
1
Differentiate between population and sample
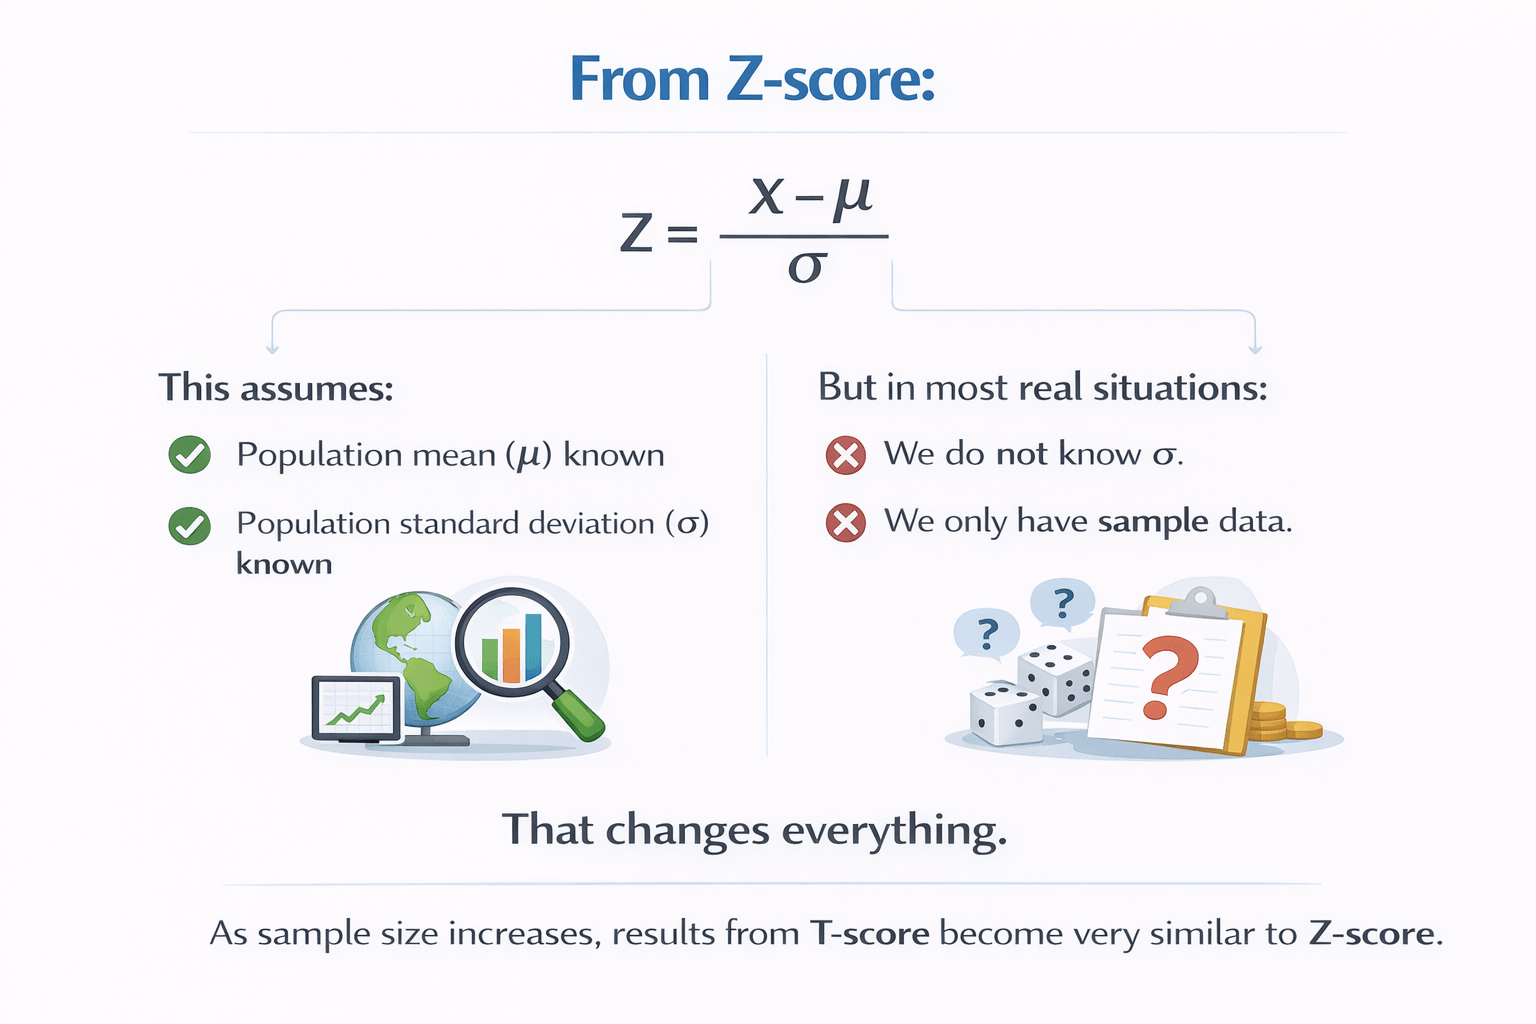
This assumes:
Population mean (μ) known
Population standard deviation (σ) known
But in most real situations:
From Z-score:
Z = (X − μ) / σ
That changes everything.
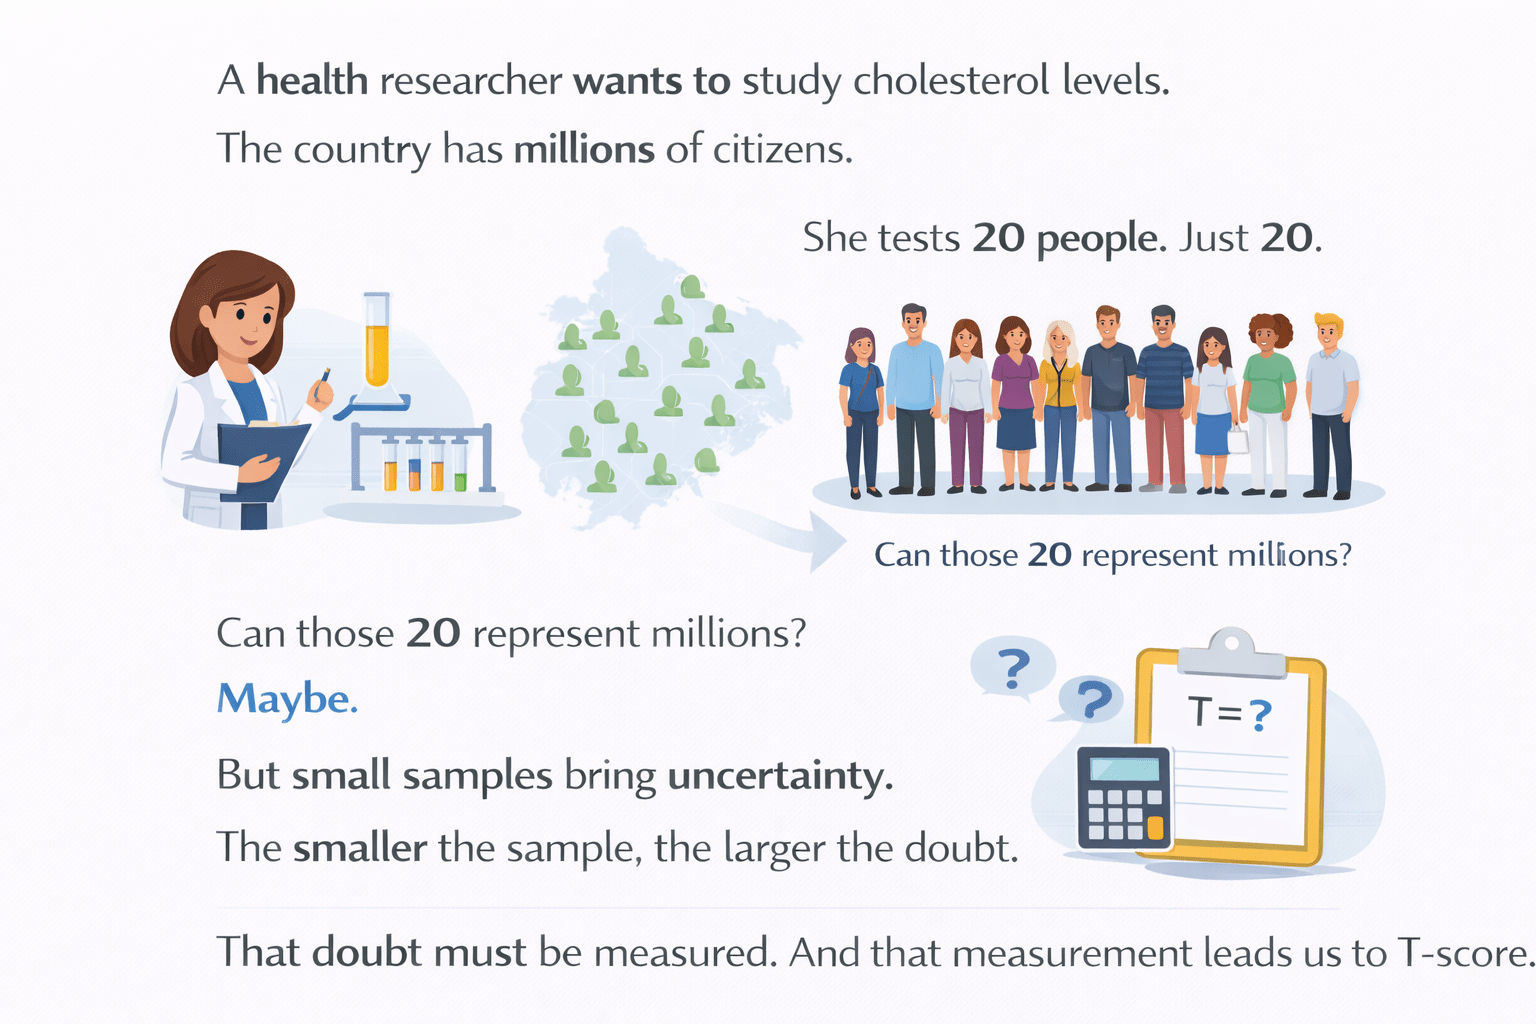
A health researcher wants to study cholesterol levels.
The country has millions of citizens.
Can those 20 represent millions?
But small samples bring uncertainty.
The smaller the sample,the larger the doubt.
This measurement leads us to T-score.
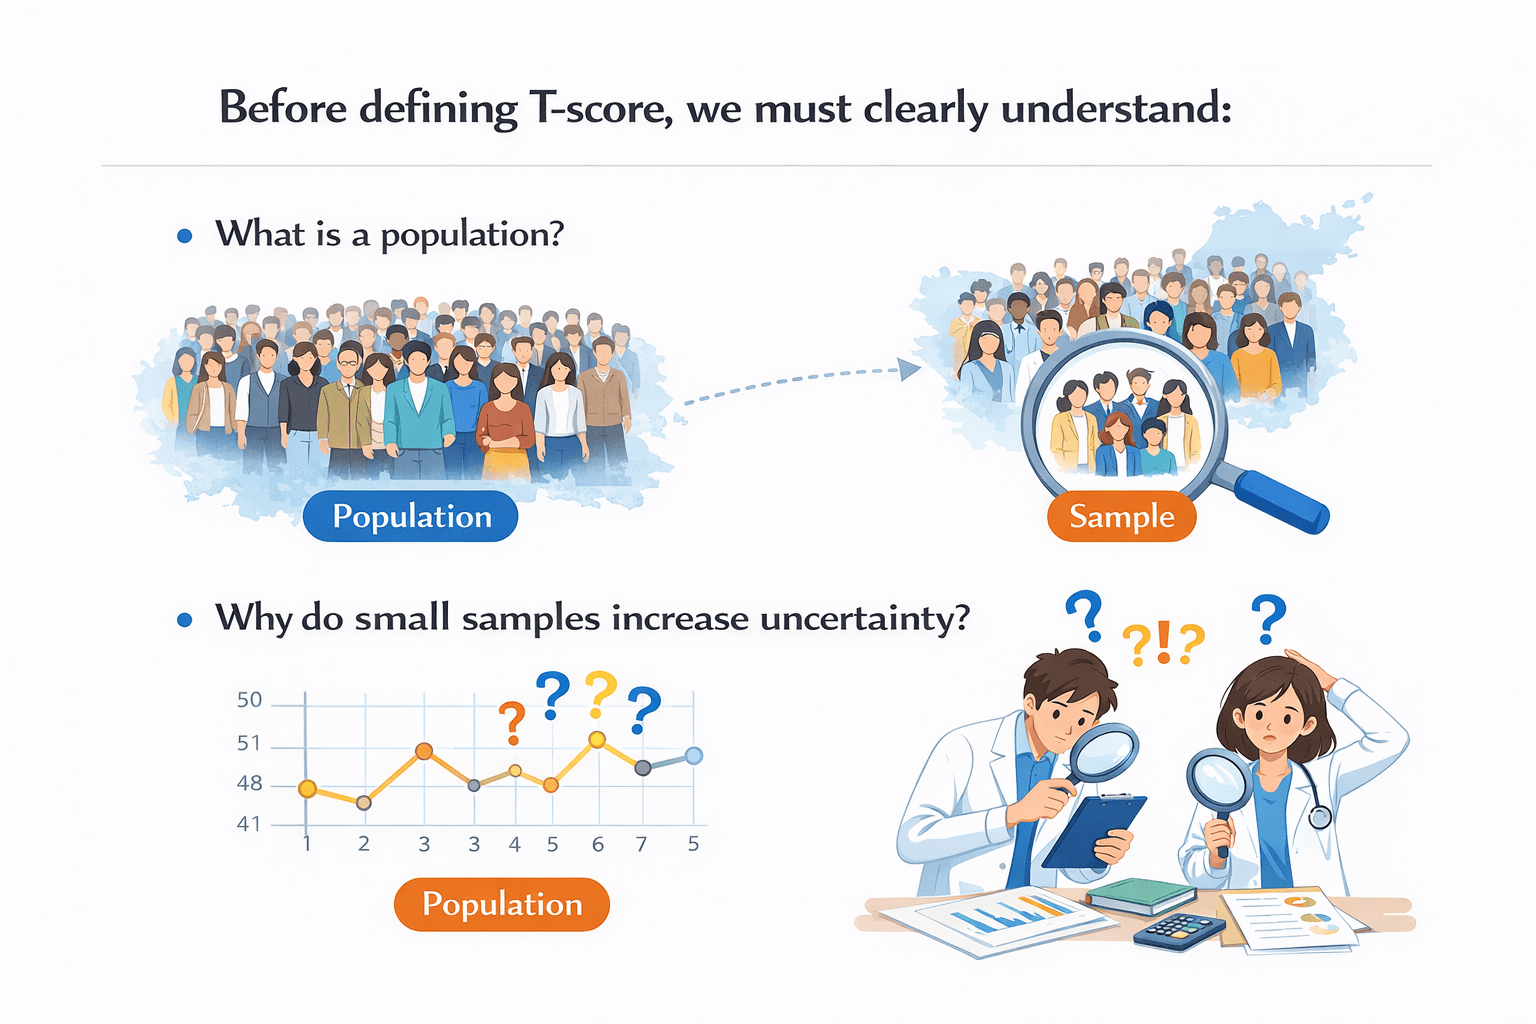
What is a population?
What is a sample?
Why do small samples increase uncertainty?
Before defining T-score, we must clearly understand:
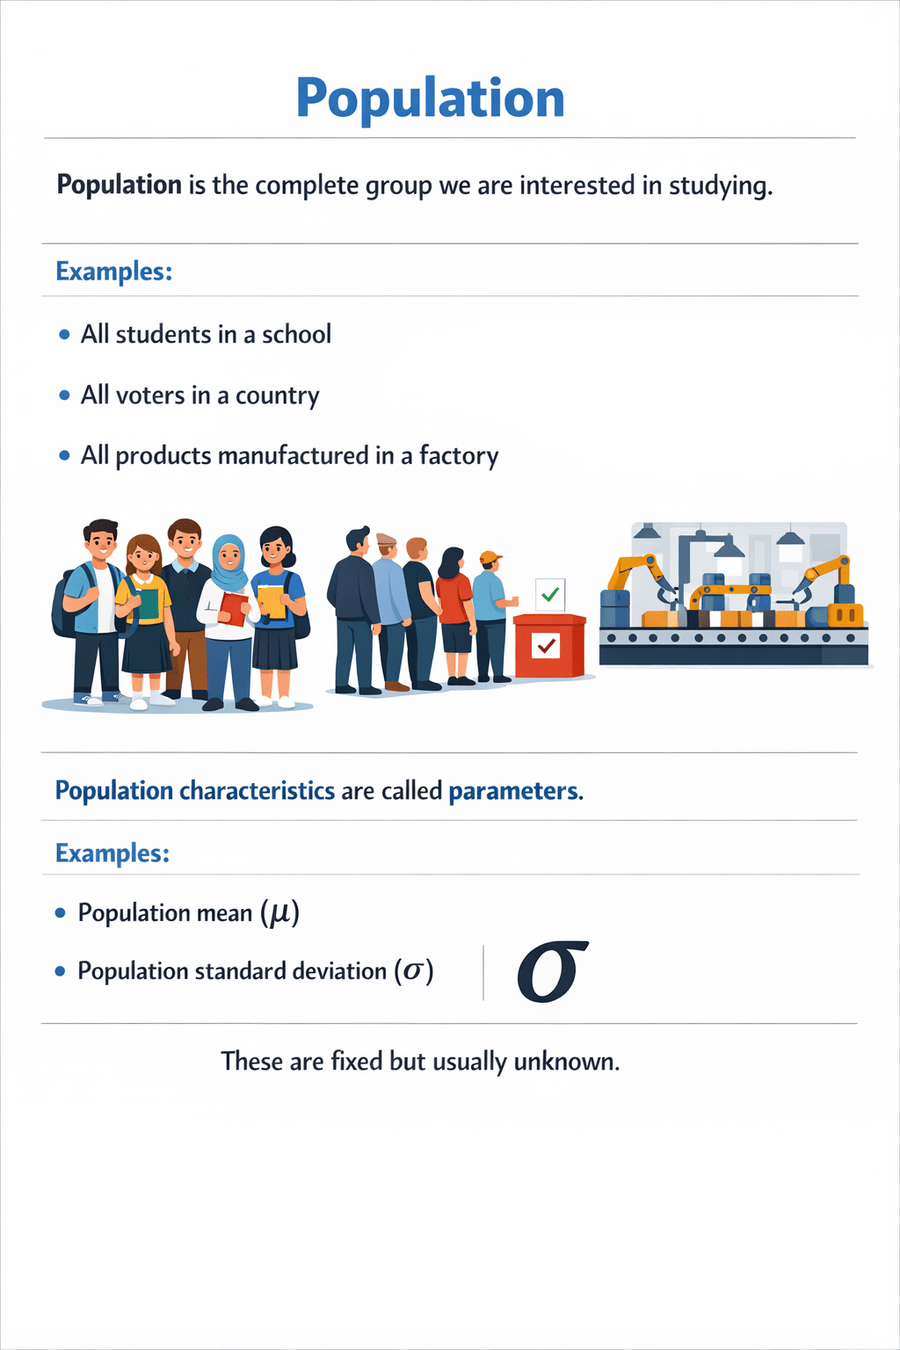
Population
Population is the complete group we are interested in studying.
All students in a school
All voters in a country
All products manufactured in a factory
Population characteristics are called parameters.
Examples
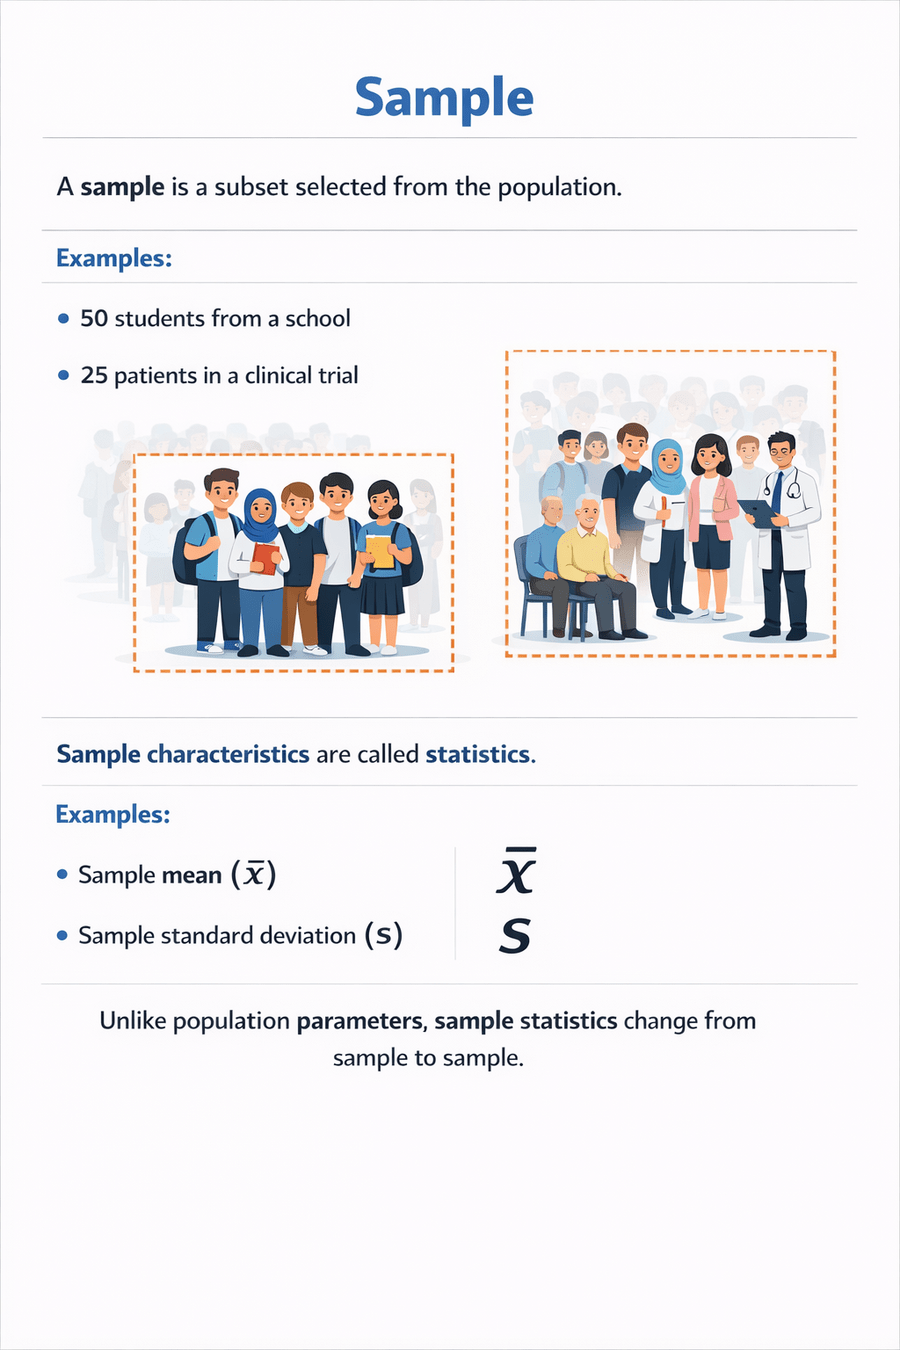
Sample
A sample is a subset selected from the population.
Sample characteristics are called statistics.
Examples
Unlike population parameters, sample statistics change from sample to sample.
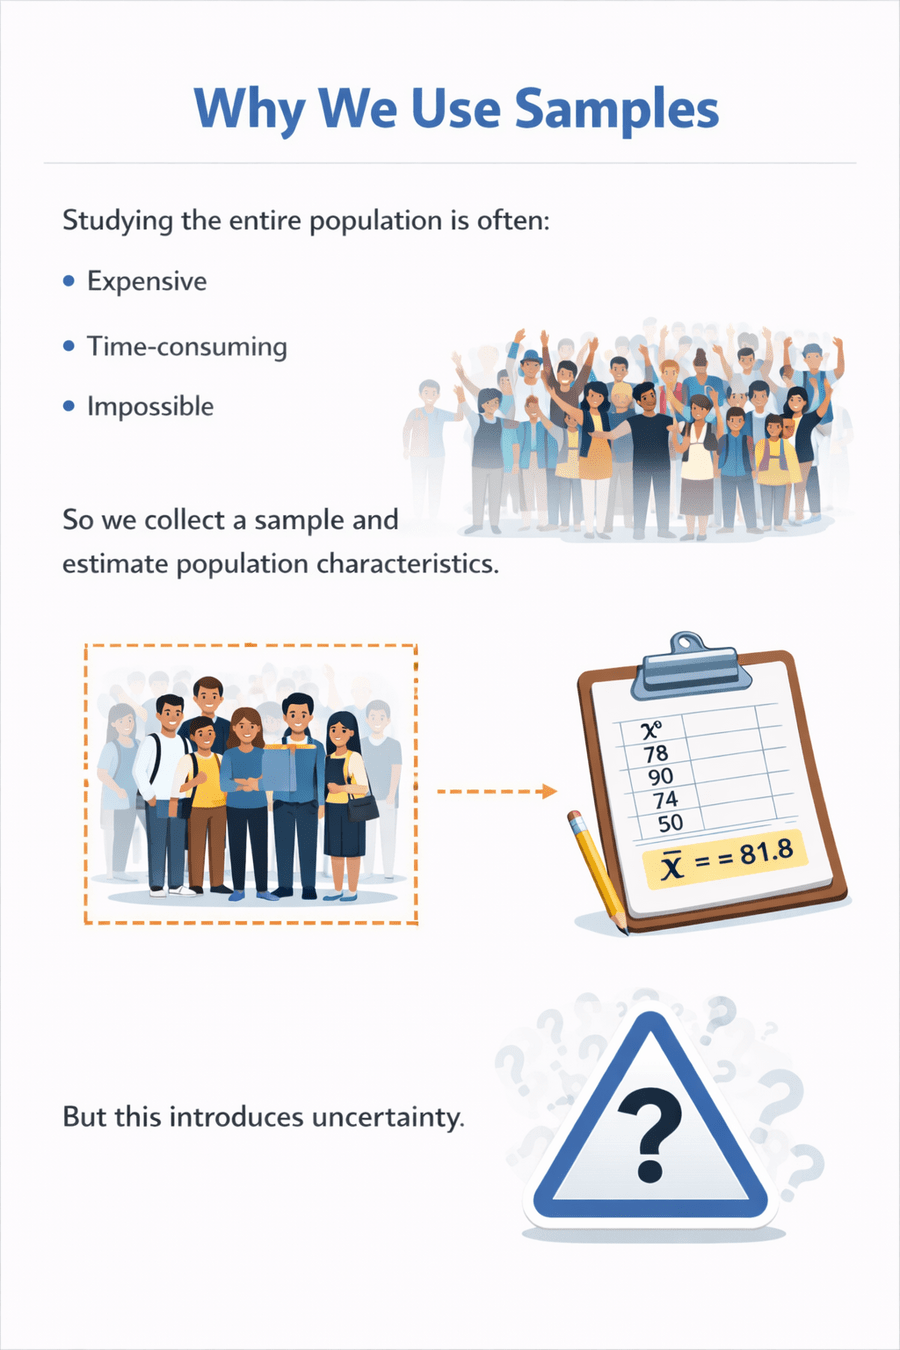
Why We Use Samples
Studying the entire population is often:
Expensive
Time-consuming
Impossible
So we collect a sample and estimate population characteristics.
But this introduces uncertainty.
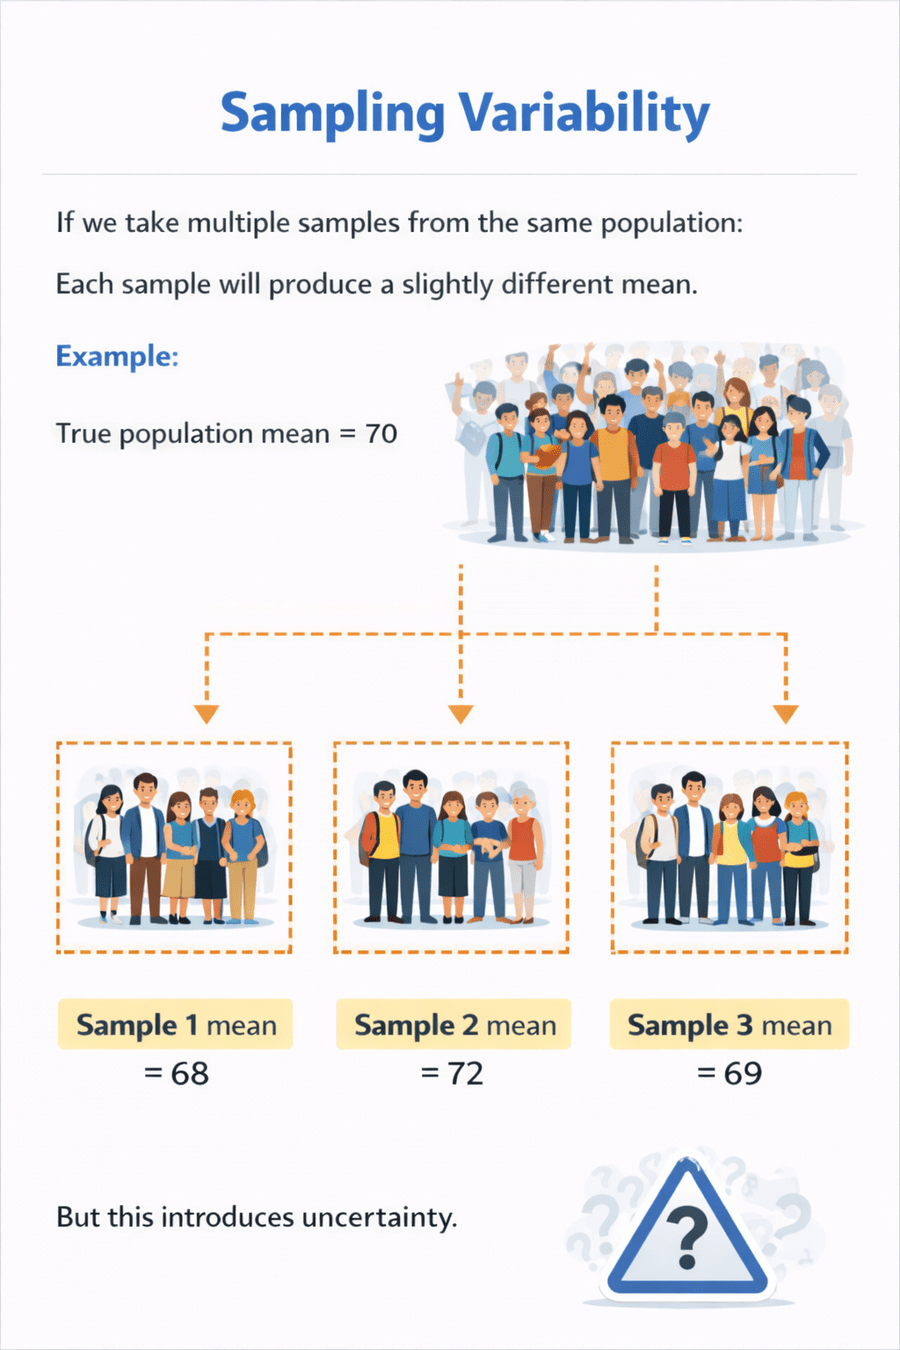
If we take multiple samples from the same population:
Each sample will produce a slightly different mean.
assume that True population mean = 70
Sample 1 mean = 68
Sample 2 mean = 72
Sample 3 mean = 69
Sample 1 mean = 68
Sample 2 mean = 72
Sample 3 mean = 69
Each sample gives a different estimate.
This natural variation is called sampling variability.
It increases when sample size is small.
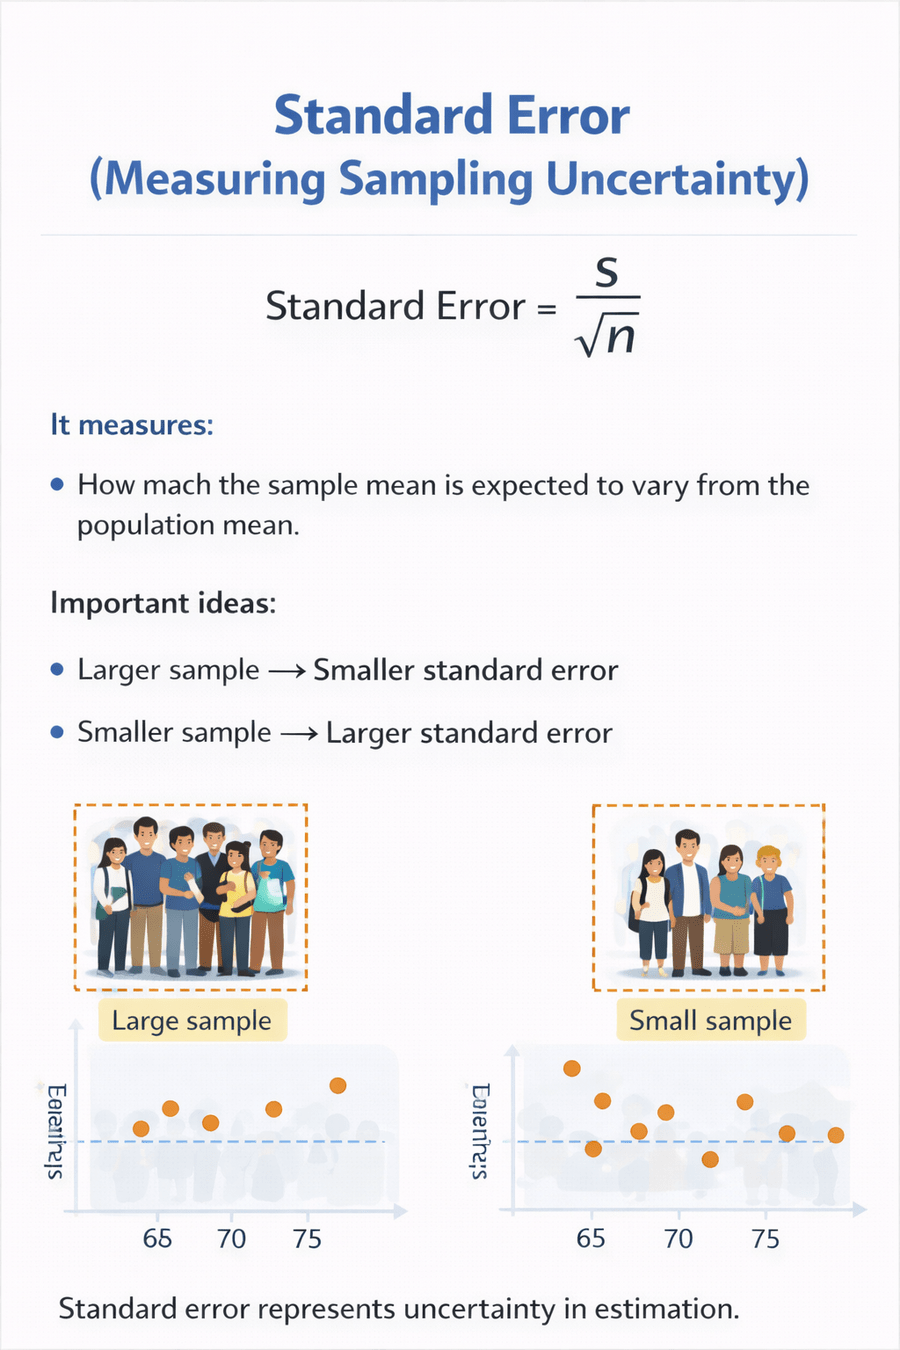
Standard Error (Measuring Sampling Uncertainty)
It measures:
How much the sample mean is expected to vary from the population mean.
Larger sample
→ Smaller standard error
→ Larger standard error
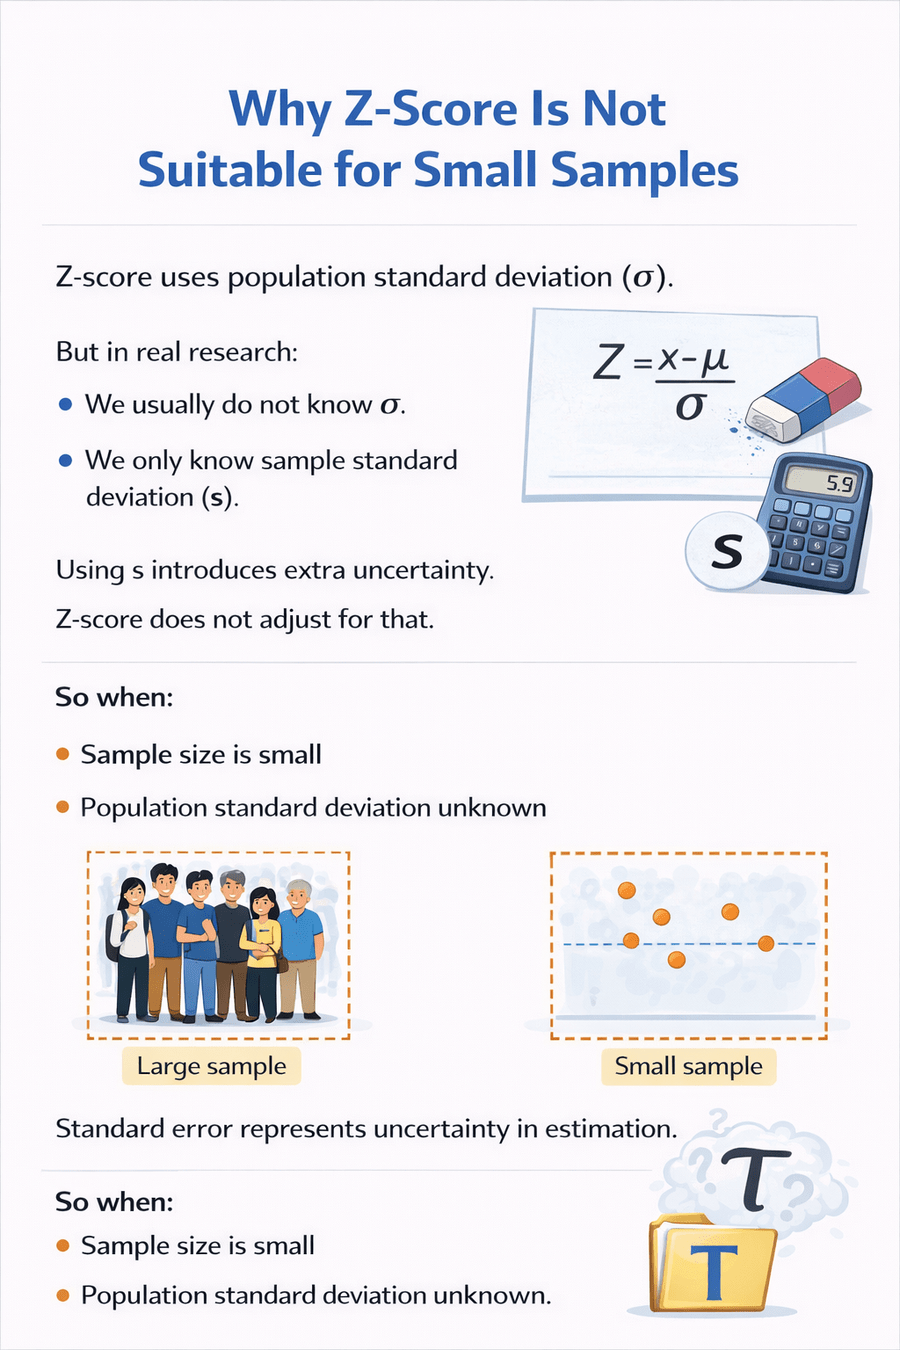
Standard error represents uncertainty in estimation.
Z-score uses population standard deviation (σ).
But in real research:
Using s introduces extra uncertainty.
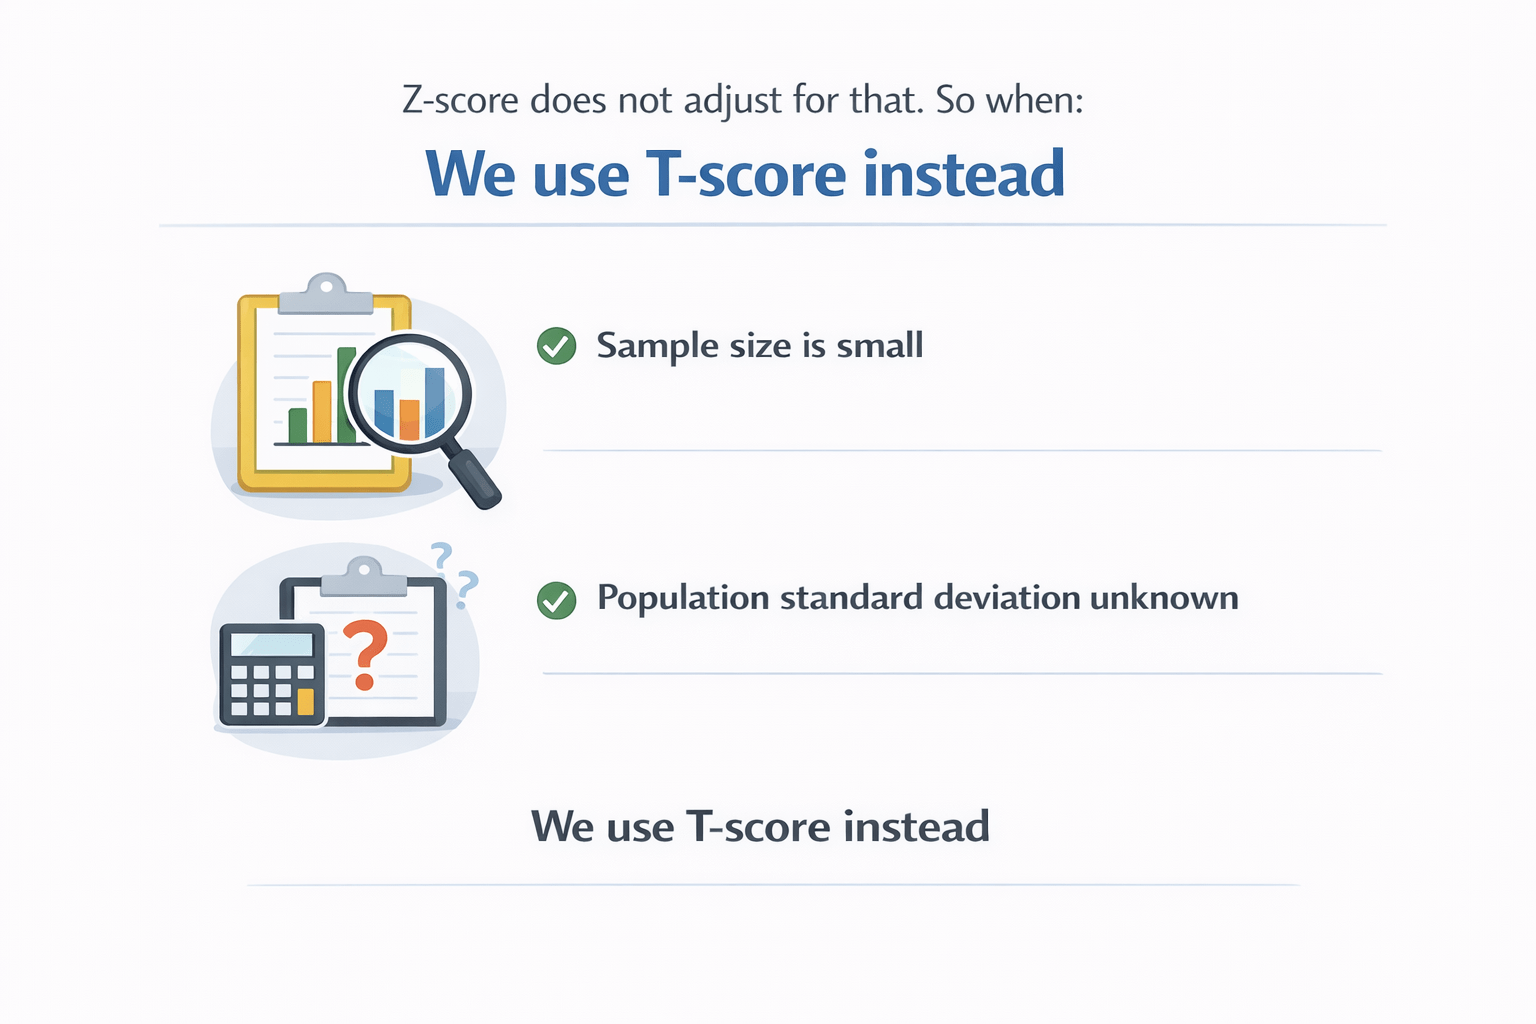
Z-score does not adjust for that.
So when:
Sample size is small
Population standard deviation unknown
We use T-score instead.
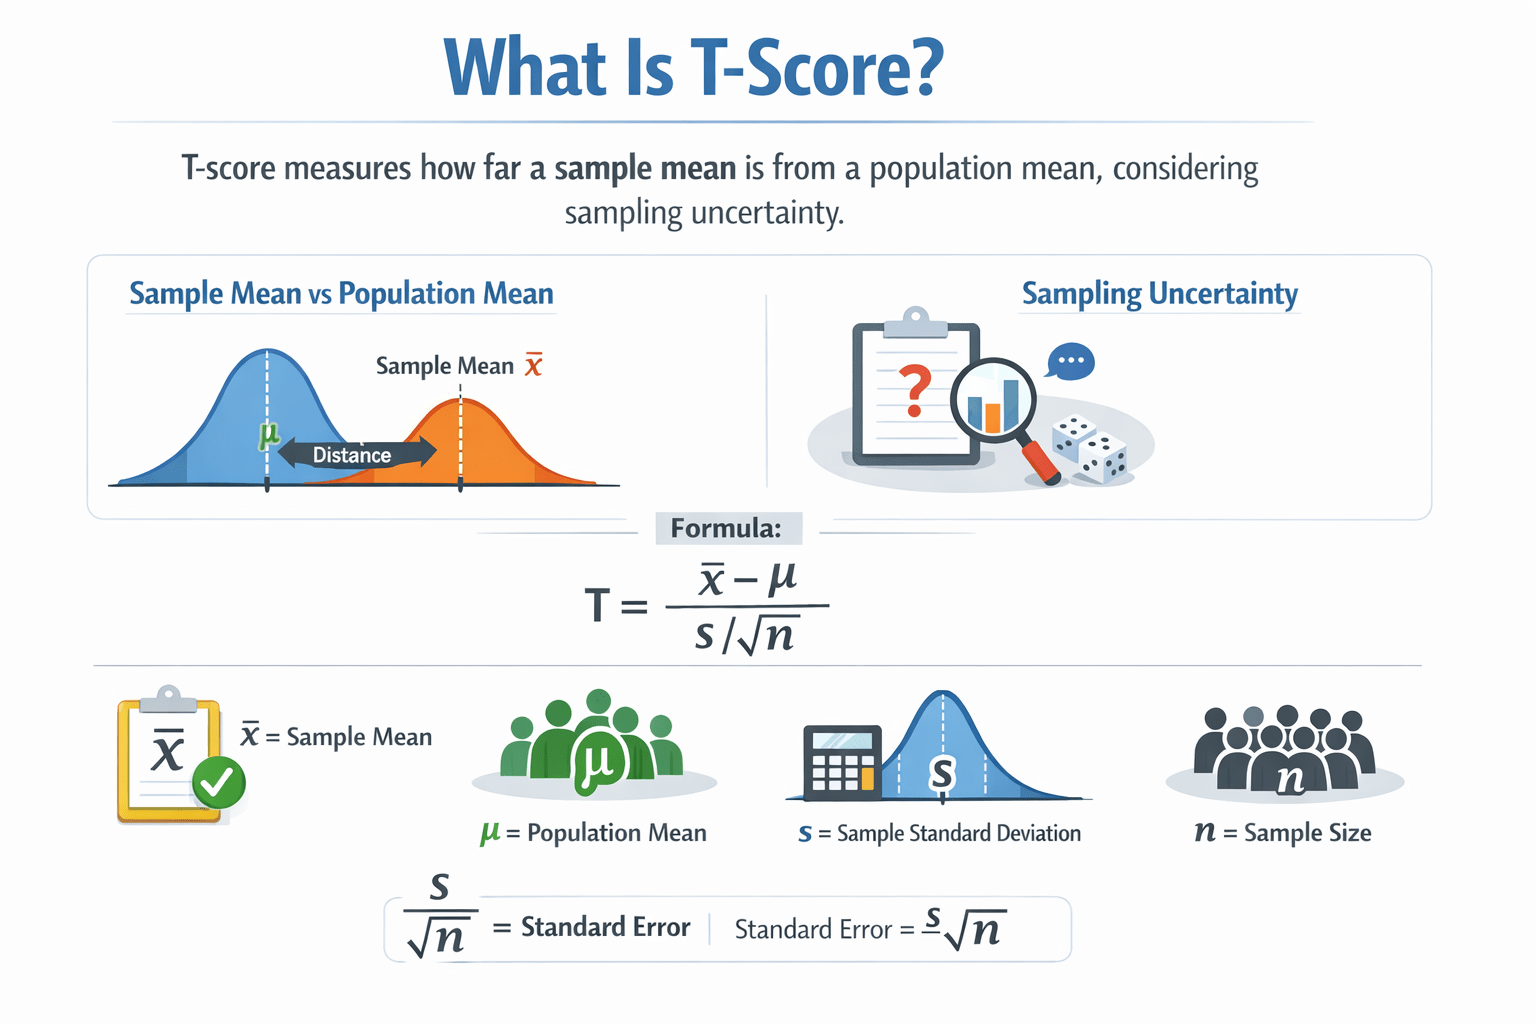
T-Score
T-score measures how far a sample mean is from a population mean,
considering sampling uncertainty.
Where:
The denominator (s / √n) is standard error.
So T-score adjusts the distance using sample-based variability.
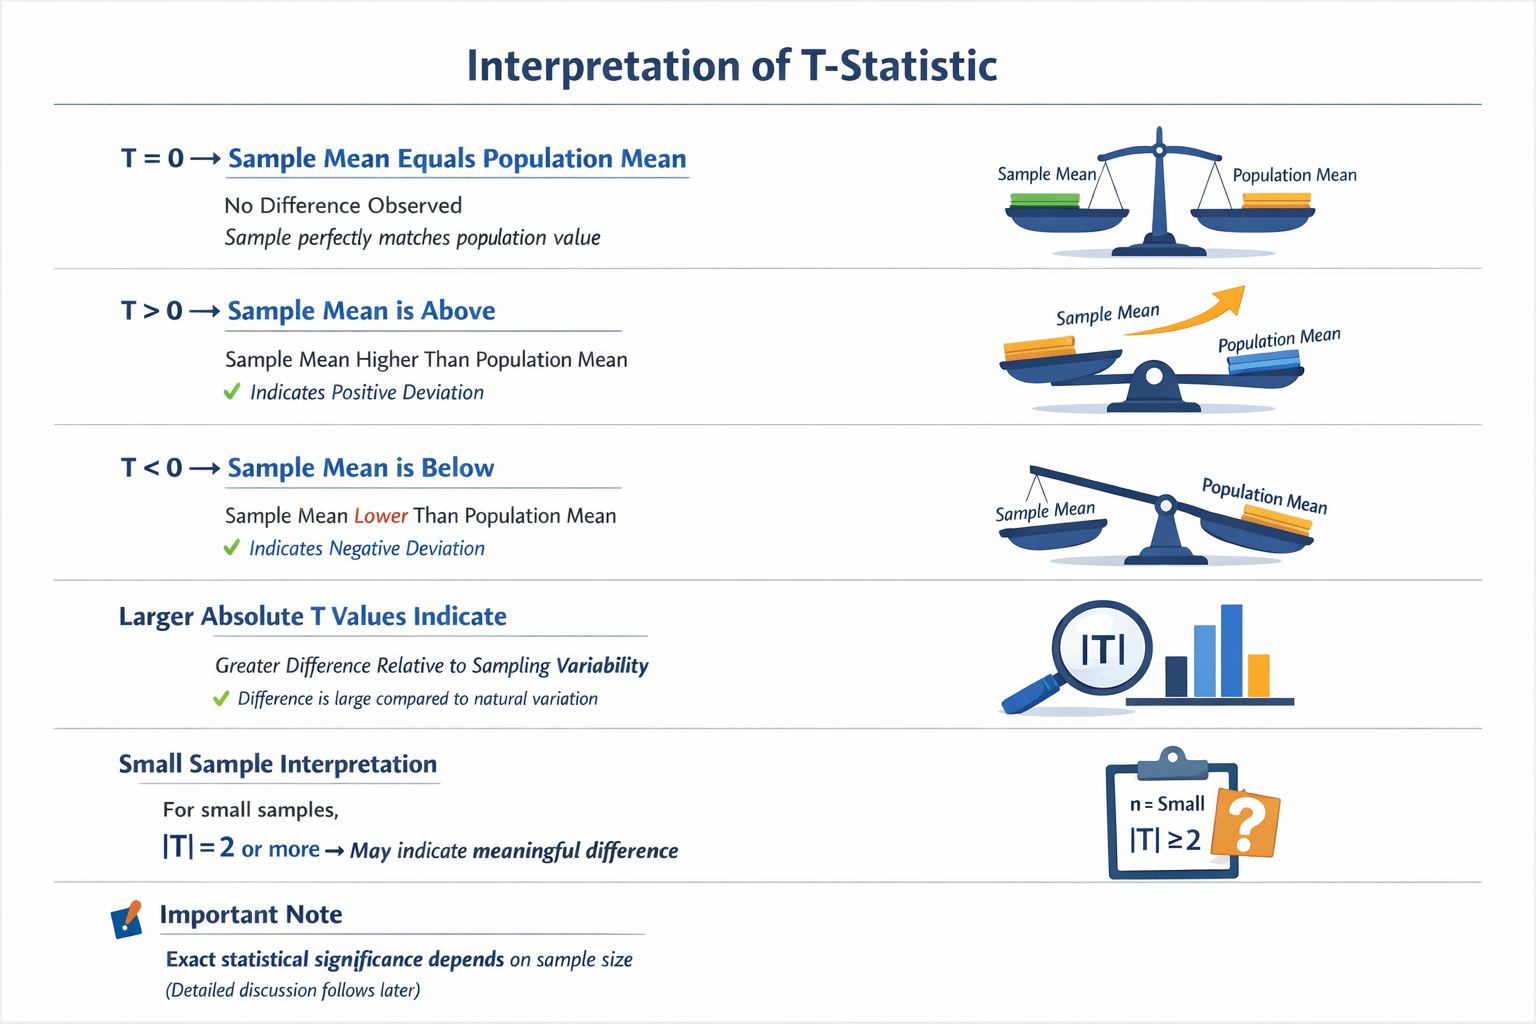
Larger absolute T values indicate:
Greater difference relative to sampling variability.
For small samples, |T| greater than around 2 may indicate meaningful difference.
Interpreting T-Score
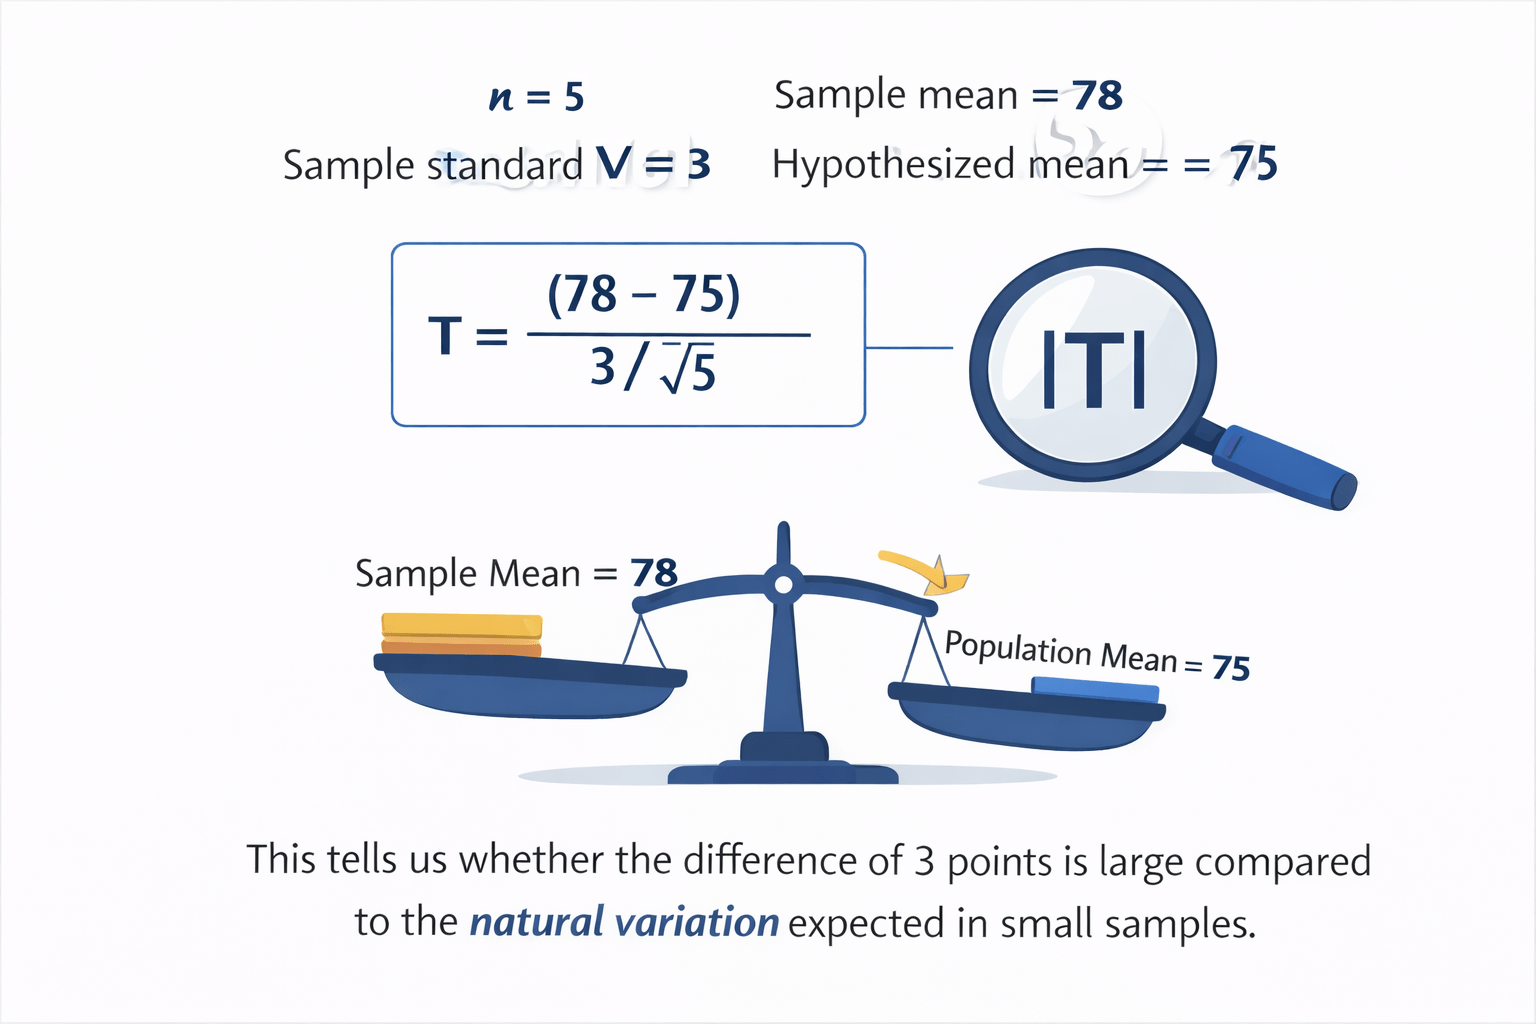
Suppose:
This tells us whether the difference of 3 points is large compared to the natural variation expected in small samples.
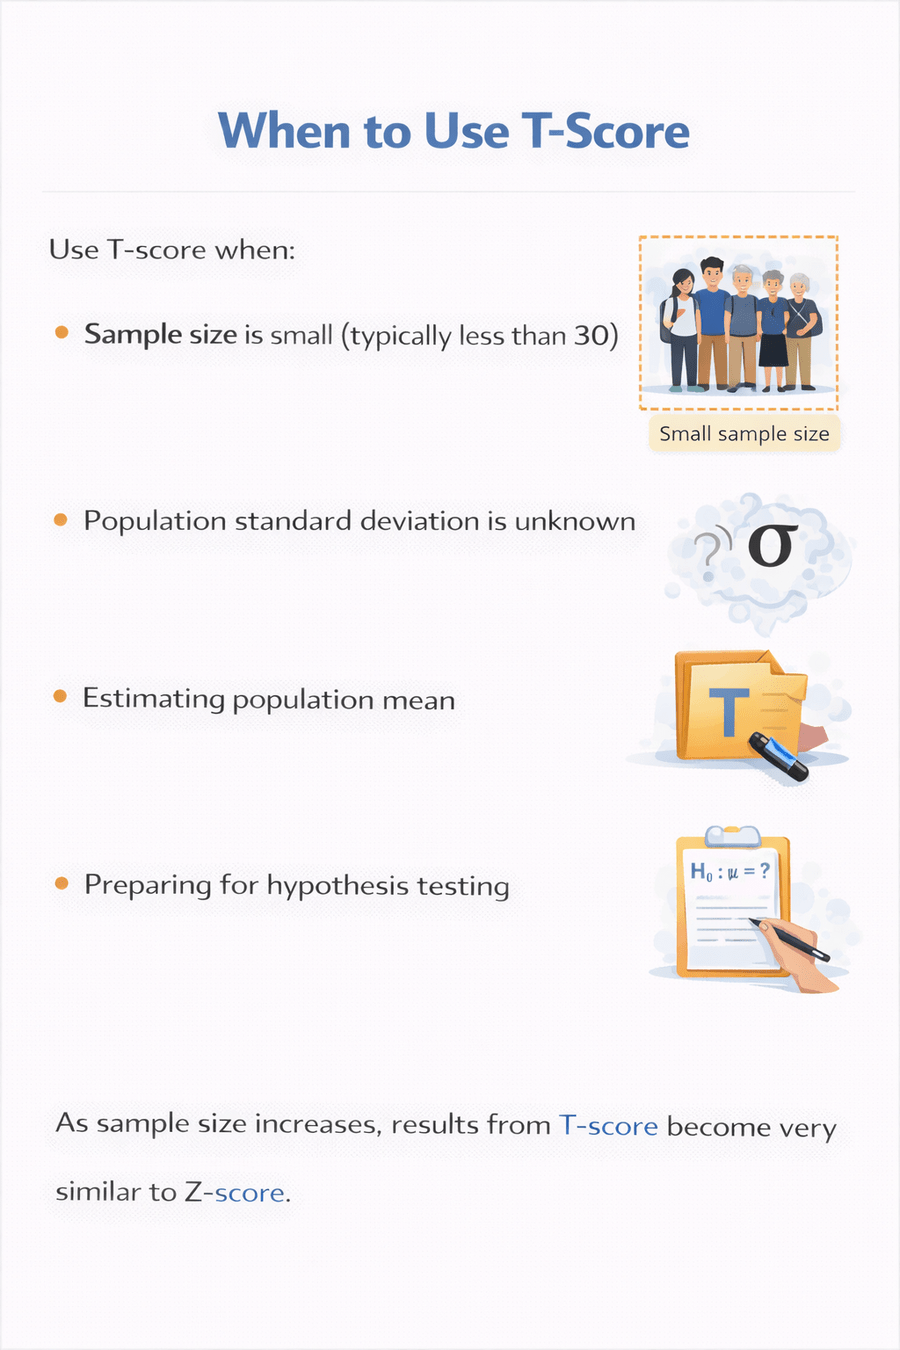
Sample size is small (typically less than 30)
Preparing for hypothesis testing
Estimating population mean
Population standard deviation is unknown
As sample size increases, results from T-score become very similar to Z-score.
Use T-score when:
Summary
5
T-score uses sample SD
4
Z-score assumes population SD known
3
Standard error measures sampling uncertainty
2
Sampling creates variability
1
Population = Entire group $ Sample = Subset
Quiz
Standard error decreases when:
A. Sample size decreases
B. Sample size increases
C. Mean increases
D. Variance increases
Standard error decreases when:
A. Sample size decreases
B. Sample size increases
C. Mean increases
D. Variance increases
Quiz-Answer
By Content ITV


