













Content ITV PRO
This is Itvedant Content department
Learning Outcome
4
Apply SLOs, dashboards, and alerts without alert fatigue.
3
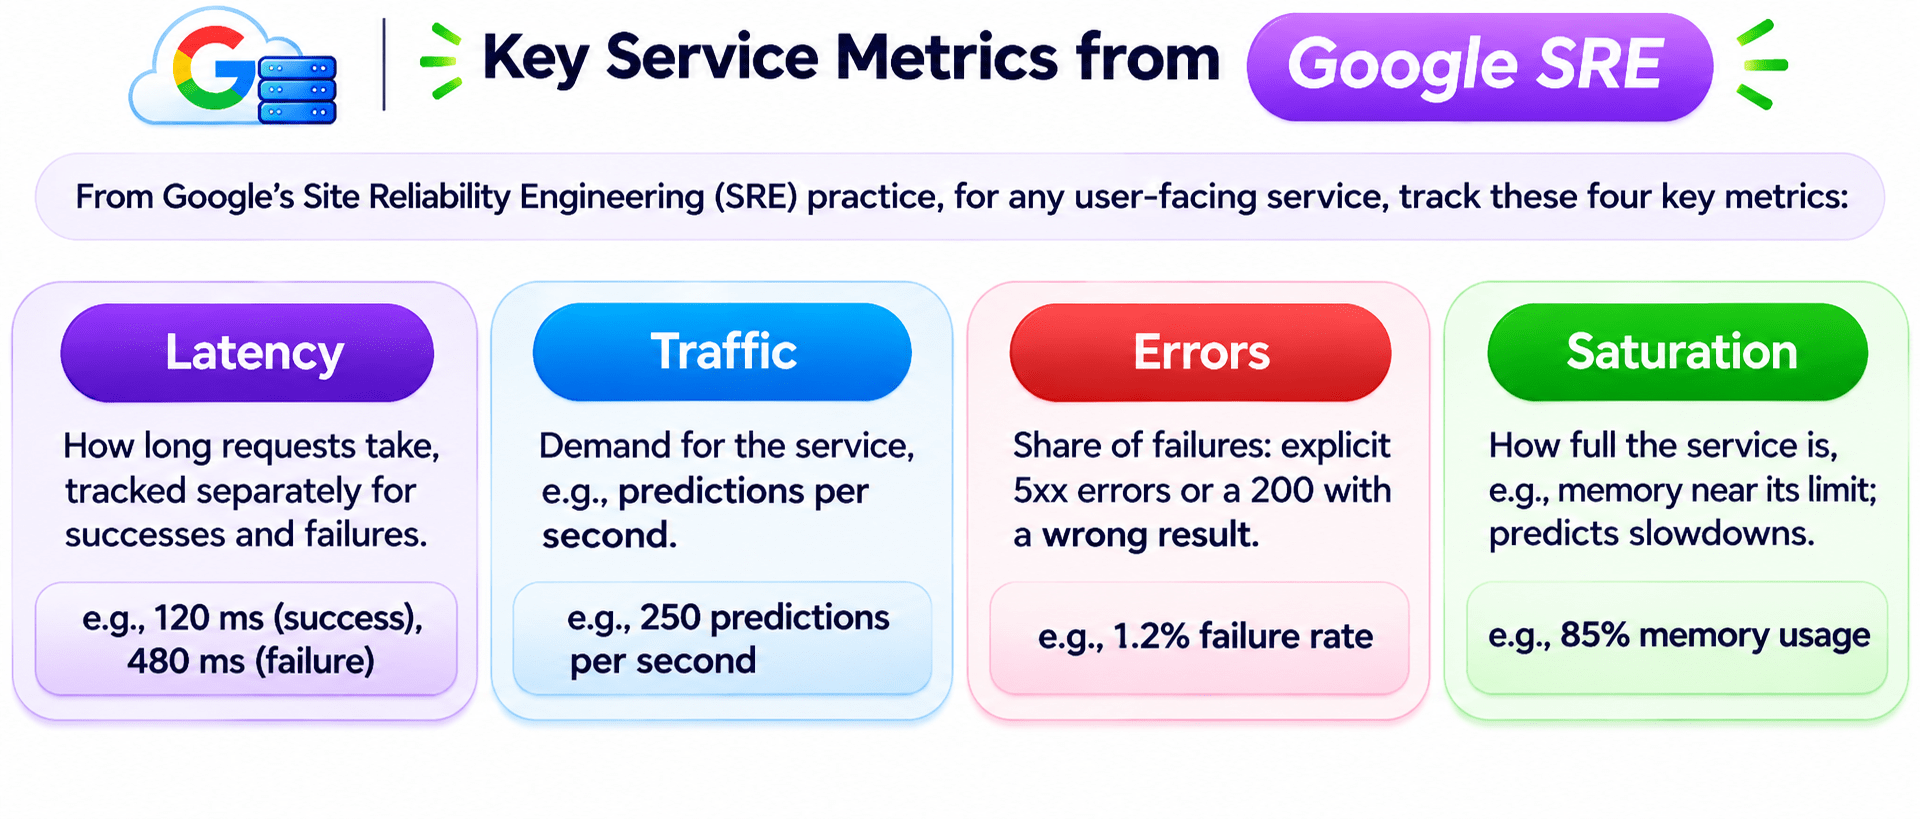
Recognize the four golden signals and why percentiles matter.
2
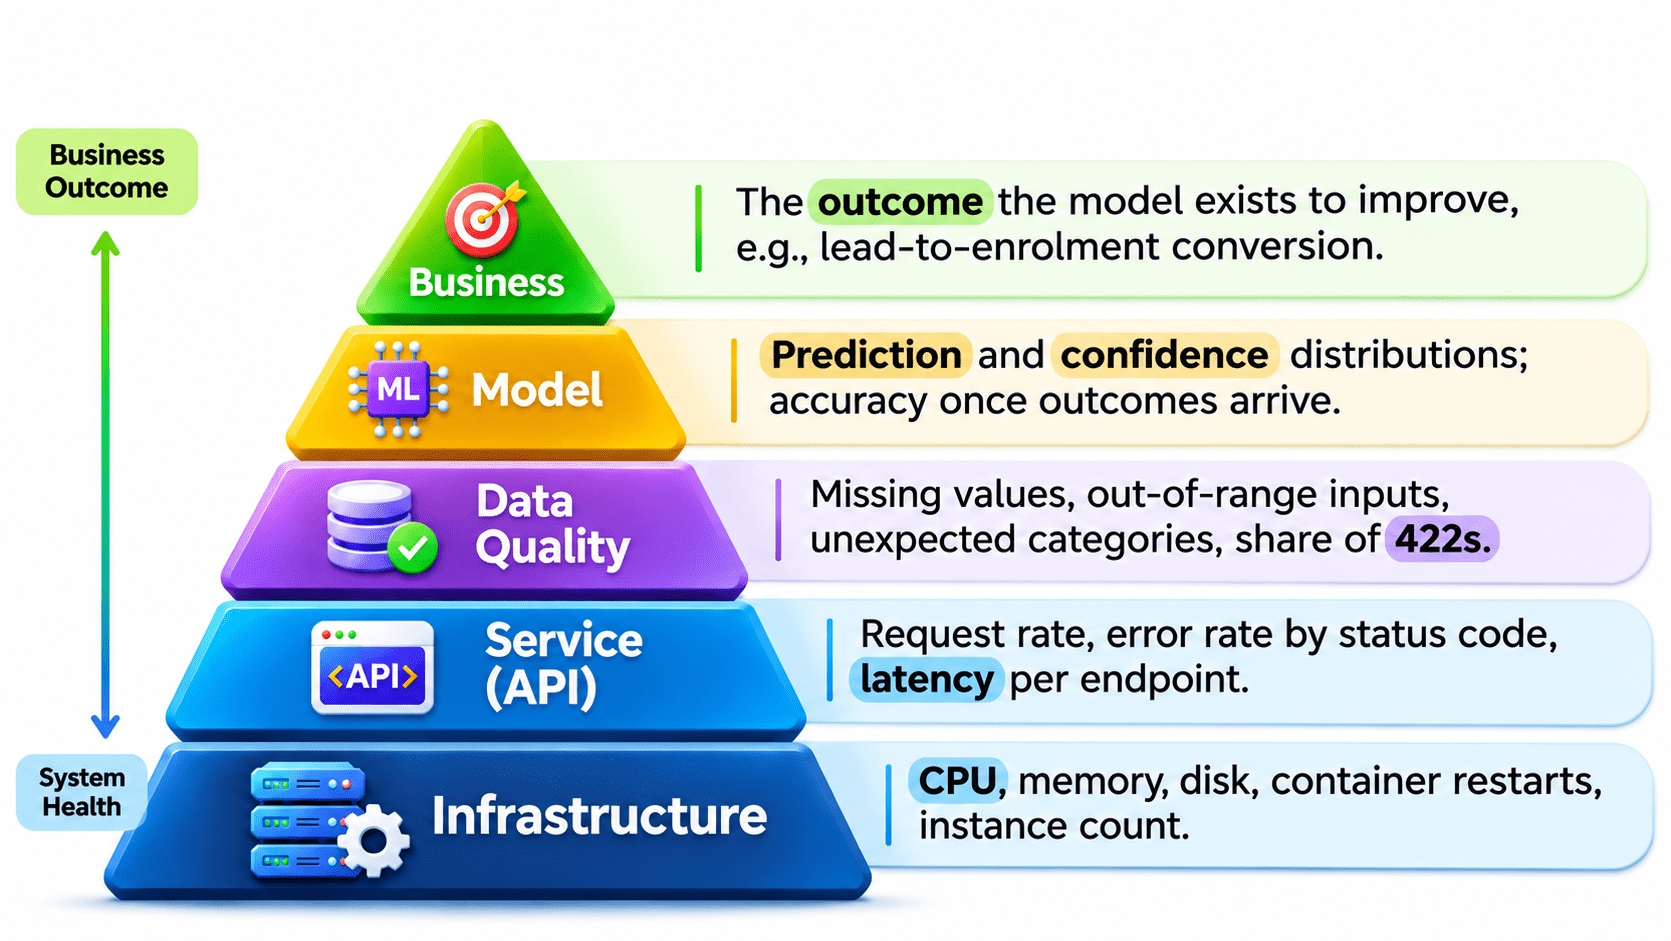
Identify the five layers of ML monitoring.
1
Understand why ML systems need monitoring beyond uptime.
5
Connect monitoring to LLM cost, tokens, and answer quality.
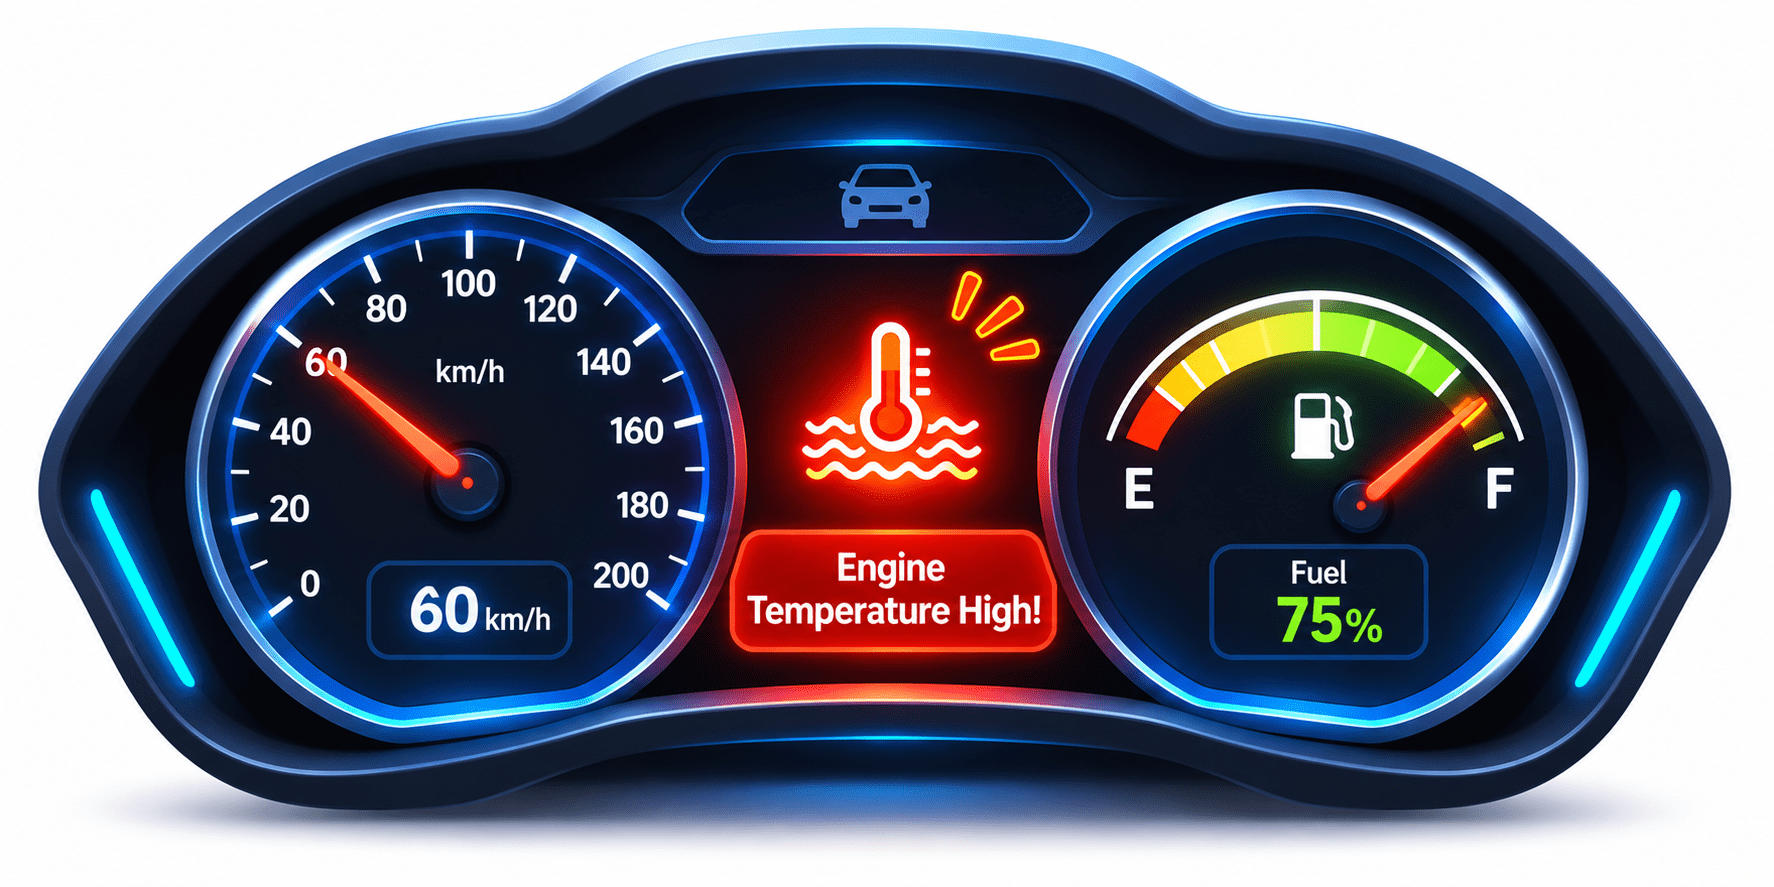
While driving, you keep an eye on the dashboard. It shows important details like speed and fuel level. If the engine gets too hot, a warning light immediately alerts you.
But can the dashboard show every possible problem?
Not always. Some issues remain hidden, which is why we still take our car for regular servicing.
Why do we check the dashboard while driving?
How does a warning light help us?
Why do we still need regular servicing?
Monitoring helps us identify problems early, while regular checks help us catch issues we might otherwise miss.
Now, think about our application. Once our machine learning model is deployed and live, we cannot simply leave it running and assume everything is fine.
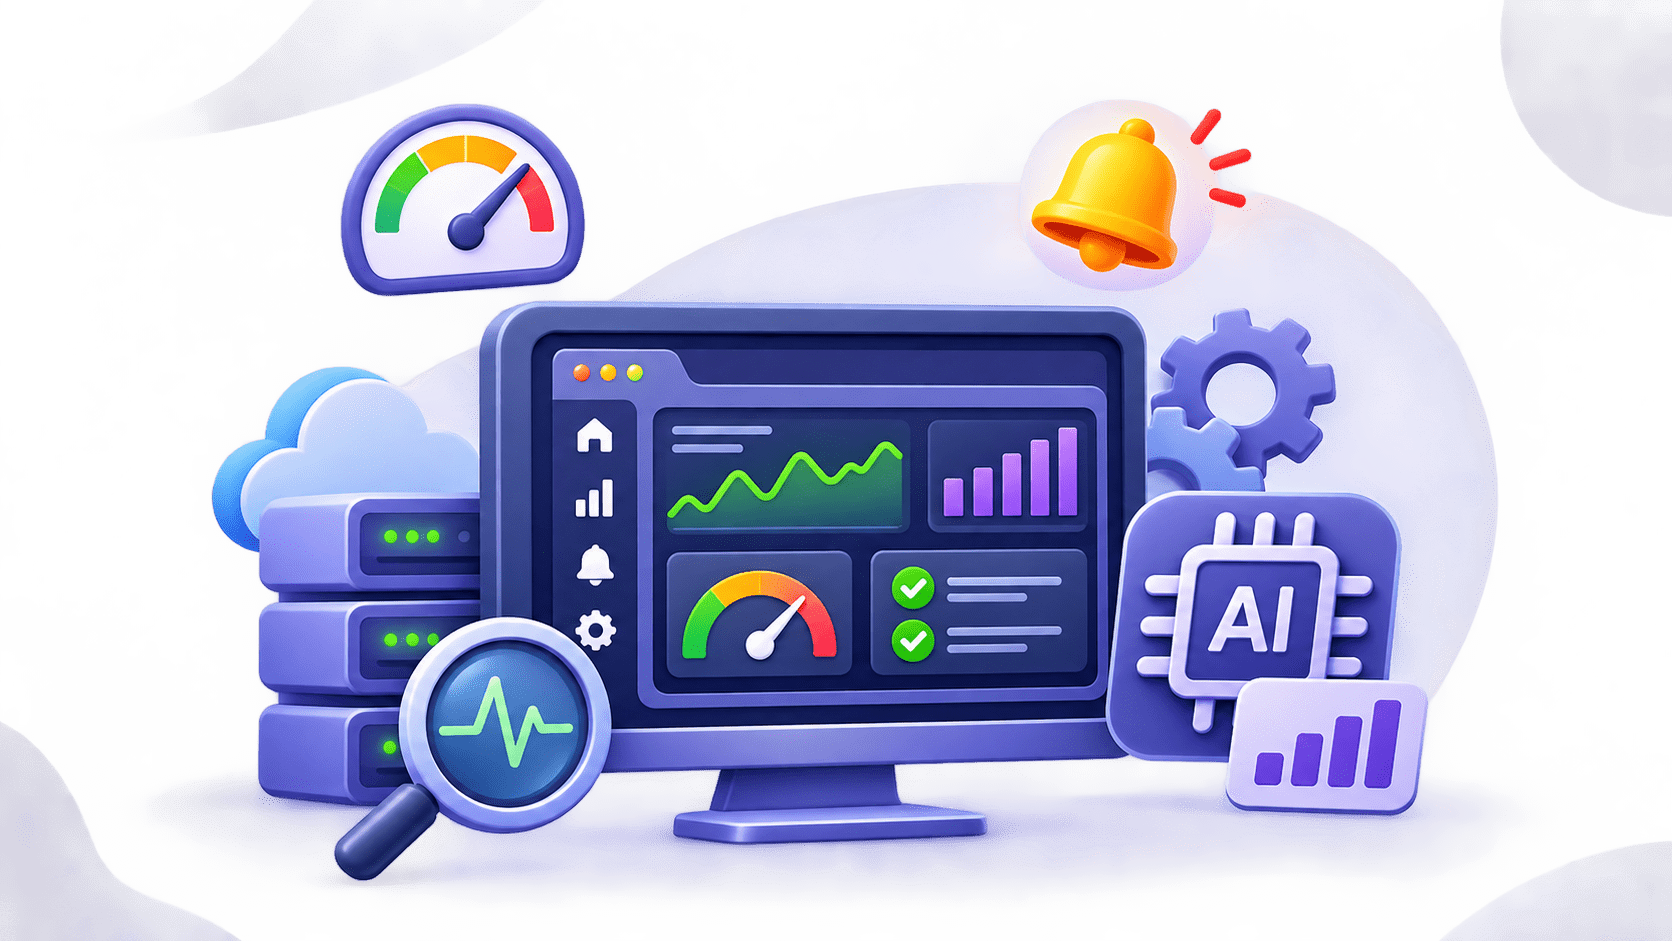
We monitor these details with dashboards and alerts, catching issues early to keep our application healthy.
This continuous process of tracking a live model's performance and health is called Production Monitoring.
Like a car dashboard, we must constantly check that our API responds quickly, errors aren't occurring, and the model's predictions remain accurate.
Now, think about our application. Once our machine learning model is deployed and live, we cannot simply leave it running and assume everything is fine.
We monitor these details with dashboards and alerts, catching issues early to keep our application healthy.
This continuous process of tracking a live model's performance and health is called Production Monitoring.
Like a car dashboard, we must constantly check that our API responds quickly, errors aren't occurring, and the model's predictions remain accurate.
Now, think about our application. Once our machine learning model is deployed and live, we cannot simply leave it running and assume everything is fine.
We monitor these details with dashboards and alerts, catching issues early to keep our application healthy.
This continuous process of tracking a live model's performance and health is called Production Monitoring.
Like a car dashboard, we must constantly check that our API responds quickly, errors aren't occurring, and the model's predictions remain accurate.
Production Monitoring is the process of continuously checking a live application or system to make sure it is working properly, performing well, and delivering correct results to users.
What does it do?
Step 1: Log every prediction with its request_id (from 7.6)
Step 2: Watch proxy signals now: shifts in inputs, prediction distribution, and confidence often appear before accuracy drops.
Step 3: Collect quick feedback: counsellors marking a score wrong, users clicking "not helpful".
Step 4: Join real outcomes when they arrive (enrolment in weeks, dropout in months) and compute accuracy per week.
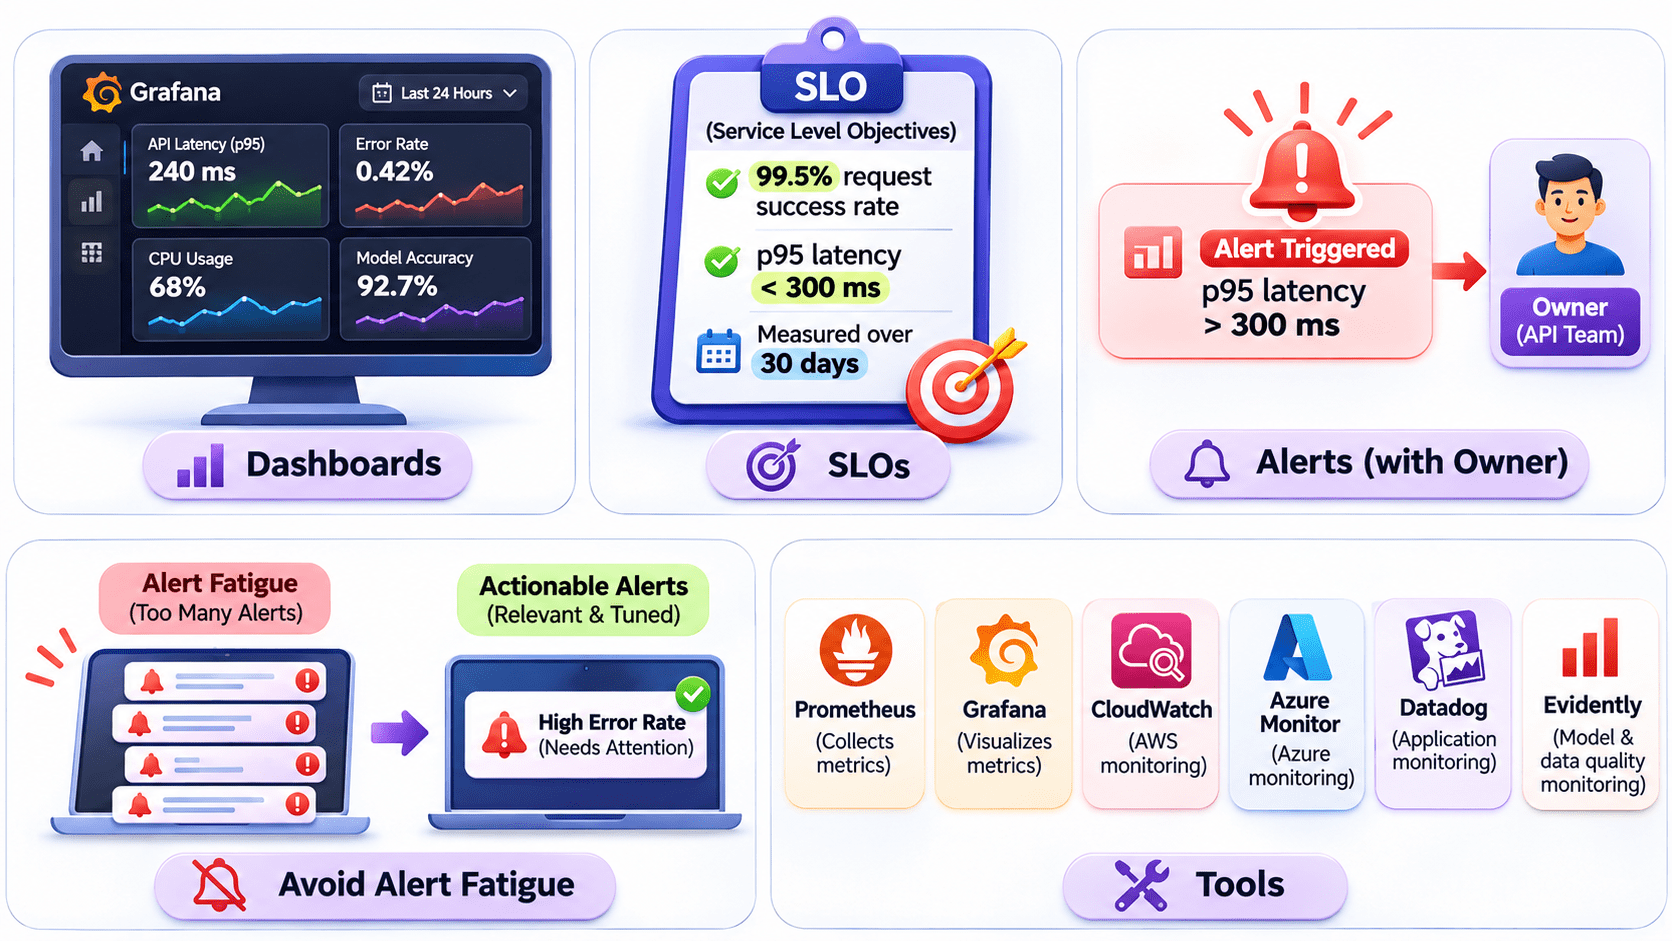
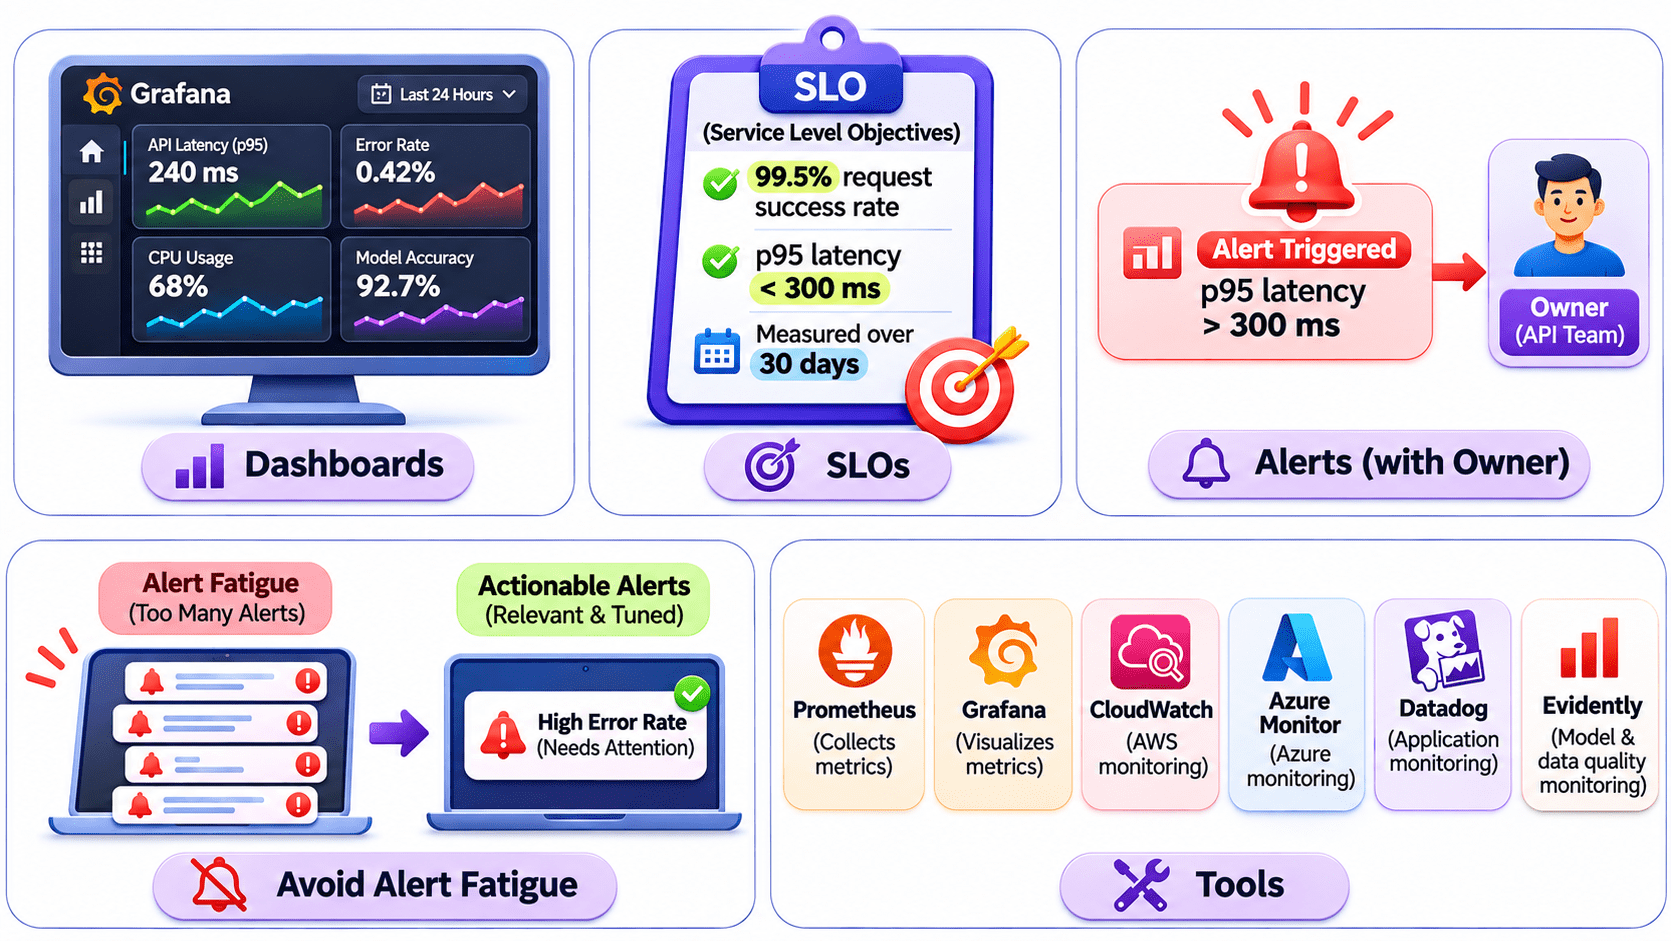
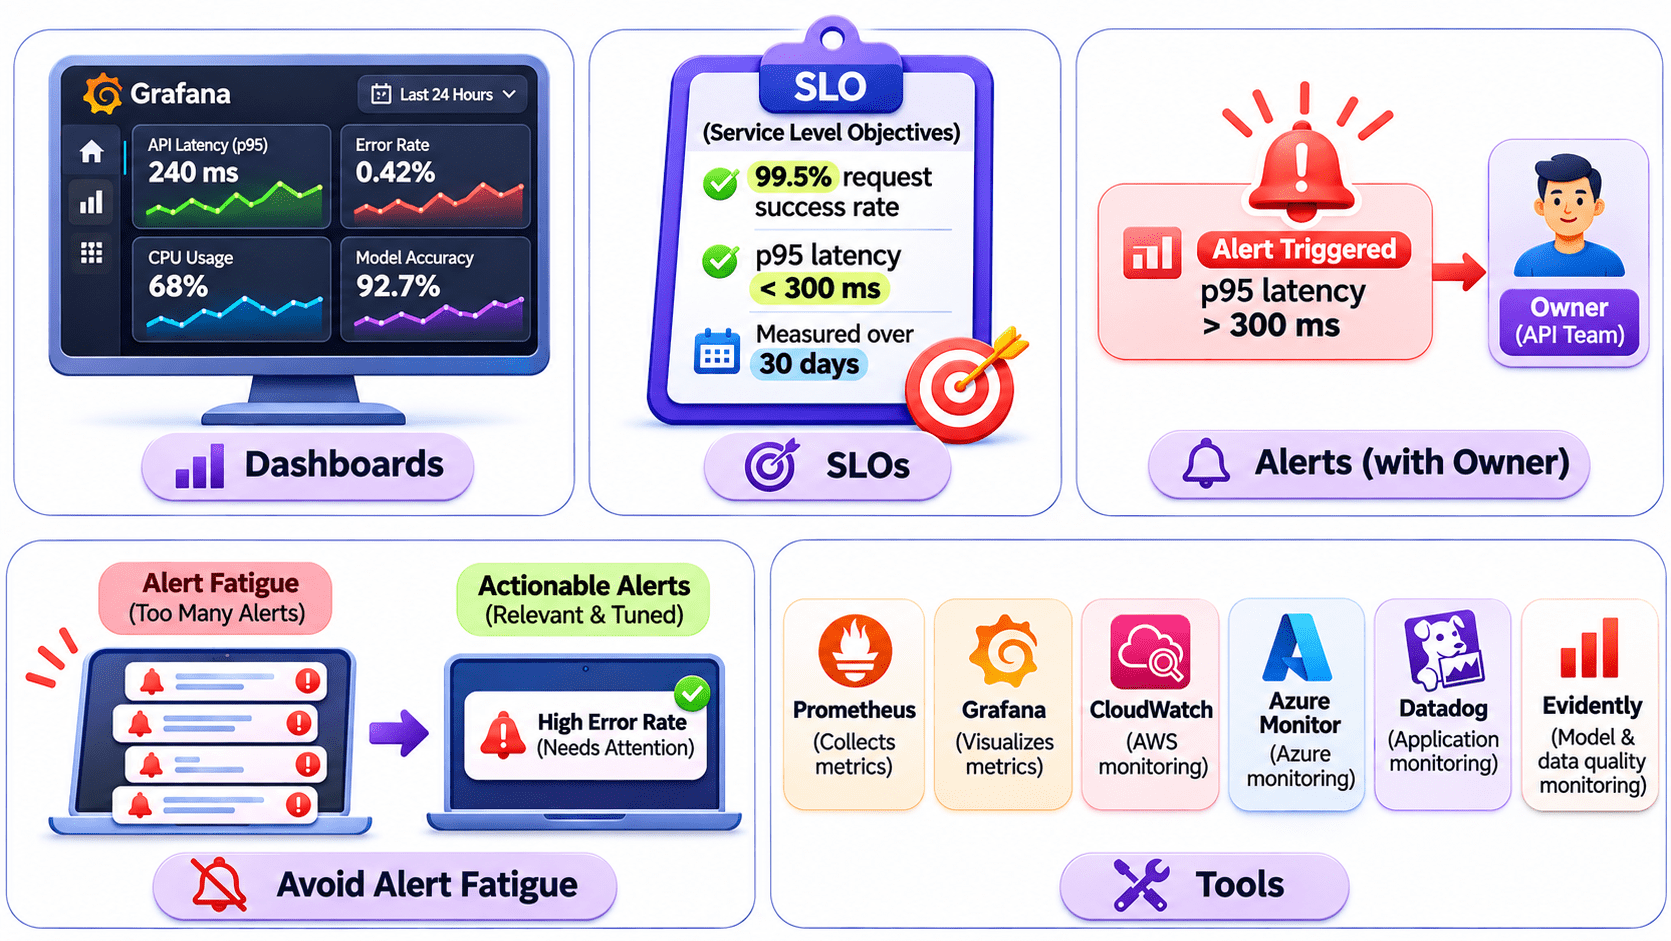
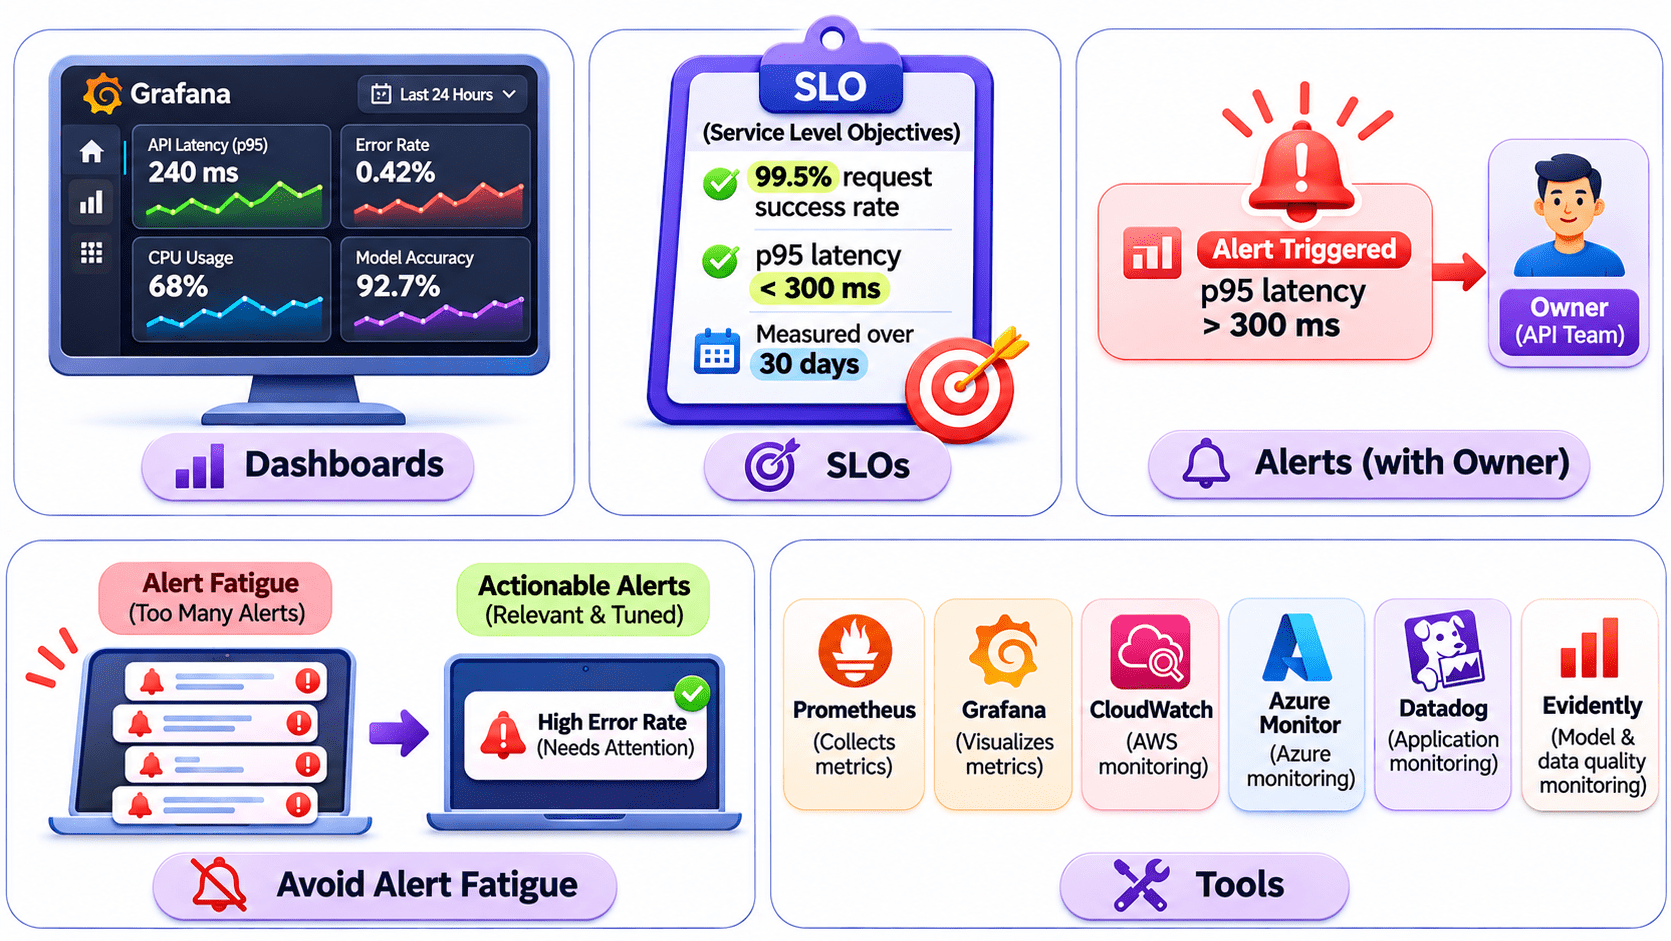
Dashboards
Each layer's key metrics over time, so trends show at a glance.
SLOs
Agreed targets, e.g., 99.5% success and p95 under 300 ms over 30 days.
Alert
High error rate or slow p95, each routed to a named owner.
Avoid alert fatigue
Every alert must be actionable; tune or remove noisy ones.
Tools
Prometheus + Grafana (FastAPI exposes /metrics), CloudWatch, Azure Monitor, Datadog;
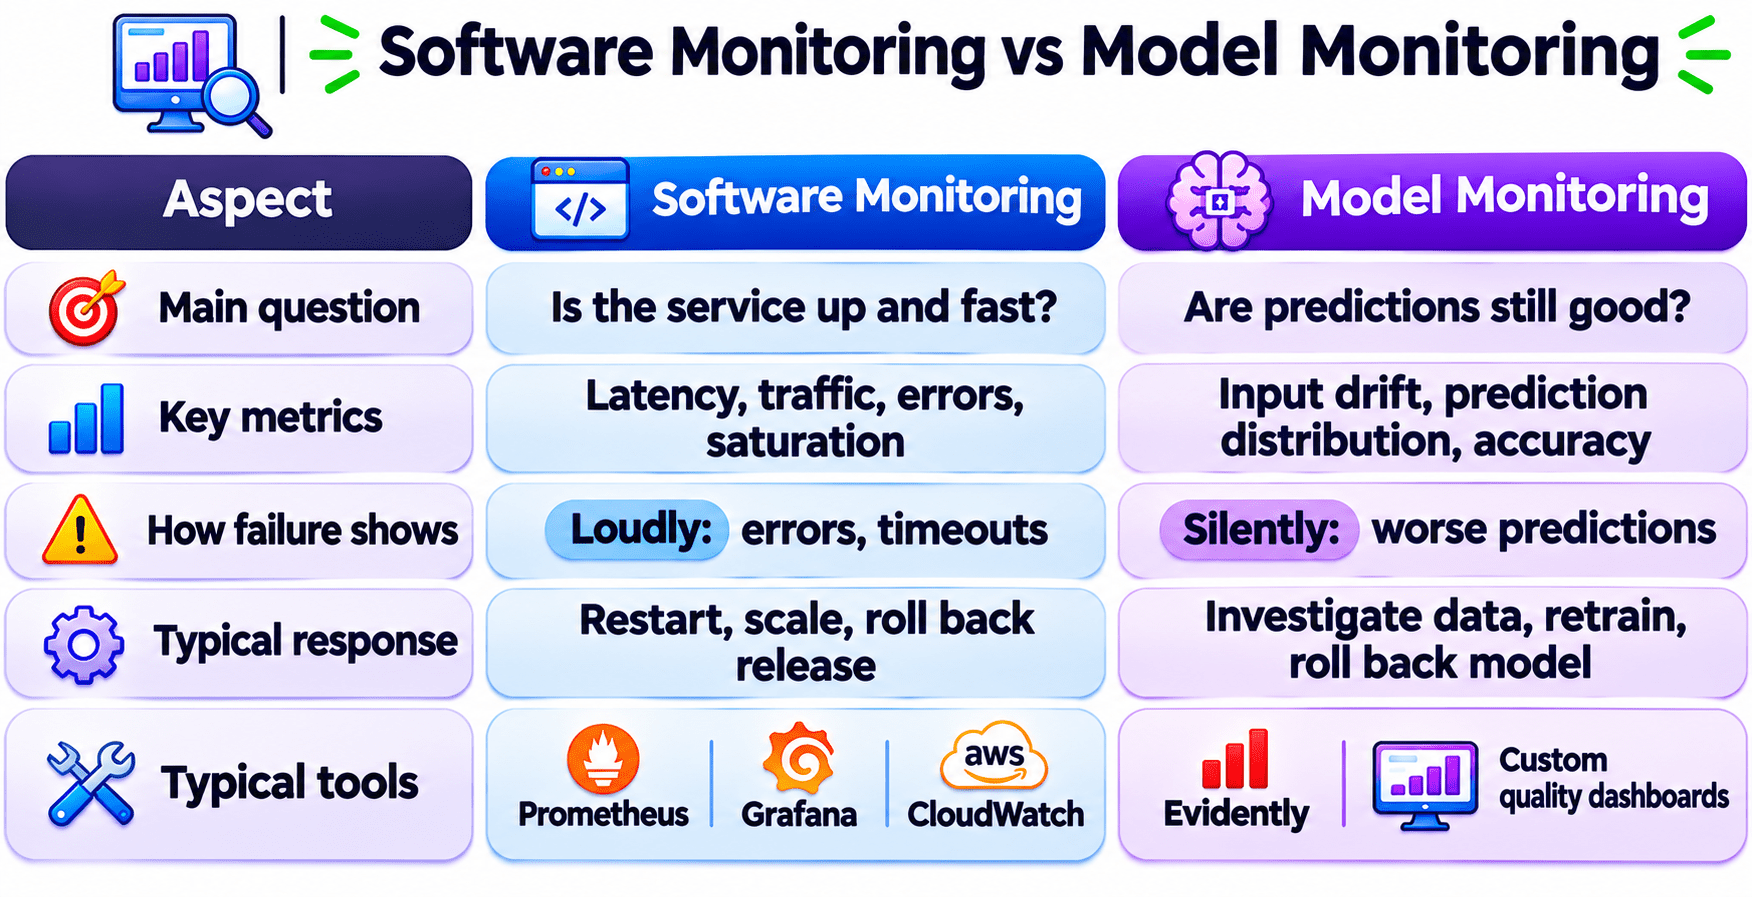
Let's look at a few real-world scenarios and identify whether the issue comes from the software infrastructure or the machine learning model based on the symptoms we observe.
p99 latency jumps right after a new image is deployed
Precision dropped steadily with no errors and normal latency
The container restarts whenever memory hits its limit
Let's look at a few real-world scenarios and identify whether the issue comes from the software infrastructure or the machine learning model based on the symptoms we observe.
p99 latency jumps right after a new image is deployed
Precision dropped steadily with no errors and normal latency
The container restarts whenever memory hits its limit
Software problem
Software problem
Model problem
Summary
4
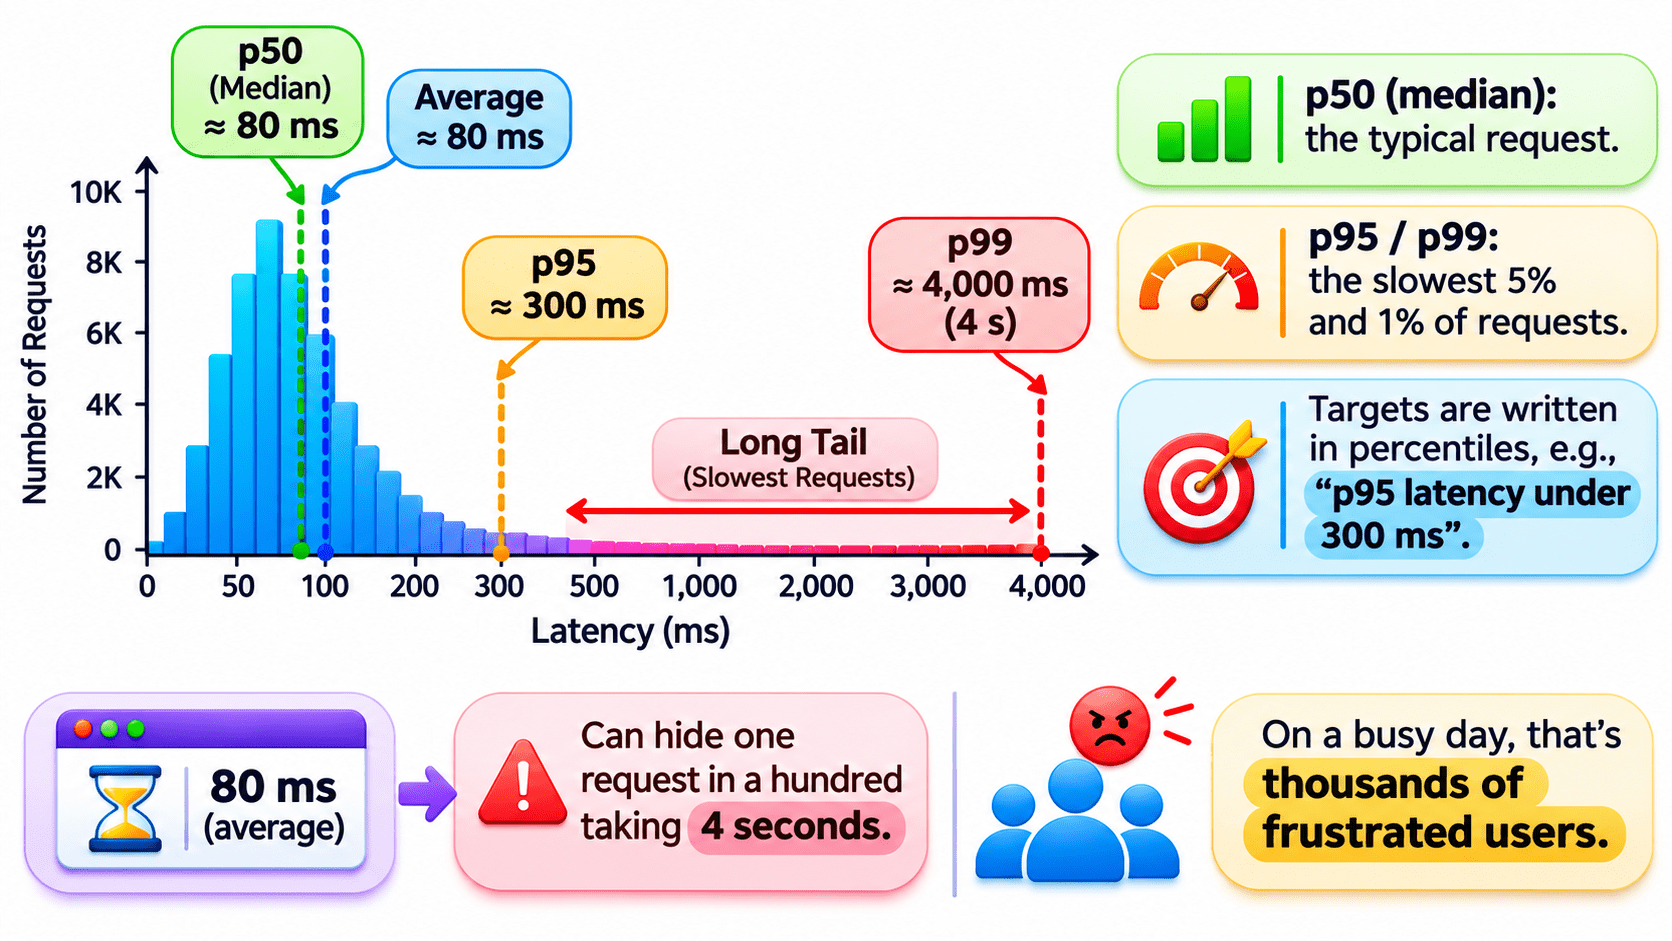
Read latency as p95/p99, not averages.
3
Latency, traffic, errors, saturation.
2
1
5
Alert only on what someone can act on.
Watch infra, service, data, model, business.
Healthy software can still predict badly.
Quiz
Average latency is 80 ms, yet users keep complaining about slow responses. What should you check first?
A. p99 latency
B. Average CPU usage
C. Total requests per day
D. Model accuracy
Average latency is 80 ms, yet users keep complaining about slow responses. What should you check first?
A. p99 latency
B. Average CPU usage
C. Total requests per day
D. Model accuracy
Quiz-Answer
By Content ITV