Book 3. Operational Risk
FRM Part 2
OR 4. Risk Measurement and Assessment
Presented by: Sudhanshu
Module 1. Operational Loss Data and Qualitative Risk Assessment
Module 2. Key Indicators and Quantitative Risk Assessment
Module 3. Operational Risk Capital and Resilience
Module 1. Operational Loss Data and Qualitative Risk Assessment

Topic 1. Operational loss data and incidents
Topic 2. Regulatory Requirements for Operational Loss Data
Topic 3. Data Collection Process
Topic 4. Comprehensive Data
Topic 5. Incident Dates
Topic 6. Boundary Events
Topic 7. Data Quality Requirements
Topic 8. Operational Risk Data
Topic 9. Risk and Control Self-Assessments (RCSAs)
Topic 10. RCSAs: Impact scales
Topic 11. RCSAs: Likelihood Assessment scales
Topic 12. RCSAs: Heatmaps
Topic 1. Operational Loss Data and Incidents
-
Importance of Historical Data: Risk management and measurement heavily utilize historical losses and events.
-
Operational Risk Management (ORM) Framework: The ORM framework is structured in four concentric circles:
-
Incident/loss database
-
Assessment through RCSAs
-
Monitoring through KRIs
-
Takeaways from major loss events or high-risk exposures
-
-
Benefits of Incident Information
-
Internal incident information aids in scenario identification and assessment, and helps quantify regulatory capital reserves.
-
Information on incidents at other banks provides general awareness and allows for necessary precautions or risk mitigation techniques.
-
Thorough and reliable incident data helps minimize Pillar 2 extra capital requirements.
-
Topic 2. Regulatory Requirements for Operational Loss Data
-
Basel Committee on Banking Supervision (BCBS) Criteria: The BCBS outlines numerous criteria for data quality and collection. Key requirements include:
-
At least 10 years of data
-
Minimum collection threshold of EUR20,000
-
Internal losses classified into Basel event-type categories
-
Reporting of occurrence and recovery dates
-
-
Other Criteria: Regulatory criteria also cover governance issues and the exclusion of losses due to credit and market risk.
Topic 3. Data Collection Process
-
Documented Procedures: Banks must have "documented procedures and processes for the identification, collection, and treatment of internal loss data".
-
Clarity and Standardization: Clarity on what is reported is the first step to ensure sufficient data quality.
-
Items to consider include dates, incident types, thresholds, and loss quantification.
-
A standardized approach to gathering and reporting information is crucial.
-
-
Challenges: Operational incidents are often challenging to describe, and quantification can be subjective.
-
Free Text Usage: The use of free text should be carefully controlled to provide only supplementary detail, not the primary source of loss information.
-
Data Fields for Reporting: Common data fields used in reporting include:
-
Place of occurrence
-
Date of occurrence
-
Event type and Cause type
-
Control failures
-
Impact type (loss, gain, near miss) ,
-
Gross loss, Recovery and Net loss
-
Topic 4. Comprehensive Data
-
Material Activities and Exposures: Internal loss data must "capture all material activities and exposures from all appropriate subsystems and geographic locations".
-
Loss Reporting Threshold: While the BCBS does not clarify "material activities and exposures," the minimum loss reporting threshold is EUR20,000. Many banks use a lower threshold (e.g., EUR/USD/GBP 1,000-10,000).
-
Direct vs. Indirect Losses:
-
Regulations focus on recognizing financial losses directly stemming from operational incidents (e.g., compensatory payments, regulatory penalties, fund losses due to errors).
-
Less direct losses, such as lost customers due to reputation decline, are generally not technically considered by regulations.
-
Including less direct costs is good management practice for reflecting the full cost of operational risk and making better decisions.
-
-
Grouped Losses: Regulations require grouped losses with a common cause to be recognized. For example, an IT failure causing multiple related losses should be combined and reported as a grouped loss.
Topic 5. Incident Dates
-
Required Reporting: Loss events must be reported with gross loss amounts, net of recoveries, and reference dates. A summary of sources and causes should also be provided.
-
Four Relevant Dates
-
Occurrence: When the event first happened
-
Discovery: When the event was identified
-
Reporting: When the event was reported
-
Accounting: When the event was settled and entered into the bank's general ledger
-
-
Time Lags
-
The time between occurrence and discovery can be several years for certain incidents.
-
The settlement date can be years after occurrence, especially for incidents with regulatory and legal implications.
-
-
Internal Reporting: While regulations aren't specific on which date(s) to include for internal reporting, noting intervals between date pairs is useful.
-
Occurrence to discovery interval indicates visibility of issues.
-
Discovery to reporting interval measures reporting timeliness.
-
-
Caution with Old Data: Banks must exercise caution when analyzing recently "paid out" losses that occurred many years ago in a different business environment, as they may not be appropriate for future projections.
Practice Questions: Q1
Q1. A bank employee has been manipulating suspense (transitory) accounts for a prolonged time, and this event was determined to be a significant operational incident. Which of the following yime intervals in terms of the operational incident date is most likely to be the longest?
A. Date of reporting to date of accounting.
B. Date of discovery to date of reporting.
C. Date of occurrence to date of discovery.
D. Date of occurrence to date of reporting.
Practice Questions: Q1 Answer
Explanation: D is correct.
The dates of an operational incident (in order) are as follows: occurrence, discovery, reporting, and accounting. In the case of a prolonged and undiscovered manipulation of suspense accounts, the period between the date of occurrence and the date of discovery is long. However, because the date of reporting happens after
the date of discovery, then the time interval between the date of occurrence and the date of reporting would be the longest.
Topic 6. Boundary Events
-
Definition: Boundary events are those occurring in a risk class different from their cause. This can include market and/or credit losses caused by human error (operational in nature).
-
BCBS Classification
-
Boundary events are considered credit risk and not attributed back to their actual cause. Operational losses in a credit risk context are often included in Risk-Weighted Assets (RWAs) and therefore do not need to be included in operational losses if already in RWAs.
-
Boundary events are not considered market risk. Therefore, operational losses in a market risk context are included in operational losses.
-
Topic 7. Data Quality Requirements
-
Independent Review: The BCBS requires banks to "have processes to independently review the comprehensiveness and accuracy of loss data".
-
Corroboration: Corroboration from multiple sources, including the general ledger (GL), is required to ensure completeness of significant losses.
-
General Ledger Limitations:
-
Captures only direct, easier-to-quantify items, often omitting intangible/harder-to-quantify indirect items.
-
May not record items that indirectly show up as lower revenues, but should be recorded as expenses or losses on the income statement.
-
-
Other Data Sources:
-
IT logs can match IT issues to recorded operational incidents (e.g., P1/P2 IT issues equivalent to operational risk incidents).
-
Customer complaints, unfavorable press/media reports, and reserves for upcoming lawsuits help mitigate underreporting.
-
-
Addressing Underreporting: Underreporting, especially in smaller banks, can be due to uncertainty, unwillingness to pursue control failures, and avoidance of bureaucratic processes. Mitigation methods include gentle reminders, using risk metrics in managerial performance assessments, and internal audit involvement.
Topic 8. Operational Risk Data
-
Distinct Characteristics: Operational risk data differs vastly from market and credit risk data.
-
Idiosyncratic and Uncorrelated: It is idiosyncratic and largely uncorrelated to general markets, posing challenges for measurement and modeling.
-
Fat Tails: The presence of wide (fat) tails in their returns and frequency distributions indicates a greater occurrence of extreme events.
-
Interrelated Nature: The interrelated nature of operational risk creates interpretive difficulties in linking causes and effects.
Topic 9. Risk and Control Self-Assessments (RCSAs)
-
Purpose: RCSAs involve assessing the probability and severity of operational risk.Types of Risk Assessment:
-
Inherent Risk: Assessment without considering current controls.
-
Residual Risk: Remaining risk after considering control effectiveness.
-
-
Frequency: Typically performed annually, but quarterly for very significant operational risks.
-
Process: Usually involves discussions among participants about inherent risks, controls, and control effectiveness. Questionnaires may be used at larger banks.
-
Control Types:
-
Preventive: Reduce the chance of risk materializing.
-
Corrective: Minimize negative effects if a risk materializes.
-
-
Objective: To understand inherent risks, internal controls, and residual risks, and determine if additional mitigation is needed.
-
Nature: Primarily nonquantitative and requires significant judgment; not meant to quantify risk exposures.
-
Backtesting: Some banks backtest RCSA results against historical incidents, often revealing underestimates of probability but overestimates of severity.
-
Alternatives: Risk and Control Assessment (RCA) and Residual Risk Self-Assessment (RRSA).
-
Disadvantages: Subjectivity, behavioral biases, limited data, and inconsistency between business units. Standardized risk descriptions and definitions are needed for consistency.
-
Output: Documented and sent to unit managers for approval, outlining significant residual risks and potential consequences of control failures.
-
Risk Mitigation: Helps identify if risk is within appetite; if not, new controls, enhanced existing controls, exposure reduction (e.g., reduced transaction volumes), or insurance may be implemented.
Topic 9. Risk and Control Self-Assessments (RCSAs)
Practice Questions: Q2
Q2. Which of the following statements regarding risk assessment is most accurate?
A. Risk and control self-assessments (RCSAs) are a good mixture of qualitative and quantative aspects.
B. The main purpose of risk assessment is to prioritize risk management and risk mitigation responses.
C. When backtesting the results of risk assessment against past incident experience, there is a tendency to overestimate the likelihood of an operational risk event.
D. When backtesting the results of risk assessment against past incident experience, there is a tendency to underestimate the impact of an operational risk event.
Practice Questions: Q2 Answer
Explanation: B is correct.
RCSAs are qualitative and largely judgment based. When backtesting the results of risk assessment against past incident experience, there is a tendency to underestimate the likelihood and overestimate the impact of an operational risk event.
Topic 10. RCSAs: Impact Scales
-
Definition: Impact refers to financial, regulatory, customer, and reputation aspects; in resilience, it can include continuity of service.
-
Ratings: Typically consist of four or five ratings (e.g., low, medium, high, very high, extreme).
-
Measurement:
-
Financial Impacts: Usually based on a relative measure like percentage of revenue or operating income to accommodate different sizes.
-
Customer Impacts: Usually based on a percentage of the customer base.
-
Regulatory and Reputation Impacts: Typically nonquantitative, though some metrics may be used.
-
Topic 11. RCSAs: Likelihood Assessment Scales
-
Measurement: Stated as a probability or frequency of occurrence.
-
Time Horizon: RCSAs have a maximum time horizon of 1 year.
-
Probability Example: A 1-in-25-year event signifies a 4% chance of occurring within the year, not necessarily occurring once over a 25-year period.
-
Historical Data Limitations: History is a starting point but can be a poor indicator of the future, especially in volatile environments or with emerging risks (e.g., technological advancements, cyberattacks).
-
Rating Categories: A five-point scale might include: remote, unlikely, possible, likely, highly likely.
Topic 12. RCSAs: Heatmaps
-
Definition: The RCSA matrix, or heatmap, combines likelihood and impact.
-
Color-Coded Intensity: Combinations are assigned colors (e.g., green, yellow, amber, red) corresponding to risk intensity.
-
Green: Permissible risk exposure, no further steps needed (e.g., possible likelihood, low impact; or remote likelihood, high impact).
-
Yellow: Permissible but near limit, monitoring and mitigation steps may be needed (e.g., likely likelihood, low impact; or unlikely likelihood, high impact).
-
Amber: Exceeds permissible limit, risk must be lowered or escalated for approval (e.g., likely likelihood, medium impact; or remote likelihood, extreme impact).
-
Red: Far exceeds permissible limit, risk must immediately be lowered (e.g., likely likelihood, high impact; or unlikely likelihood, extreme impact).
-
-
Qualitative Nature: Ratings are qualitative and should not be compared mathematically. For example, a "remote chance/major impact" risk is not mathematically equivalent to a "possible chance/low impact" risk, even if numerical ratings might appear so.
Module 2. Key Indicators and Quantitative Risk Assessment
Topic 1. Key Risk Indicators (KRIs)
Topic 2. Key Performance Indicators (KPIs)
Topic 3. Key Control Indicators (KCIs)
Topic 4. Fault Tree Analysis (FTA)
Topic 5. Factor Analysis of Information Risk (FAIR)
Topic 6. Swiss Cheese Model
Topic 7. Root-Cause Analysis
Topic 1. Key Risk Indicators (KRIs)
-
Definition: KRIs indicate a bank's exposure level at a specific point in time.
-
Preventive KRIs: These show a rise or fall in the intensity of a cause of a risk.
-
They indicate a rise or fall of the impact or likelihood of the risk.
-
-
Examples of KRIs for Likelihood:
-
Increase in the number of transactions processed per employee (risk of error).
-
Increase in sales level needed to earn a bonus (risk of fraud).
-
-
Examples of KRIs for Impact:
-
Increase in the sensitivity of data maintained on a server (greater impact if data leakage were to occur).
-
Increase in transaction limits for traders (greater impact if unauthorized trading were to occur).
-
-
Risk Appetite and Priorities: KRIs account for the bank's risk appetite, and the chosen metrics reflect the bank's priorities in terms of its goals and the most important risks to manage.
-
Thresholds: Thresholds in KRIs reflect the level of control desired by management for risk mitigation.
Topic 2. Key Performance Indicators (KPIs)
-
Definition: KPIs provide measurements on how effectively the bank operates.
-
Examples of KPIs:
-
Number of customer complaints.
-
Error rates on customer transactions.
-
Average downtime of IT systems.
-
Topic 3. Key Control Indicators (KCIs)
-
Definition: KCIs provide measurements on how effectively the bank's controls are operating.
-
Examples of KCIs: Number of business continuity plans not reviewed or updated before the set due dates.
-
Errors remaining after two sets of independent and qualified reviews.
-
Number of general ledger data entry errors after application of edit checks.
-
-
Significant Overlap: KRIs, KPIs, and KCIs often overlap significantly, and a single metric can have elements of all three. This is particularly true when analyzing a deficiency from a required benchmark level.
-
Control Failures: Key control failures are an automatic source of risk and can embody elements of KRIs, KPIs, and KCIs.
-
Example Scenario: Scenario: Control failure with incorrect transaction processing despite multiple checks.
-
KCI: Relates to the inaccurate transaction processing.
-
KRI: Relates to increased risk of litigation by customers resulting from the errors.
-
KPI: Relates to weak back-office abilities.
-
Practice Questions: Q3
Q3. One of the bank's compliance managers notices that there are two business continuity plans that have not been reviewed, and it is now past their review due date. The incomplete reviews of the business continuity plans are best described as a:
A. key assessment indicator.
B. key control indicator.
C. key performance indicator.
D. key risk indicator.
Practice Questions: Q3 Answer
Explanation: B is correct.
KCIs provide measurements on how effectively the bank’s controls are operating and, in that regard, the fact that the business continuity plans are now past due their review date means that the control of the due date is not operating effectively. KRIs will indicate the bank’s exposure level at a specific point in time. KPIs provide measurements on how effectively the bank operates.
Topic 4. Fault Tree Analysis (FTA)
-
Nature: FTA is a deductive failure analysis method where fault trees break down failure scenarios into external and internal conditions necessary for a major event to occur.
-
Application in Banks: Increasingly used in banks where a chain of failures leads to a major loss.
-
Conditions: Conditions can happen simultaneously ("AND conditions") or alternately ("OR conditions").
-
Joint Probability (Independent Events): Assuming all events are independent, the joint probability of occurrence is the multiplicative product of their separate probabilities.
-
Example: Four independent controls each with a 5% chance of failing, the probability of all failing simultaneously is 0.054=0.00000625=0.000625%. This represents the minimum probability of the scenario.
-
-
Real-World Independence: In reality, failures are unlikely to be completely independent, as controls are often designed together.
-
Conditional Probabilities: Conditional or Bayesian probabilities are needed for a more realistic sense of occurrence, where probabilities are updated with new information.
-
Example: Probability of transaction error increases given an IT service interruption.
-
-
Exposure Consideration: It's crucial to consider exposure (e.g., number of employees) in addition to low failure rates when assessing likelihood.
-
Risk Factor Probabilities: Causal analysis requires estimating risk factor probabilities from third-party and empirical information.
-
Probabilities for weather-related events might come from insurance companies.
-
Baseline probabilities for scenarios can be derived from peer experiences.
-
Worst-case scenarios from RCSA sessions might also be considered.
-
Topic 4. Fault Tree Analysis (FTA)
Practice Questions: Q4
Q4. In the context of a potential nonmalicious data leakage incident by a bank employee, the following information is provided:
- There is a 99 % chance that bank employees will receive a phishing email through their work email.
- There is a 95% chance that the bank's firewalls will operate as intended.
- There is a 90% chance that the employee will know to immediately delete the phishing email.
- There is a 3 % chance that the detective controls of suspicious network activity will fail.
- There is a 1 % chance that there will be an exit of the leaked information.
Using fault tree analysis (FTA) and assuming that the conditions just listed are fully independent, the likelihood of the risk of data leakage materializing for a given time period is closest to:
A. 0.0001485 %.
B. 0.0004365 %.
C. 0.0048015%.
D. 0.0253935 %.
Practice Questions: Q4 Answer
Explanation: A is correct.
The equation is 0.99 (phishing email received) × 0.05 (firewall failure) × 0.10 (employee failure) × 0.03 (activity detection failure) × 0.01 (exit of information) = 0.000001485 = 0.0001485%.
Topic 5. Factor Analysis of Information Risk (FAIR)
-
Concept: In factor models like FAIR, risks are broken down into individual factors.
-
Three Steps of FAIR Model:
-
Determine risk factors and how they interrelate.
-
Measure each factor.
-
Computationally combine all factors.
-
-
Output: The output is a loss distribution for a given scenario.
-
Scenario Attributes: Scenarios have attributes such as: Asset at risk.
-
Threat.
-
Threat type.
-
Losses occurring if risk occurs.
-
-
Estimates and Distributions: Estimates are made for the frequency of losses and likely loss amounts, all expressed as distributions (not single points). These distributions serve as inputs for Monte Carlo simulations.
-
Monte Carlo Output: The output from Monte Carlo simulations is the distribution of the simulated losses.
Topic 6. Swiss Cheese Model
-
Analogy: The model posits that defensive layers are like slices of Swiss cheese with continually shifting holes.
-
Risk Materialization: A bad outcome typically only occurs when holes in multiple layers momentarily align, allowing a "trajectory of accident opportunity" that brings hazards into damaging contact with victims.
-
Control Layering: Proper control layering is essential to prevent the alignment of these "holes" and avoid a "perfect storm".
-
Control Characteristics:
-
Control failure rates should not be correlated.
-
Compensating controls should effectively nullify any weaknesses.
-
Periodic reviews are required to ensure controls remain independent and reliable.
-
Topic 7. Root-Cause Analysis
-
In an operational risk context, root-cause analysis is performed by the first line of defense for significant incidents and near misses.
-
The second line of defense then adds to and/or queries the analysis
-
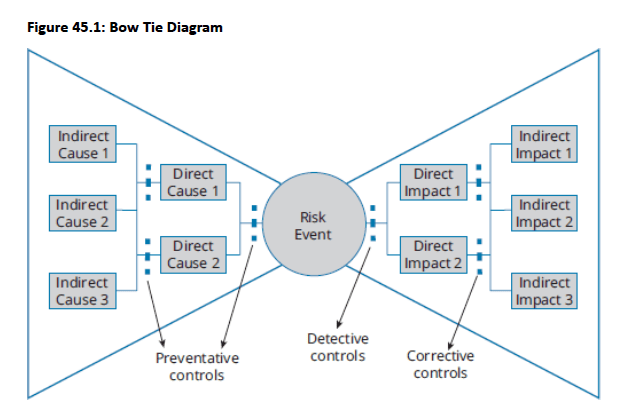
Risk event placed centrally with causes/preventive controls on left side and impacts/detective/corrective controls on right side
- Assesses expected frequency and severity of incidents considering all controls, examining direct, indirect, and root causes while identifying additional relevant KRIs
- Root cause analysis provides stronger incident comprehension and control failure assessment, enabling more accurate frequency estimation and effective impact minimization through timely detection
Module 3. Operational Risk Capital And Resilience
Topic 1. Loss Distribution Approach (LDA)
Topic 2. Extreme Value Theory (EVT)
Topic 3. Internal and External Loss Data
Topic 4. Capital Modeling
Topic 5. Operational Resilience
Topic 1. Loss Distribution Approach (LDA)
- LDA most common approach supplemented by extreme value theory/scenario analysis for tail risk, separating loss events into frequency and severity to double modeling data
- Distribution Modeling: Frequency uses discrete Poisson distributions (parameter λ = mean/variance) while severity uses continuous, asymmetric lognormal distributions with fat tails for positive values only
- Monte Carlo Convolution: Independent frequency and severity distributions combined through millions of random draws to create aggregated loss distribution, with alternative equation-based methods available
- Independence Assumptions: LDA assumes distributions are independent despite empirical evidence showing high frequency/low severity vs. low frequency/high severity patterns, plus no correlation within risk classes
- Unit of Measure Challenges: Clustering data into homogeneous UoMs (external fraud, internal fraud per unit, processing errors) is difficult due to operational risk diversity, creating trade-off between homogeneity and data availability
- Capital Calculation: 99.9th percentile of total loss distribution determines stand-alone operational risk capital, with UoM aggregation through copulas to analyze tail dependence and extreme value relationships
- Model Limitations: LDA cannot handle very-high skewness of operational losses, requiring addition of large losses, extreme value theory application, or scenario analysis integration
Topic 2. Extreme Value Theory (EVT)
-
The two EVT methods are as follows:
- The block maxima (Fisher-Tippett) approach looks at the maximum operational loss per equally spaced time period and per UoM when considering the distribution of such losses.
- The peaks-over-threshold (POT) approach looks at items past a specific high threshold that would be considered “sufficiently large.” The distribution of the amounts past the threshold could be estimated with the generalized Pareto distribution (GPD).
Topic 3. Internal and External Loss Data
- Multiple Functions: Internal loss data serves as detailed risk/control failure information source and starting point for Loss Distribution Approach (LDA) modeling
- Critical Mass Generation: Provides numerous data points for distributions, especially high-frequency, moderate-severity events with greater bank relevance and detail than external data
- Causal Insights: Internal incident databases offer risk exposure and loss cause information valuable for scenario analysis and assessment purposes
- Data Limitations: Differences exist between incident databases and modeling data due to unreported exceptional incidents (near misses, inadvertent gains) omitted from frequency/severity calculations
- External Complement: Internal data must be supplemented with external bank data from public sources, member databases, and industry associations (ORX) for comprehensive loss outcome understanding
- Relevance Factors: External data selection considers geographic location, activity concentration, and materiality thresholds to ensure comparable and relevant loss information
- Combination Methods: Data integrated through scaling (size/inflation adjustments), cut-off mix (external data when internal insufficient), and filtering (inclusion/exclusion rules to avoid result manipulation)
Practice Questions: Q5
Q5. A quantitative analyst is in the process of combining internal and external loss data for model calibration purposes. The analyst has established specific criteria for the inclusion or exclusion of
losses in the dataset. The method used by the analyst is best described as:
A. cut-off mix.
B. filtering.
C. scaling.
D. rule based.
Practice Questions: Q5 Answer
Explanation: B is correct.
Filtering involves setting specific rules for the inclusion or exclusion of losses in the dataset to be used for modeling to avoid potential manipulation of results.
With cut-off mix, at a specific loss threshold when there are few(er) internal losses, then external losses would be included in the model to have sufficient data points to generate a reliable distribution. With scaling, there are size adjustments for losses to be consistent with the bank's size or inflation adjustments when a large number of years are involved. In this context, there is no such thing as a rule-based method.
Topic 4. Capital Modeling
- Modeling Shift: New standardized approach eliminates operational risk modeling requirements for regulatory capital, focusing modeling on Pillar 2 ICAAP, stress testing, and operational resilience
- Capital Objective: Banks must determine capital for 99.9% confidence level over one-year horizon, setting regulatory capital congruent with bank's risk profile
- ICAAP Framework: Pillar 2 covers financial and non-financial risks through self-assessment of capital sufficiency considering business nature, medium-term risk changes, and current controls
- Scenario Process: Operational risk ICAAP involves choosing and quantifying scenarios based on current business risks, past experiences (internal/external), and existing controls
- Aggregation Methods: Smaller banks use simpler provisioning (largest scenario plus cluster scenarios); larger banks employ complex methods like variance-covariance matrices or copulas
- Regulatory Reporting: Full justification required for scenario selection and quantification, including explanations for eliminated scenarios and probability estimates for different states
- Economic Capital: ICAAP enables banks to compute internal capital needed to meet potential losses, remain going concern, and maintain external credit ratings
Topic 5. Operational Resilience
- Operational Resilience Goal: Banks must assess future profit and reputation risks from operational events, ensuring sufficient resilience to recover through strong ORM frameworks
- BCM vs. Resilience: Business continuity management focuses on individual process continuity/recovery; resilience specifically targets "important business services" (IBSs) with defined impact tolerances
- Seven-Step Framework: Process includes determining IBSs, establishing impact tolerances, mapping resources, designing realistic stress scenarios, implementing lessons learned, preparing communication plans, and conducting annual board-approved self-assessments
- Bank-Specific Focus: IBSs differ between banks based on business focus; larger banks must prioritize and narrow IBS lists due to complexity involving multiple departments and extensive resources
- Business Impact Analysis: Step 2 requires BIA reports examining operational/financial disruption implications (lost sales/profits, additional costs/penalties, customer loss) to prioritize business process restoration
- Single Points of Failure: SPOFs serve as appropriate KRIs and should be eliminated through backups/redundancies or included in tolerance thresholds and stress tests
- Resilience KRI Examples: Key dependencies include specialized employees (coding/cybersecurity experts) with undocumented processes and irreplaceable key suppliers (IT, data, internet providers)
Copy of OR 4. Risk Measurement and Assessment
By Prateek Yadav


