Book 5. Risk and Investment Management
FRM Part 2
IM 17. Illiquid Assets
Presented by: Sudhanshu
Module 1. Illiquid Markets, Market Imperfections, Biases and Unsmoothing
Module 2. Illiquidity Risk Premiums and Portfolio Allocation to Illiquid Assets
Module 1. Illiquid Markets, Market Imperfections, Biases and Unsmoothing

Topic 1. Illiquid Asset Markets
Topic 2. Market Imperfections
Topic 3. Liquidity Challenges
Topic 4. Illiquid Asset Return Biases
Topic 1. Illiquid Asset Markets
-
Key Characteristics of Illiquid Markets:
-
Most asset classes are illiquid, at least to some degree.
-
Markets for illiquid assets are large.
-
Illiquid assets comprise the bulk of most investors’ portfolios.
-
Liquidity dries up even in liquid asset markets.
-
-
Most Asset Classes are Illiquid
-
All markets, even large-cap equity markets, are somewhat illiquid. However, some assets (e.g., real estate) are less liquid than others (e.g., public equities).
-
Illiquid assets trade infrequently, in small amounts, and generally exhibit low turnover.
-
There are mere seconds between transactions in public equity markets with an annualized turnover rate greater than 100%. In contrast, OTC equities typically trade within a day, but sometimes a week or more may pass between trades, with annualized turnover of 25% to 35%.
-
Corporate bonds trade daily, and municipal bonds typically trade semiannually.
-
Institutional infrastructure have an average investment commitment of 50 to 60 years (up to 99 years), and art has 40 to 70 years between transactions. There is negligible turnover in infrastructure.
-
Turnover in residential real estate is about 5% per year, while turnover in institutional real estate is approximately 7%. Time between real estate transactions can range from months to decades.
-
-
Markets for Illiquid Assets are Large
- The size of the U.S. residential mortgage market was $16 trillion in 2012.
- The institutional real estate market was measured at $9 trillion. In contrast, the market capitalization of the NYSE and Nasdaq combined was approximately $17 trillion.
- The total wealth held in illiquid assets exceeds the total wealth in traditional, liquid stock, and bond markets.
-
Investor Holdings of Illiquid Assets
-
Homes are often individuals' most valuable assets, with illiquid assets representing approximately 90% of total wealth (excluding human capital).
- Human capital is the largest and least liquid asset for many individual investors.
-
U.S. high net worth individuals typically allocate 10% of portfolios to fine art and jewelry (treasure assets). Foreign high net worth individuals hold an average of 20% in treasure assets.
- University endowments increased illiquid asset allocations to approx 25%, up from 5% in the early 1990s.
- Pension funds increased allocations to approx 20%, up from 5% in 1995, showing that investors generally hold sizeable amounts of illiquid assets.
-
Topic 1. Illiquid Asset Markets
-
Liquidity Can Dry Up
-
In stressed economic periods, such as during the 2007–2009 Financial crisis, liquidity can dry up.
-
For example, money markets froze (i.e., repurchase agreement and commercial paper markets) during the crisis as investors were unwilling to trade at any price.
-
Residential and commercial MBS markets, structured credit markets, and the auction rate securities market, a market for floating rate municipal bonds, also became illiquid during the crisis.
-
The auction rate securities market is still frozen, more than six years later.
-
Major liquidity crises have occurred at least once every 10 years across the globe, in conjunction with downturns and financial distress.
-
Topic 1. Illiquid Asset Markets
Practice Questions: Q1
Q1. Global liquidity crises generally occur because:
A. governments choose not to engage in monetary policy actions to stimulate economies.
B. financial distress causes markets to freeze.
C. markets for illiquid assets shrink, causing liquidity issues to infect traditional asset classes.
D. transaction costs increase as developing economies get stronger.
Practice Questions: Q1 Answer
Explanation: B is correct.
In stressed economic periods, such as during the 2007–2009 financial crisis,
liquidity can dry up. Major liquidity crises have occurred at least once every ten
years across the globe, in conjunction with downturns and financial distress.
Topic 2. Market Imperfections
- Economic theories assume perfect markets: rational participants pursuing utility maximization, no transaction costs/regulation/taxes, perfectly divisible assets, perfect competition, and simultaneous information access.
- In reality, markets are imperfect, with various frictions that encourage illiquidity.
-
Imperfections that encourage illiquidity include:
-
Market participation costs: Costs associated with entering markets, including the time, money, and energy required to understand a new market. Clientele effect occurs when only certain investors with specific expertise, capital, and experience can participate in illiquid markets. Markets with limited investor suitability or high entry barriers exhibit reduced liquidity.
-
Transaction costs: Costs including taxes and commissions. Illiquid assets like private equity require additional due diligence costs: attorneys, accountants, and investment bankers. These costs can impede investment.
-
-
Even after paying transaction costs, an asset might not be liquid due to following challenges:
- Difficulties finding a Counterparty (i.e., search frictions): Finding buyers for complicated structured credit products or high-value assets (e.g., office towers, skyscrapers) can be extremely difficult. Transactions may take weeks, months, or years regardless of transaction cost magnitude.
- Asymmetric Information: Investors with less information become reluctant to trade when they suspect counterparties know more, increasing illiquidity. Extreme asymmetric information creates "lemons problem" where markets break down as no one wants to buy. Liquidity freezes often result from asymmetric information; searching for non-predatory counterparties creates an additional form of search friction.
- Price Impacts: Large trades can move markets, creating liquidity issues for the asset or entire asset class.
- Funding Constraints: Many illiquid assets are highly debt-financed (e.g., leveraged housing purchases at the individual level). Compromised access to credit prevents investors from transacting, regardless of asset quality or transaction costs.
Topic 3. Liquidity Challenges
Practice Questions: Q2
Q2. When an investor has difficulty ending a counterparty for a complicated credit product like a structured debt instrument, this is known as:
A. market participation costs.
B. agency costs.
C. search frictions.
D. selection bias.
Practice Questions: Q2 Answer
Explanation: C is correct.
Difficulties finding a counterparty are called search frictions. For example, it may be difficult to find someone to understand/purchase a complicated structured credit product. It may also be difficult to find buyers with sufficient capital to purchase multimillion dollar office towers in major metropolitan areas. No matter how high the transaction costs, it may take weeks, months, or years to transact in some situations. Asymmetric information can also be a type of search friction as investors search for non-predatory counterparties with which to transact.
Topic 4. Illiquid Asset Return Biases
-
There are reporting biases that result in inflated returns. Three main biases that impact returns of illiquid assets are:
-
Survivorship Bias: Only successful funds/assets are included in databases
-
Sample Selection Bias: Assets are reported/transacted when prices are high
-
Infrequent Trading Bias: Infrequent pricing leads to artificially smoothed returns.
-
-
Survivorship Bias: This bias results from only analyzing the performance of funds or assets that successfully operate throughout the analysis period.
-
Mechanism:
-
There are no requirements for certain types of funds (e.g., private equity, hedge funds, buyout funds, and so on) to report returns to database providers. Therefore, poorly performing funds stop reporting returns to database providers.
-
Failing funds are excluded from performance studies because they do not "survive" the entire period.
-
-
Impact: Non-surviving funds have below-average returns, but only the above-average returns of surviving funds are included.
-
Effect: Studies suggest reported mutual fund returns are 1%-2% lower than reported. For illiquid assets, returns may be as much as 4% lower than reported.
-
Solution: While the solution to survivorship bias seems obvious (to observe the entire universe of funds), it is impossible to do in illiquid asset markets.
-
-
Sample Selection Bias: This bias occurs when asset values and returns are reported only when they are high or transacted under favorable conditions.
-
The problem with selection bias is especially prevalent in private equity markets.
-
Distressed companies are often not liquidated and left as shell companies (or zombie companies). It is difficult to tell if a company is alive or whether it is a “zombie” company without any recent transactions.
-
Mechanism in Real Estate and Private Equity
-
Real Estate: Sellers often wait until property values recover before selling, leading to higher recorded sale prices used for return calculation.
-
Private Equity: Buyout funds take companies public (IPOs) and Venture Capitalists sell companies when stock prices/values are high.
-
-
Impact on Metrics:
-
Higher Reported Alpha: Only high prices are recorded.
-
Lower Reported Beta: There are fewer (only high) prices recorded, flattening the security market line (SML). The effect is smaller for real estate returns because volatility is lower than in private equity.
-
Lower Reported Variance: Only high returns are reported (i.e., underestimated risk)
-
- To summarize, sample selection bias results in overestimated expected returns and underestimated risk as measured by beta and the standard deviation of returns (i.e., volatility).
-
Topic 4. Illiquid Asset Return Biases
-
Infrequent Trading: Illiquid assets trade infrequently, causing betas, return volatilities, and correlations to be underestimated when computed using reported returns.
-
Infrequent trading smooths returns; quarterly returns appear less volatile than daily returns of the same asset, with computed standard deviations artificially lower.
-
Correlations with liquid asset classes (e.g., large-cap stocks) are artificially low because return volatility is muted by infrequent trading.
- Returns can be unsmoothed using filtering algorithms, which remove noise from signals. However, unsmoothing adds noise back to reported returns to uncover true, noisier returns.
- Unsmoothing dramatically affects estimates: 1990s real estate downturn showed –5.3% reported returns versus –22.6% unsmoothed; December 2008 NCREIF returns were –8.3% reported versus –36.3% unsmoothed.
- Standard deviation increased from 2.25% (raw) to 6.26% (unsmoothed) for NCREIF returns, approaching stock return volatility of 7.5% per quarter; correlations between S&P 500 and NCREIF increased from 9.2% to 15.8% when unsmoothed.
-
Topic 4. Illiquid Asset Return Biases
Practice Questions: Q3
Q3. Blue Sky Funds, a private equity fund, has suffered low returns for the last five years. As a result, the find has decided to quit reporting returns. The fund did report returns each year for the last 10 years when performance was strong. This problem of reporting leads to:
A. survivorship bias.
B. sample selection bias.
C. infrequent trading bias.
D. attrition bias.
Practice Questions: Q3 Answer
Explanation: A is correct.
There are no requirements for certain types of funds, like private equity funds, to report returns. As such, poorly performing funds have a tendency to stop reporting. Additionally, many poorly performing funds ultimately fail.
Performance studies generally include only those funds that were successful enough to survive over the entire period of analysis, leaving out the returns of funds that no longer exist. Both of these factors result in reported returns that are too high. This is called survivorship bias.
Module 2. Illiquidity Risk Premiums and Portfolio Allocation to Illiquid Assets
Topic 1. Relationship Between Returns and Illiquidity
Topic 2. Illiquidity Risk Premiums Across Asset Classes
Topic 3. Illiquidity Risk Premiums Within Asset Classes
Topic 4. Illiquidity Effects in US Treasury Markets and Corporate Bond Markets
Topic 5. Illiquidity Effects in Equity Markets
Topic 6. Secondary Markets for Private Equity and Hedge Funds
Topic 7. Harvesting Illiquidity Premiums
Topic 8. Portfolio Allocation to Illiquid Assets
Topic 9. Including Illiquid Asset In a Portfolio
Topic 1. Relationship Between Returns and Illiquidity
- We can relate liquidity to expected returns (1990-2009 data) as shown in Fig 84.1
- However, we cannot completely classify asset classes based on illiquidity (e.g., some private equity funds are more liquid than some hedge funds or infrastructure investments).
-
The below fig shows a positive relationship between the illiquidity of an asset class and its expected return.
- VC is least liquid (expected return between 16%-17%)
- Cash is most liquid (expected return over 4%)
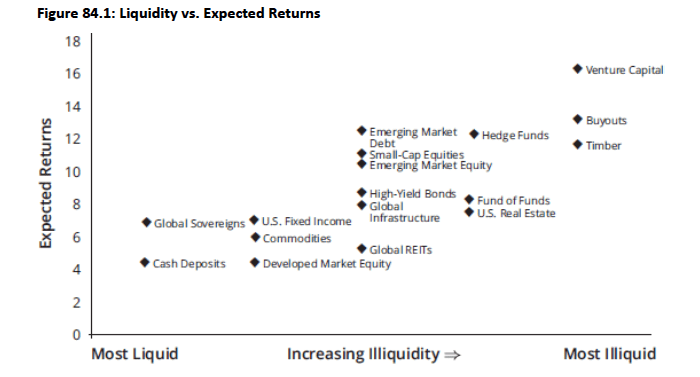
-
Generally, it is believed that there is a premium for illiquidity. This may not always be true due to following reasons:
-
Illiquidity Biases: Reported returns of illiquid assets are too high (i.e., overstated if using raw, unsmoothed data) and risk and correlation estimates are too low.
-
Risks in Illiquid Asset Classes: Illiquid asset classes such as private equity, buyout funds, and physical assets like timber contain significant risks beyond liquidity risk. Illiquid asset classes are much less attractive after adjusting for these risks.
-
Absence of Market Index: Private equity, hedge fund, and real estate indices are not investable, so no investor is actually earning the index return. For example, the NCREIF includes thousands of properties. Because individuals do not typically own thousands of properties, they are much more subject to idiosyncratic risks and are less diversified within the asset class.
-
Dependency on Manager Skills: There is no way, as there is with tradeable, cheap bond and equity index funds, to separate factor risk (i.e., systematic risk) from the talents of fund managers. As an investor cannot earn index returns in illiquid asset class markets, he has no way of separating passive returns from alpha generated by active managers.
-
- These factors imply that it may not be possible to generate substantial illiquidity risk premiums across illiquid asset classes. However, there is evidence of large illiquidity risk premiums within asset classes.
Topic 2. Illiquidity Risk Premiums Across Asset Classes
- Less liquid assets generally generate higher returns than more liquid assets within the same asset class.
- No formal theory currently explains why illiquidity risk premiums exist within asset classes but not between different asset classes.
- Potential explanations include investors overpaying for illiquid asset classes while chasing illusory higher returns, or firms managing portfolios in separate silos rather than as a cohesive whole.
- Mispricing across asset classes may result from slow-moving capital, limits to arbitrage, and institutional constraints (e.g., fixed-income desks not coordinating with equity traders).
Topic 3. Illiquidity Risk Premiums Within Asset Classes
-
Illiquidity Effects in U.S. Treasury Markets
-
On-the-run (i.e., newly issued) T-bills are more liquid and have lower yields than off-the-run (seasoned) T-bills. The difference is called the on-the-run/off-the-run bond spread.
-
During the 2007–2009 financial crisis, same maturity T-bonds and T-notes traded with different yields.While prices should have been the same, T-bond prices were more than 5% lower than T-note prices.
-
Given that the U.S. Treasury market is one of the largest and most liquid in the world, it is surprising to observe large illiquidity effects.
-
-
Illiquidity Effects in Corporate Bond Markets
-
Larger bid-ask spreads and infrequent trading led to higher yields in corporate bond markets.
-
Studies indicate that illiquidity risk explains 7% of the variation in investment grade bond yields and 22% of the variation in junk bond yields.
-
Also, as bid-ask spreads increase, yield spreads increase by more than double the amount.
-
Topic 4. Illiquidity Effects in US Treasury Markets and Corporate Bond Markets
-
Less liquid stocks earn higher returns than more liquid stocks. Illiquidity factors that impact equity returns are
-
Bid-ask spreads.
-
Volume and turnover
-
Volume measured by whether the trade was initiated by buyers or sellers.
-
Ratio of absolute returns to dollar volume, called the “Amihud measure.”
-
Price impact of large trades.
-
Informed trading measures (i.e., adverse selection).
-
Quote size and quote depth
-
Frequency of trades.
-
Number of “zero” returns (in liquid markets returns are usually not zero).
-
Return autocorrelations (which are a measure of stale prices)
-
-
All of these factors are unique to each stock. There are also illiquidity risk betas that are covariances of stock returns with illiquidity factors.
Researchers estimate illiquidity risk premiums ranging from 1% to 8%, depending on the measurement approach used. - Risk premiums have declined over time; recent studies find a 1% risk premium for listed equities compared to 20% for OTC stocks.
Topic 5. Illiquidity Effects in Equity Markets
Practice Questions: Q1
Q1. Which of the following variables is not an illiquidity factor that affects equity returns?
A. Measures of adverse selection.
B. The number of recorded positive returns.
C. Turnover.
D. Volume.
Practice Questions: Q1 Answer
Explanation: B is correct.
There are several variables related to illiquidity that are shown to impact equity returns. They are bid-ask spreads, volume, turnover, volume measured by whether the trade was initiated by buyers or sellers, the ratio of absolute returns to dollar volume, the price impact of large trades, informed trading measures (i.e., adverse selection), quote size and depth, the frequency of trades, the number of zero returns, and return autocorrelations. It is not the number of recorded positive returns, but the number of recorded zero returns, that are relevant.
-
Nature of Secondary Markets: Private equity funds trade companies with each other and provide needed liquidity. This does allow funds to get out of specific deals but does not allow limited partners to get out of the private equity fund itself. LPs can exit private equity funds in secondary markets. However, they are often characterized as immature, small, and opaque, lacking the transparency and volume of public markets.
- Significant Discounts for Sellers: Buyers in secondary markets frequently take advantage of sellers who need to exit their positions quickly. Such firms were often referred to as "vultures" in 1990s as they purchased the distressed positions at discounts of high as 30%-50%. Discounts fell below 20% in the early 2000s, but shot up again during the 2007–2009 financial crisis.
- Hedge Funds vs. Private Equity: The discounts for hedge fund secondary market transactions are typically much smaller (e.g., 6% to 8% during the 2007-2009 crisis) compared to private equity. This is because hedge funds generally offer more frequent redemption opportunities, reducing the urgency for a secondary market sale. Large asset owners like sovereign funds and pension funds can supply liquidity in hedge fund and private equity markets, buying stakes at reduced prices and harvesting illiquidity risk premiums.
Topic 6. Secondary Markets for Private Equity and Hedge Funds
-
Ways to Harvest Illiquidity Premiums:
-
Passive Allocation: Allocate a portion of the portfolio to illiquid asset classes such as real estate.
-
Liquidity Security Selection: Select more illiquid assets within an asset class, such as choosing off-the-run U.S. Treasury bills over more liquid on-the-run issues to capture the liquidity spread.
-
Acting as a Market Maker: Large investors, like sovereign wealth funds, can act as liquidity providers. They buy from distressed sellers at a discount and sell to buyers at a premium when the market recovers.
-
Dynamic Factor Strategies: Taking long positions in illiquid assets and short positions in liquid assets, and then actively rebalancing to take advantage of changes in liquidity. The rebalancing process is itself considered a way to provide liquidity and earn a premium. This strategy is the easiest to implement and can have the greatest effect on portfolio returns.
-
Topic 7. Harvesting Illiquid Premiums
Practice Questions: Q2
Q2. Rick Faircloth, a general partner and portfolio manager with Faircloth Funds, is considering ways in which his company can profit from illiquidity risk premiums. He has studied several alternative methods for harvesting illiquidity risk premiums. Which of the following strategies might Faircloth implement that will likely have the greatest effect on portfolio returns?
A. Acting as a market maker for individual securities.
B. Choosing the most illiquid assets within an asset class, even if the asset class is generally considered to be liquid.
C. Allocating a portion of a portfolio to illiquid asset classes.
D. Using dynamic factor strategies at the aggregate portfolio level.
Practice Questions: Q2 Answer
Explanation: D is correct.
There are four primary ways that investors can harvest illiquidity premiums:
- Allocating a portion of the portfolio to illiquid asset classes like real estate (i.e., passive allocation to illiquid asset classes).
- Choosing more illiquid assets within an asset class (i.e., liquidity security selection).
- Acting as a market maker for individual securities.
- Engaging in dynamic factor strategies at the aggregate portfolio level. This means taking long positions in illiquid assets and short positions in liquid assets to harvest the illiquidity risk premium. Of the four ways investors can harvest illiquidity risk premiums, this is the easiest to implement and can have the greatest effect on portfolio returns.
Topic 8. Portfolio Allocation to Illiquid Assets
-
Key Considerations for Allocation: The decision to include illiquid assets must consider below factors:
-
Investment horizon
- Lack of tradeable indices
- Need to hire talented active portfolio managers, and need to monitor these managers
-
-
Asset allocations in portfolios with illiquid assets must account for two critical illiquidity factors affecting investors:
-
Large transaction costs.
-
Infrequent trading (i.e., long time horizons between trades).
-
-
Asset Allocation to Illiquid Asset Classes with Transaction Costs:
- Traditional asset allocation models with transaction costs incorrectly assume assets will always trade if counterparties pay the cost, which doesn't hold for private equity, infrastructure, real estate, and timber markets.
- Finding buyers in short timeframes is often not possible; identified counterparties must perform time-consuming due diligence.
- Counterparties may choose not to purchase assets even after completing due diligence, creating further uncertainty.
- During stress periods, even liquid asset classes experience liquidity freezes where finding buyers at any price becomes impossible.
Topic 8. Portfolio Allocation to Illiquid Assets
-
Asset Allocation to Illiquid Asset Classes with Infrequent Trading: Illiquidity has a major effect on investors’ portfolio choices. Illiquidity causes the following with respect to portfolio choice:
-
Reduces Optimal Holdings: The less frequently liquidity events are expected, the lower the allocation to illiquid asset classes.
-
Rebalancing Challenges: Infrequent trading causes allocations to vary significantly from optimal levels as investors must wait for liquidity events. Allocations during non-rebalancing periods can range from too high to too low relative to optimal targets.
-
Hedging Limitations: Investors cannot hedge against declining values when assets cannot be traded. Illiquid asset investors must consume less than liquid asset investors to offset this unhedgeable risk.
-
No Arbitrage Opportunities: Illiquidity "arbitrages" cannot exist because arbitrage construction requires continuous trading, which illiquid assets lack.
-
Illiquidity Risk Premium Required: Infrequent trading necessitates an illiquidity risk premium; more frequent trading results in lower premiums. For example, private equity investments generate returns approximately 6% higher than public markets to compensate for illiquidity.
-
Topic 9. Including Illiquid Asset In a Portfolio
-
The following points should be considered while including illiquid assets in a portfolio:
-
Studies show that illiquid assets do not deliver higher risk-adjusted returns.
-
Investors are subject to agency problems because one must rely on the talents and skills of the manager. It is difficult to monitor external managers (e.g., private equity managers).
-
In many firms, illiquid assets are managed separately from the rest of the portfolio.
-
Illiquid asset investors face high idiosyncratic risks. There is no “market” portfolio of illiquid assets.
-
-
Illiquid assets are compelling because:
-
Illiquid asset markets are less efficient than stock and bond markets.
-
There are large information asymmetries in illiquid asset markets.
-
High transaction costs keep many investors out of the market.
-
Management skill is crucial and alpha opportunities are widely dispersed.
-
-
There are great opportunities for the skilled investor to profit from investments in illiquid assets. On the other hand, Unskilled investors can lose big in illiquid asset markets.
Copy of IM 17. Illiquid Assets
By Prateek Yadav


