Book 1. Foundations of Risk Management
FRM Part 1
FRM 5. Modern Portfolio Theory and the Capital Asset Pricing Model
Presented by: Sudhanshu
Module 1. Modern Portfolio Theory and the Capital Market Line
Module 2. Deriving and applying The Capital Asset Pricing Model
Module 3. Performance Evaluation Measures
Module 1. Modern Portfolio Theory and the Capital Market Line

Topic 1. Modern Portfolio Theory and Its Assumptions
Topic 2. Effects of Correlation on Portfolio Risk
Topic 3. Idiosyncratic vs. Market Risk
Topic 4. The Efficient Frontier
Topic 5. The Capital Market Line (CML)
Topic 1. Modern Portfolio Theory and Its Assumptions
-
Modern Portfolio Theory (MPT)
- Developed by Harry Markowitz in the early 1950s, MPT lays the foundation for understanding market risk.
- It focuses on maximizing portfolio return per unit of risk.
-
Assumptions of Markowitz's Portfolio Theory
- Returns are normally distributed: Investors consider only the mean and variance of return distributions, ignoring skewness or kurtosis.
- Investors are rational and risk-averse: Rational investors aim to maximize utility from investments. When faced with two investment opportunities with the same expected risk, they choose the one offering the highest expected return.
- Capital markets are perfect: This implies no taxes, commissions, or transaction costs. Investors have unrestricted access to all information, and perfect competition exists among market participants.
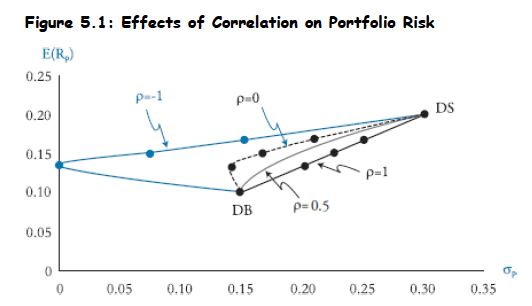
Topic 2. Effects of Correlation on Portfolio Risk
- Minimizing Portfolio Risk by Diversificaiton: Risk-averse investors strive to minimize portfolio risk for a given target return by investing in multiple non-correlated assets.
-
Impact of Correlation:
- While portfolio returns are weighted averages of individual asset returns, portfolio variances depend on the correlations among assets.
- Correlation of +1: Offers no diversification benefits, and portfolio variance is a weighted average of individual variances.
- Correlation less than 1: Diversification occurs, and portfolio variance declines below the weighted average of individual variances. The lower the correlation, the greater the benefit.
- Perfect Negative Correlation: It is possible to create a portfolio with zero variance, essentially a synthetic risk-free asset.
Topic 3. Idiosyncratic vs. Market Risk
-
Idiosyncratic Risk:
- This is company-specific risk.
- A sufficiently diversified portfolio can reduce or eliminate idiosyncratic risk (e.g., accounting fraud, cyber attacks).
-
Market Risk
- This is the risk due to investment in market portfolio
- A well-diversified portfolio primarily becomes exposed to general market risk.
- Investors are compensated only for exposure to market risk, as company-specific risk is diversifiable.
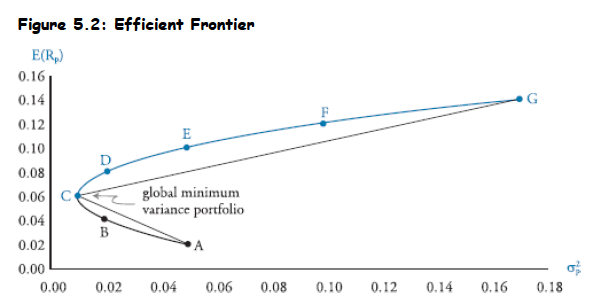
Topic 4. The Efficient Frontier
- Definition: Rational investors maximize portfolio return per unit of risk. Plotting all those maximum returns for various risk levels produces the efficient frontier, which is represented by the blue curve passing through C-D-E-F-G.
- Global Minimum Variance Portfolio: Point C on the efficient frontier represents the global minimum variance portfolio, which offers the smallest amount of total risk and is the leftmost point of the efficient frontier.
-
Inefficient and Unattainable Portfolios: Portfolio Possibilities Curve (e.g., points A and B): An extension of the efficient frontier below the global minimum variance portfolio. These portfolios are inefficient because portfolios on the efficient frontier offer higher returns for the same risk.
- Any portfolio below the efficient frontier is inefficient.
- Any portfolio above the efficient frontier is unattainable.
- Investor Choice: In the absence of a risk-free asset, efficient portfolios lie only on the efficient frontier. Investors choose their position on this frontier based on their risk aversion.
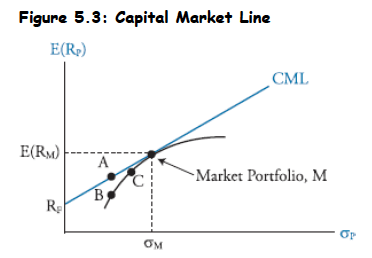
Topic 5. The Capital Market Line (CML)
- Introduction to Risk-Free Asset: The CML extends the concept of efficient portfolios by introducing a risk-free asset (e.g., U.S. Treasury bill).
- Investor Behavior: Investors combine the risk-free asset with a specific efficient portfolio to maximize their risk-adjusted rate of return.
- Homogeneous Expectations: Assuming identical expectations among investors regarding returns, variances, and correlations, there will be only one tangency line, known as the Capital Market Line (CML).
- Market Portfolio (M): The single tangency portfolio on the CML, representing all risky asset classes in the world. The S&P 500 is often used as a proxy.
-
Investor Holdings: All investors hold a combination of the risk-free asset and the market portfolio, depending on their desired risk and return.
- Lending: Investing in the risk-free asset (e.g., Treasuries) corresponds to points left of M on the CML.
- Borrowing: Using leverage to magnify investment in the market portfolio corresponds to points right of M on the CML.
- Equation of the CML:
- The slope of the CML is equal to the Sharpe measure.
E(R_P)=R_F+[\frac{E(R_M)-R_F}{\sigma_M}]\sigma_P
Practice Questions: Q1
Q1. At a recent analyst meeting at Invest Forum, analysts Michelle White and Ted Jones discussed the use of the capital market line (CML). White states that the CML assumes that investors hold two portfolios:
- a risky portfolio of all assets weighted according to their relative market value capitalizations; and
- the risk- free asset. Jones states that the CML is useful in determining the required rate of return for individual securities.
Are White and Jones’s statements correct?
A. Only Jones’s statement is correct.
B. Only White’s statement is correct.
C. Both statements are correct.
D. Neither statement is correct.
Practice Questions: Q1 Answer
Explanation: B is correct.
The capital market line (CML) assumes all investors have identical expectations and all use mean-variance analysis, implying that they all identify the same risky tangency portfolio (the market portfolio) and combine that risky portfolio with the risk-free asset when creating their portfolios. Because all investors hold the same risky portfolio, the weight on each asset must be equal to the proportion of
its market value to the market value of the entire portfolio. Therefore, White is correct.
The CML is useful for determining the rate of return for efficient portfolios, but it cannot be used to determine the required rate of return for inefficient portfolios or individual securities. The capital asset pricing model (CAPM) is used to determine the required rate of return for ineficient portfolios and individual securities. Therefore, Jones is incorrect.
Practice Questions: Q2
Q2. In the below mean-variance analysis, a risk analyst has combined the risk-free asset (T-bills) with Portfolio P. Portfolio P is least likely to:
A. be efficient.
B. have beta of 1.
C. be the global minimum variance portfolio.
D. represent a 100% investment in the market portfolio.
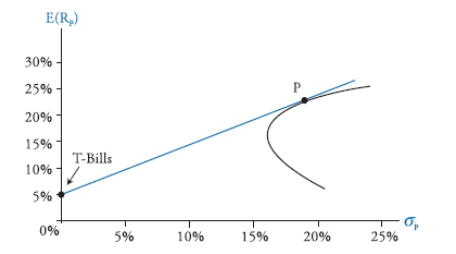
Practice Questions: Q2 Answer
Explanation: D is correct.
The line connecting the risk-free rate with the tangency (market) portfolio is the CML. The market portfolio has a beta of 1, by deinition, and lies on the eficient frontier. The global minimum variance portfolio lies on the eficient frontier, but not on the CML.
Module 2. Deriving and applying the Capital Asset Pricing Model
Topic 1. The Capital Asset Pricing Model (CAPM)
Topic 2. Interpreting Systematic Risk
Topic 3. Estimating Systematic Risk
Topic 4. Deriving the CAPM: SML
Topic 1. The Capital Asset Pricing Model (CAPM)
- Development: Developed by William Sharpe and John Lintner in the 1960s, CAPM builds upon Modern Portfolio Theory and the CML.
-
Key Assumptions Underlying CAPM:
- Freely available information: All market participants have access to the same information.
- Frictionless markets: No taxes, commissions, or transaction costs exist.
- Fractional investments are possible: Assets are infinitely divisible, allowing for very small or large positions.
- Perfect competition: Individual investors cannot influence market prices.
- Investors make their decisions solely based on expected returns and variances.
- Unlimited borrowing and lending at the risk-free rate: Market participants can borrow and lend any amount at the risk-free rate.
- Homogenous expectations: Investors share the same forecasts for expected returns, variances, and covariances over a single period.
Practice Questions: Q3
Q3. Which of the following statements is most likely an assumption of the capital asset pricing model (CAPM)?
A. Investors only face capital gains taxes.
B. Investors’ actions affect the prices of assets.
C. Transaction costs are constant across all assets.
D. Market participants can lend and borrow unlimited amounts at the risk-free rate.
Practice Questions: Q3 Answer
Explanation: D is correct.
The CAPM assumes unlimited borrowing and lending at the risk-free rate. Additionally, CAPM assumes no taxes, no transaction costs, and that investor actions do not affect market prices.
Topic 2. Interpreting Systematic Risk (Beta)
-
Systematic Risk (Beta):
- The expected returns of risky assets depend only on their relative contributions to the market risk of the portfolio.
- Systematic risk represents the sensitivity of asset returns to the market return and is quantified by the asset's beta (β).
- Beta Calculation:
-
Interpreting Beta:
- Market Beta (β = 1): The market portfolio itself has a beta of 1, meaning it moves in a one-to-one relationship with itself.
- Cyclical Stocks (β > 1): Securities with beta greater than 1 move by a greater amount than the market, indicating higher market risk (e.g., luxury goods stocks). They perform better during economic expansions.
- Defensive Stocks (β < 1): Securities with beta below 1 move by a smaller amount than the market (e.g., utility stocks). They fare better during recessions.
\beta_i=\frac{\text{covariance of Asseti′s return with the market return}}{\text{variance of the market return}}=\frac{Cov_{i,M}}{\sigma^2_M}=\rho_{i,M} \times \frac{\sigma_i}{\sigma_M}
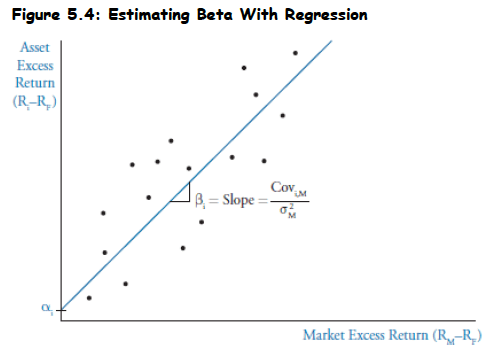
Topic 3. Estimating Systematic Risk (Beta)
- Beta Estimation: Calculated by regressing asset returns against market returns using mathematical line-fitting procedure
- Regression Setup: Asset i excess returns (dependent variable) vs. market index excess returns (independent variable)
- Least Squares Method: Regression line minimizes sum of squared differences between data points and the line (best fit)
- Beta Value: Slope of the regression line provides our estimate of beta
- Visual Representation: The figure below illustrates this relationship with excess returns plotted against each other
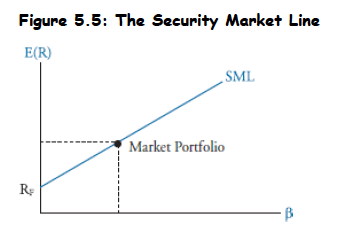
Topic 4. Deriving the CAPM: Security Market Line (SML)
- Derivation of CAPM: Expected return depends solely on beta (company-specific risk is diversified away) and is a linear function of beta.
- Security Market Line (SML): The graphical representation of the CAPM equation, showing expected return as a linear function of beta. Equation of SML:
-
Components of the SML:
- Y-intercept (RF): When beta is 0 (no systematic risk), the expected return is the risk-free rate, as the risk-free asset has zero market risk and a guaranteed return.
- Coordinates for Risk-Free Asset:
- Coordinates for Market Portfolio: , because the market portfolio's beta is 1.
- Slope (Market Risk Premium, MRP): Calculated as the rise over run of the SML, which is
- CAPM equation: Based on above, we derive CAPM equation:
E(R_P)=\alpha+m \times \beta_P
(0,R_F).
(1, R_M)
(R_M-R_F).
\mathrm{E}\left(\mathrm{R}_{\mathrm{i}}\right)=\mathrm{R}_F+\left[\mathrm{E}\left(\mathrm{R}_{\mathrm{M}}\right)-\mathrm{R}_{\mathrm{F}}\right] \beta_{\mathrm{i}}.
Topic 5. Overvalued and Undervalued Securities
- An overvalued security would have a required rate of return (computed by CAPM) that is higher than its expected return (computed by the analyst’s valuation). An overvalued security would plot below the SML.
- An undervalued security would have a required rate of return (computed by CAPM) that is lower than its expected return (computed by the analyst’s valuation). An undervalued security would plot above the SML.
Practice Questions: Q4
Q4. Patricia Franklin makes buy and sell stock recommendations using the capital asset pricing model (CAPM). Franklin has derived the following information for the broad market and for the stock of the CostSave Company (CS):
Franklin believes that historical betas do not provide good forecasts of future beta, so therefore uses the following formula to forecast beta:
forecasted beta = 0.80 + 0.20 × historical beta
After conducting a thorough examination of market trends and the CS financial statements, Franklin predicts that the CS return will equal 10%. Franklin should derive which of the following CS required returns for CS and valuation decisions (undervalued or overvalued)?
\begin{array}{|l|l|} \hline \text{Expected market risk premium}& 8\% \\ \hline \text{Risk-free rate} & 5\% \\ \hline \text{Historical beta for CS} & 1.50 \\ \hline \end{array}
\begin{array}{ccc} & \text{Valuation} & \text{CAPM required return}\\ A. & \text{Overvalued} & 8.3 \% \\ B. & \text{Overvalued} & 13.8 \% \\ C. & \text{Undervalue} & 8.3 \% \\ D. & \text{Undervalued} & 13.8\%\end{array}
Practice Questions: Q4 Answer
Explanation: B is correct.
The CAPM equation is:
Franklin forecasts the beta for CostSave as follows:
The CAPM required return for CostSave is then: 0.05 + 1.1(0.08) = 13.8%.
Note that the market premium, , is provided in the question (8%).
Franklin should decide that the stock is overvalued because she forecasts that the CostSave return will equal only 10%, whereas the required return (minimum acceptable return) is 13.8%.
E(R_i)=R_F+\beta_i[E(R_M-R_F)]
\begin{aligned}
& \text { beta forecast }=0.80+0.20(\text { historical beta }) \\
& \text { beta forecast }=0.80+0.20(1.50)=1.1
\end{aligned}
E(R_M)-R_F
Practice Questions: Q5
Q5. Albert Dreiden wants to estimate the expected return on the market. He believes that the stock of the Hobart Materials Company is fairly valued, and gathers the following information:
Based on this information, the estimated expected return for the market portfolio is closest to:
A. 3.00%.
B. 3.75%.
C. 6.90%.
D. 8.25%.
\begin{array}{|l|l|} \hline \text{Expected return for Hobart} & 7.50\% \\ \hline \text{Risk-free rate} & 4.50\% \\ \hline \text{Beta for Hobart} & 0.80 \\ \hline \end{array}
Practice Questions: Q5 Answer
Explanation: D is correct.
The capital asset pricing model (CAPM) equation is:
Using the given information, we can solve for the expected return for the market portfolio as follows:
Based on the information given and using the CAPM, the expected return on the market is 8.25%.
E(R_i)=R_F+\beta_i[E(R_M-R_F)]
\begin{aligned}
& 7.50 \%=4.50 \%+0.80\left[\mathrm{E}\left(\mathrm{R}_{\mathrm{M}}\right)-4.50 \%\right] \\
& \mathrm{E}\left(\mathrm{R}_{\mathrm{M}}\right)=[(7.50 \%-4.50 \%) / 0.80]+4.50 \%=8.25 \%
\end{aligned}
Module 3. Perfomance Evaluation Measures
Topic 1. Portfolio Performance Measures
Topic 2. Sharpe Performance Index (SPI)
Topic 3. Treynor Performance Index (TPI)
Topic 4. Jensen’s Performance Index (JPI, or Jensen's alpha)
Topic 5. Tracking Error
Topic 6. Information Ratio (IR)
Topic 7. Sortino Ratio (Sortino)
Topic 1. Portfolio Performance Measures
- Importance: Portfolio managers must analyze risk-adjusted rates of return to evaluate the true performance of their portfolios, not just raw returns.
-
Traditional Performance Measures:
- Sharpe Performance Index (SPI)
- Treynor Performance Index (TPI)
- Jensen's Performance Index (JPI)
- General Rule: For a given portfolio, a higher measure in all three cases indicates better risk-adjusted return.
- Similarity: Sharpe and Treynor measures normalize the risk premium by dividing by a measure of risk.
Topic 2. Sharpe Performance Index (SPI)
-
Definition: The Sharpe measure calculates excess return (portfolio return minus the risk-free rate) per unit of total risk (measured by standard deviation). The formula to calculate SPI is:
-
- Applicability: Investors can apply the Sharpe measure to all portfolios because it uses total risk, making it widely used.
- CML Connection: The slope of the CML is the Sharpe measure of the market.
- Interpretation: A portfolio with a Sharpe measure greater than the market's Sharpe measure offers superior risk-adjusted returns compared to the market.
S P I=\left[\frac{E\left(R_P\right)-R_F}{\sigma_P}\right]
Practice Questions: Q6
Q6. For a given portfolio, having a Treynor measure greater than the market but a Sharpe measure that is less than the market would most likely indicate the portfolio is:
A. not well-diversified.
B. generating a negative alpha.
C. borrowing at the risk-free rate.
D. not borrowing at the risk-free rate.
Practice Questions: Q6 Answer
Explanation: A is correct.
Low diversification can produce a Treynor measure greater than the Sharpe measure because it will likely increase the standard deviation of the portfolio’s returns, thus decreasing the Sharpe measure. Using margin is not directly related to the risk-adjusted performance, because adjusting for risk removes the effect of leverage. A Treynor measure greater than the market Treynor would result in a positive alpha (not a negative alpha).
Practice Questions: Q7
Q7. With respect to performance measures, the use of the standard deviation of portfolio returns is a distinguishing feature of the:
A. beta measure.
B. Jensen’s alpha.
C. Sharpe measure.
D. Treynor measure.
Practice Questions: Q7 Answer
Explanation: C is correct.
The Sharpe measure is the portfolio return minus the risk-free rate divided by the standard deviation of the return. The Treynor and Jensen measures use beta as the measure of risk. The answer beta measure is a nonsensical choice for this question.
Topic 3. Treynor Performance Index (TPI)
-
Similarity to Sharpe: Shares the same numerator as the Sharpe measure (portfolio excess return). The formula to calculate TPI is:
-
- Difference from Sharpe: Uses systematic risk (beta) as the denominator, unlike Sharpe which uses total risk (standard deviation).
- Relevance: Beta and TPI are more relevant for well-diversified portfolios, as such portfolios are primarily exposed to market risk (idiosyncratic risk is diversified away).
- Poorly-Diversified Portfolios: For portfolios with few assets, standard deviation might be unnecessarily high due to excessive company-specific risk.
-
SML Connection: The slope of the SML (Market Risk Premium, MRP) can also be viewed as the Treynor measure of the market.
-
T P I=\left[\frac{E\left(R_P\right)-R_F}{\beta_P}\right]
\operatorname{TPI}_M=\left[\frac{E\left(R_M\right)-R_F}{\beta_M}\right]=\left[\frac{E\left(R_M\right)-R_F}{1}\right]=M R P
Topic 4. Jensen’s Performance Index (JPI, or Jensen's Alpha)
-
Assumptions: Similar to Treynor, Jensen's performance index assumes investors are well-diversified and thus uses beta as the relevant risk metric instead of standard deviation. The formula to calculate JPI is:
-
- Comparison: It compares the portfolio's expected return to the CAPM required return.
- Jensen's Alpha : The difference between the portfolio expected return and the CAPM required return.
-
Interpretation:
- Zero Alpha: In equilibrium (no mispricing), expected return equals CAPM required return, resulting in zero alpha.
- Positive Alpha: Implies the portfolio is undervalued, suggesting it's a good investment.
- Suitability: Most suitable for comparing portfolios with the same level of systematic risk.
- Relationship with Treynor: Superior performance implied by the Treynor measure generally implies superior performance according to Jensen's alpha, though relative rankings might differ.
J P I=\alpha_P=E\left(R_P\right)-\left\{R_F+\left[E\left(R_M\right)-R_F\right] \beta_P\right\}
(\alpha_P)
Practice Questions: Q8
Q8. For a given portfolio, the expected return is 9% with a standard deviation of 16%. The beta of the portfolio is 0.8. The expected return of the market is 12% with a standard deviation of 20%. The risk-free rate is 3%. The portfolio’s alpha is:
A. −1.2%.
B. −0.6%.
C. +0.6%.
D. +1.2%.
Practice Questions: Q8 Answer
Explanation: A is correct.
The alpha is:
9\%-[3\%+0.8 \times (12\%-3\%)]=-1.2\%.
Topic 5. Tracking Error
-
Definition: When a manager aims to earn a return higher than a benchmark portfolio (e.g., market portfolio), the difference between the portfolio return and the benchmark return will have variability over time. The formula to calculate tracking error is:
-
- Measurement: Tracking error is the standard deviation of this difference.
- Risk Assessment: It is considered another source of risk in assessing a manager's success, even if they generate a positive alpha that varies over time.
- Alternative Definition (less common): Some practitioners refer to tracking error simply as the difference between portfolio returns and benchmark returns:
\text { tracking error }=\sqrt{\frac{\sum\left(\mathrm{R}_{\mathrm{P}}-\mathrm{R}_{\mathrm{B}}\right)^2}{\mathrm{n}-1}}
\left(\mathrm{R}_{\mathrm{P}}-\mathrm{R}_{\mathrm{B}}\right).
Topic 6. Information Ratio (IR)
-
Definition: The Information Ratio (IR) divides the portfolio's expected return in excess of the benchmark's expected return by the tracking error. The formula to calculate information ratio is:
-
-
Components:
- Numerator: Often referred to as "active return"
- Denominator: Often referred to as "active risk," which is the standard deviation of the difference between the portfolio return and the benchmark return (tracking error).
(E(R_P)-E(R_B)).
\mathrm{IR}=\frac{\mathrm{E}\left(\mathrm{R}_{\mathrm{P}}-\mathrm{R}_{\mathrm{B}}\right)}{\text { tracking error }}=\frac{\text { active return }}{\text { active risk }}
Practice Questions: Q9
Q9. Advanced Quantitative Models global equity fund has averaged a return of 12.5% per year over the last 10 years. The benchmark average return over the same period was 11% per year. The risk-free rate of return during the same period averaged 3.5%. The standard deviation of the fund’s return is 16.15%, and the tracking error is
10.5%. What is the information ratio (IR) for the fund?
A. 0.14.
B. 0.95.
C. 1.05.
D. 1.19.
Practice Questions: Q9 Answer
Explanation: A is correct.
IR=(12.5-11)/10.5-0.14
Topic 7. Sortino Ratio (Sortino)
-
Similar to Sharpe Measure: The Sortino ratio is similar to the Sharpe measure but with two key modifications. The formula to calculate Sortino ratio is:
-
-
Key Changes:
- Minimum Acceptable Return ( ): The risk-free rate is replaced with a minimum acceptable return, which can be determined by investor needs or set equal to the risk-free rate.
- Downside Deviation: Standard deviation is replaced with downside deviation.
- Downside Deviation: This is a type of semi-standard deviation that measures the variability of only those returns that fall below the minimum acceptable return. Returns higher than are not considered risky for this calculation.
R_{MIN}
R_{MIN}
\text { Sortino }=\frac{\mathrm{R}_{\mathrm{P}}-\mathrm{R}_{\mathrm{MIN}}}{\text { downside deviation }}
Practice Questions: Q10
Q10. Given the following information:
What is the Sortino ratio of the portfolio?
A. 0.24.
B. 0.73.
C. 0.82.
D. 0.98.
\begin{array}{lr}
\text { Risk-free rate } & 4 \% \\
\text { Minimum acceptable return } & 6 \% \\
\text { Benchmark return } & 10 \% \\
\text { Expected return on portfolio } & 12 \% \\
\text { Expected return on market } & 9 \% \\
\text { Beta } & 1.25 \\
\text { Standard deviation (portfolio) } & 7.3 \% \\
\text { Downside deviation (portfolio) } & 8.2 \%
\end{array}
Practice Questions: Q10 Answer
Explanation: B is correct.
\begin{aligned}
\text { Sortino ratio }= & (\text { portfolio return }- \text { minimum acceptable } \\
& \text { return }) / \text { downside deviation } \\
= & (0.12-0.06) / 0.082=0.7317
\end{aligned}
Copy of FRM 5. Modern Portfolio Theory and the Capital Asset Pricing Model
By Prateek Yadav


