Book 2. Credit Risk
FRM Part 2
CR 8. Country Risk
Presented by: Sudhanshu
Module 1. Country Risk
Module 2. Sovereign Default Risk
Module 1. Introduction to Country Risk

Topic 1. Introduction to Country Risk
Topic 2. Economic Growth Life Cycle
Topic 3. Political Risk
Topic 4. Legal Risk
Topic 5. Economic Structure
Topic 6. Evaluating Country Risk
Topic 1. Introduction to Country Risk
-
Definition: The risk of investing in a particular country due to factors unique to that country.
-
Investors face rising country risk exposure, both directly and indirectly.
-
Financial market innovations have made foreign investing easier and more accessible.
-
Investment avenues include international mutual funds, ETFs, ADRs, and GDRs.
-
Firms are increasingly global in operations and revenue dependence.
-
Corporate growth and shareholder returns often rely on foreign markets.
-
Country risk differs across nations, driven largely by government policies and actions.
-
Government intervention directly affects investment risk and market attractiveness.
-
-
Key Sources of Risk:
-
Economic Growth Life Cycle
-
Political Risks
-
Legal Systems
-
Economic Structure (reliance on specific products/commodities)
-
Practice Questions: Q1
Q1. A portfolio manager for a hospital foundation is considering the inclusion of sovereign bonds in the fixed income portion of the foundation’s portfolio. Much to the surprise of his colleagues, the manager plans to purchase the bonds of a country that has long been under authoritarian rule. He cites “lower political risk” when asked about his investment decision. Which of the following statements is most likely what the manager meant by his assertion of lower risk?
A. Authoritarian regimes are more likely to control corruption in government agencies.
B. Government policies that may affect debt repayment are often more stable under an authoritarian regime.
C. Relative to a democracy, risks are greater on a day-to-day basis, but the effects are less detrimental overall.
D. In most authoritarian countries, property rights are protected and property disputes are settled quickly.
Practice Questions: Q1 Answer
Explanation: B is correct.
Some investors prefer the stability of investing in countries with autocratic governments because government policies are locked in and generally more predictable compared to democratic countries where an election can significantly change government policies. Risks in a democracy are continuous, but usually low. In contrast, risks in a dictatorship are discontinuous. Policies change much less frequently, but changes are often severe and difficult to protect against. The portfolio manager is willing to accept the bigger, discontinuous risk as a tradeoff for the more frequent, but less damaging, continuous risk.
Topic 2. Economic Growth Life Cycle
-
Market maturity matters: Mature markets and companies generally exhibit lower risk than firms and countries in early growth stages.
-
Fragility of young growth firms: Early-stage companies depend heavily on stable macroeconomic conditions and typically have fewer financial and operational buffers to absorb shocks.
-
Country-level vulnerability: Early growth and emerging market economies are more exposed to macroeconomic volatility than mature economies.
-
Asymmetric growth cycles: Early growth countries tend to show higher recovery growth rates but also suffer sharper GDP contractions during economic downturns.
-
Equity market sensitivity: Stock markets in early growth economies experience more severe drawdowns during crises.
-
Crisis evidence: During the 2008 financial crisis, U.S. and European equity markets declined by ~25–30%, while emerging markets fell by 50% or more.
-
Risk even with strong institutions: Higher risk persists in early growth markets despite sound legal frameworks and good governance.
Topic 3. Political Risk
-
Definition: Political risk captures uncertainty arising from a country’s political system and governance, ranging from democracy vs. dictatorship to how smoothly political power is transferred (elections vs. coups).
-
Four main components include Continuous Vs. discontinuous risk, corruption, physical violence, and national and expropriation risk.
-
Continuous vs. Discontinuous Risk:
-
A 2021 report by The Economist notes that only 6.4% of the global population lives in full democracies, while nearly one-third lives under authoritarian regimes.
-
Evidence on whether democracies or authoritarian systems generate higher growth is mixed.
-
Discontinuous risks are harder to hedge (e.g., sudden wars or sanctions wiping out foreign investment, as seen after Russia’s 2022 invasion of Ukraine).
-
Some investors value autocratic stability, but benefits are often offset by corruption, weak legal systems, and opaque decision-making.
-
Authoritarian regimes exhibit discontinuous risk: policies remain stable for long periods but can change abruptly and severely.
-
Democracies typically exhibit continuous, low-intensity risk, as policies evolve gradually through elections.
-
Topic 3. Political Risk
-
Corruption
-
In its 2021 index, Denmark, Finland, and New Zealand ranked least corrupt, while South Sudan, Somalia, and Syria ranked among the most corrupt.
-
Transparency International ranks countries using perception-based surveys.
-
Unlike explicit taxes, corruption introduces legal, reputational, and enforcement risk, especially under anti-bribery laws.
-
Corruption acts like an implicit tax, directly reducing firm profits and indirectly lowering investor returns.
-
-
Physical Violence:
-
Political instability and conflict raise economic costs (security, insurance, disrupted operations) and human costs (risk to employees and investors).
-
Institute for Economics and Peace publishes the Global Peace Index, measuring country-level peace and violence.
-
-
Nationalization and expropriation risk:
-
Governments may extract value through arbitrary taxation, forced ownership transfers, or outright nationalization.
-
Compensation, if any, is often well below fair value.
-
Risk is especially high in natural resource and strategic sectors, where state intervention is more common.
-
Topic 4. Legal Risk
-
The strength of property rights protection and the efficiency of the legal system directly influence legal and investment risk.
-
Delays in dispute resolution effectively weaken property rights, even if laws formally exist.
-
Weak enforcement increases uncertainty, raising required returns for investors and businesses.
-
Strong investor and business protection is a key determinant of a country’s legal risk profile.
-
Poor governance practices—such as insiders issuing shares to themselves at below-market prices—increase expropriation risk.
-
Investors price these risks by discounting share values in jurisdictions with weak protections.
-
International property rights indices show Australia and North America with the strongest protections.
-
Latin America and Africa rank lowest, reflecting higher legal and institutional risk.
Topic 5. Economic Structure
-
Heavy reliance on a single commodity or service increases a country’s overall risk exposure.
-
Examples include economies dependent primarily on oil production, banking/insurance, or tourism.
-
A decline in demand or prices of the dominant commodity/service can severely damage the economy.
-
The impact extends beyond the core sector, affecting all businesses and investors in the country or region.
-
Such concentration amplifies systemic and country risk, especially during global downturns.
-
Economic diversification is often difficult, particularly for smaller economies.
-
Concentration can create significant wealth for resource owners, reducing incentives to diversify.
-
The United Nations Conference on Trade and Development (UNCTAD) tracks commodity dependence in emerging markets.
-
Studies show Africa and Latin America are highly dependent on commodity exports.
-
High commodity dependence makes these economies especially sensitive to price volatility, increasing country risk.
Topic 6. Evaluating Country Risk
-
Methods for Measurement:
-
Political Risk Services (PRS): Evaluates 100+ countries on political, economic, and financial risk dimensions.
-
Euromoney: Surveys 400 economists to assess country risk factors and rank countries from 0 to 100.
-
The Economist: Assesses currency risk, sovereign debt risk and banking risks.
-
The World Bank: Compiles measures on corruption, government effectiveness, political stability, rule of law, voice and accountability, and regulatory quality .
-
-
Limitations of These Methods:
-
Methodologies may be more relevant to economists than investors.
-
No standardization across providers (different scales and scoring).
-
Scores are better for rankings than for absolute comparison (e.g., a score of 70 is not twice as risky as a score of 35).
-
Practice Questions: Q2
Q2. In an attempt to understand country risk, an analyst at Global Funds examines multiple sources of information to determine the truest measure of risk. She considers sovereign risk ratings, default risk spreads, and composite measures of risk. Which of the following sources relies on surveys of several hundred economists to measure sovereign risk?
A. Political Risk Services.
B. The Economist.
C. The World Bank.
D. Euromoney.
Practice Questions: Q2 Answer
Explanation: D is correct.
Numerous services attempt to evaluate country risk in its entirety. They include Political Risk Services (PRS), The Economist, Euromoney, and the World Bank. Euromoney surveys 400 economists who assess country risk factors and rank countries from 0 to 100, with higher numbers indicating lower risk.
Module 2. Sovereign Default Risk
Topic 1. Sovereign Default Risk
Topic 2. Foreign Currency Defaults
Topic 3. Local Currency Defaults
Topic 4. Consequences of Sovereign Default
Topic 5. Sovereign Default Risk Factors
Topic 6. Rating Agencies and Default Risk
Topic 7. How Rating Agencies Measure Risk
Topic 8. Sovereign Ratings Vs Default Risk
Topic 9. Shortcomings of the Sovereign Rating System
Topic 10. Credit Ratings and Sovereign Default Spreads
Topic 11. Advantages of Sovereign Default Spreads
Topic 12. Disadvantages of Sovereign Default Spreads
Topic 13. Credit Default Spreads (CDS)
Topic 1. Sovereign Default Risk
-
Definition: The risk that a government will fail to make full and timely interest and principal payments on its debt.
-
Categories:
-
Foreign Currency Defaults
-
Local Currency Defaults
-
-
Sovereign default risk is often used as a proxy for a country's overall risk.
Topic 2. Foreign Currency Defaults
-
Governments often borrow in foreign currencies from other countries or foreign banks; this is known as foreign currency debt.
-
Sovereign defaults frequently occur on foreign currency debt because countries cannot print foreign currency to meet repayment obligations.
-
A significant share of historical sovereign defaults are foreign currency defaults.
-
Between 1983 and 2021, there were 30+ foreign currency sovereign defaults.
-
The largest sovereign default in this period was Greece (2012), involving over $264 Bn.
-
Over the past 200 years, sovereign defaults have clustered into seven major periods:
-
1824–1834
-
1867–1882
-
1890–1900
-
1911–1921
-
1931–1940
-
1976–1989
-
1998–2003
-
- In Europe, the highest number of defaults occurred during 1931–1940. This period also saw multiple foreign currency defaults in Latin America.
-
The early 1980s marked another major wave of defaults in Latin America, with 16 countries defaulting, 15 between 1980 and 1983.
-
Asia and Africa have also experienced sovereign defaults over the last 50 years.
Topic 2. Foreign Currency Defaults
-
Key conclusions from historical studies:
-
Countries are more likely to default on bank loans than on sovereign bond issues.
-
Latin America accounts for a large share of sovereign defaults over the last 50 years, measured by dollar value.
-
-
In four of the last five decades (excluding the 1990s), Latin America accounted for at least 60% of global foreign-currency sovereign defaults.
-
For nearly 200 years, Latin America has remained the epicenter of sovereign default risk.
-
During the 19th century, the region attracted capital from France, Britain, and Spain due to abundant natural resources.
-
Limited domestic savings forced Latin American countries to rely heavily on gold-denominated and foreign-currency borrowing.
-
Sovereign debt issued in this period had long maturities, typically exceeding 20 years.
-
Military coups and armed conflicts were the dominant triggers behind early sovereign defaults.
-
Between 1820 and 1919, 58 out of 77 sovereign defaults worldwide occurred in Latin America.
-
From 1825 to 1940, Latin American countries collectively spent 38% of the time in default.
-
Uruguay had the lowest default frequency at 12% of the period, while Honduras experienced defaults for 79% of the time.
Practice Questions: Q1
Q1. Which of the following statements regarding foreign currency defaults is true?
A. African countries are responsible for the greatest number of defaults in the last 50 years.
B. Before the 20th century, no country had ever defaulted on funds borrowed in a foreign currency.
C. Latin America accounted for more than 60% of foreign currency defaults in the 1990s.
D. Countries are more likely to default on funds borrowed from foreign banks than on sovereign bond issues.
Practice Questions: Q1 Answer
Explanation: D is correct.
Historically, countries have been more likely to default on foreign bank debt than on sovereign bonds. Latin America is responsible for the greatest number of foreign currency defaults over the last five decades with more than 60% of defaults in each decade with the exception of the 1990s. Over the last 200 years there are many instances of default. The defaults primarily occurred in seven distinct time periods: 1824–1834, 1867–1882, 1890–1900, 1911–1921, 1931– 1940, 1976–1989, and 1998–2003. Thus, countries did borrow and default in the 19th century.
Topic 3. Local Currency Defaults
-
Simultaneous Defaults: Many countries that defaulted on foreign currency debt also defaulted at the same time on local (domestic) currency debt.
-
Historical Evidence: An S&P study shows that 23 issuers have defaulted on local currency debt since 1975, with defaulting countries ranging form Russia (1998–1999) to Argentina (2002–2004).
-
Largest Local Currency Defaults: The largest local currency default in dollar terms was Brazil’s $62 billion default in 1990, followed by Russia’s $39 Bn ruble default in 1998–1999.
-
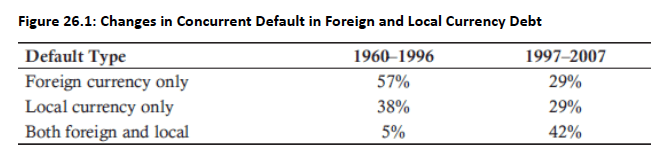
Concurrent defaults changes: Between 1960-1996 t0 1997-2007, simultaneous local- and foreign-currency defaults rose from 5% (1960–1996) to 42% (1997–2007) while both foreign-currency-only and local-currency-only defaults fell over the same period.
-
Shift in default composition (1976–2020): Sovereign defaults moved away from foreign-currency debt and bank loans toward local-currency debt and nonbank borrowings (Bank of Canada assseessment, 2021).
-
Shift toward domestic-law defaults: Countries increasingly default on local-currency debt under domestic law due to faster and more efficient restructurings than foreign-currency debt defaults. (Separate Study, 2022)
Topic 3. Local Currency Defaults
-
Why local currency defaults happen: Governments can print money, but constraints make default sometimes the lesser evil.
-
Gold standard constraint: Under the gold standard (pre-1971), money supply was tied to gold reserves, limiting a country’s ability to print currency to repay debt.
-
Shared currency constraint: In currency unions (e.g., the euro), individual countries cannot print money independently, illustrated by Greece during the 2015 debt crisis.
-
Printing vs default tradeoff: Printing money causes currency debasement and inflation (often severe), while default damages credibility, countries choose the less costly option.
-
Topic 4. Consequences of Sovereign Default
-
Historical: Defaults were sometimes followed by military intervention.
-
Modern Consequences:
-
GDP contraction: GDP typically falls by 0.5%–2.0% after a sovereign default, with the impact usually concentrated in the first year.
-
Weaker credit profile: Sovereign ratings are 1–2 notches lower for defaulting countries, with borrowing costs higher by 0.5%–1.0%; effects gradually fade over time.
-
Trade retaliation: Defaults often trigger trade frictions, leading to an average 8% decline in bilateral trade, with impacts lasting up to 15 years, especially hurting exporters.
-
Fragile banking systems: The probability of a banking crisis rises to 14% post-default, around 11% higher than in non-defaulting countries.
-
Political instability: Defaults are followed by sharp currency devaluations and a higher likelihood of leadership change—+45% for presidents/prime ministers and +64% for finance ministers or central bank heads.
-
Practice Questions: Q2
Q2. Following a sovereign default:
A. borrowing costs rise 1.0% to 2.5%, and the country is more likely to suffer a banking crisis.
B. countries are more likely to suffer banking crises and GDP growth generally falls 2.0% to 3.5%, but the drop is usually short-lived.
C. ratings fall one to two notches, and GDP growth falls between 0.5% to 2.0%.
D. trade retaliations are likely to occur but are short-lived, lasting only six months to one year.
Practice Questions: Q2 Answer
Explanation: C is correct.
Examining sovereign defaults leads to the following conclusions:
(1) gross domestic product (GDP) growth falls between 0.5% and 2.0% following a sovereign default, and the decline is short lived,
(2) ratings of countries that have defaulted at least once since 1970 are one to two grades lower than the ratings of similar countries that have not defaulted and borrowing costs are 0.5% to 1.0% higher with the effects lessening over time,
(3) sovereign default can cause trade retaliation, lasting up to 15 years, with export businesses most sharply affected,
(4) a banking crisis is more likely to follow a default, and
(5) sharp currency devaluations and changes in a country’s leadership often follow defaults.
Topic 5. Sovereign Default Risk Factors
-
Several factors influencing a country’s sovereign default risk as follows:
-
Level of indebtedness: Higher debt-to-GDP generally increases default risk; both external and domestic obligations (e.g., welfare, healthcare) must be considered. High debt alone does not imply default (e.g., U.S., Japan), but it matters alongside other factors.
-
Pension and social service commitments: Large pension and healthcare liabilities raise default risk, especially in aging populations where future obligations are rising.
-
Tax receipts (size): Higher and broader tax revenues improve a country’s ability to service debt, lowering default risk.
-
Stability of tax receipts: Stable and diversified revenue streams reduce default risk. Economies reliant on a narrow base (e.g., tourism or commodities) face higher risk; VAT and sales taxes are typically more stable than income taxes.
-
Political risk: Weak governance, autocratic regimes, and low central bank independence increase default risk due to reduced accountability and higher monetary financing risk.
-
External backing or support: Implicit or explicit support from stronger countries or institutions (e.g., EU membership) can lower perceived default risk, though such backing is not guaranteed.
-
- Sovereign default risk is multidimensional: It depends on indebtedness, social obligations (pensions and healthcare), tax capacity and stability, government credibility, and the structure and diversification of the economy.
Topic 6. Rating Agencies and Default Risk
-
Rating agencies have long-standing expertise in default risk assessment, developed over a century of corporate credit analysis and transferable to sovereign risk.
-
Investors are already familiar with corporate rating scales, making sovereign credit ratings intuitive to interpret.
-
By 1929, Moody’s had rated nearly 50 governments; interest declined post–Great Depression and WWII, then revived from the 1970s onward.
-
By 1994, 49 countries were rated, typically ranging from AAA/Aaa to BBB–/Baa3.
-
The sovereign bond market expanded sharply; by 2022, Moody’s, S&P, and Fitch each rated over 100 countries.
-
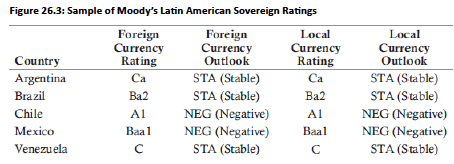
Moody’s and S&P assign two ratings per country:
-
Local currency rating for domestic-currency debt
-
Foreign currency rating for external borrowings
-
Topic 6. Rating Agencies and Default Risk
-
Rating outlooks signal direction: NEG (possible downgrade), STA (stable), POS (possible upgrade).
-
Local currency ratings are usually equal to or higher than foreign currency ratings since governments can issue local currency to service debt.
-
Exceptions exist (e.g., India in March 2010 had a lower local currency rating than foreign currency rating).
-
Ratings across agencies are broadly similar but can differ due to varying assessments of political, macroeconomic, and idiosyncratic risks.
-
Sovereign ratings change less frequently than corporate ratings and are analyzed using rating transition matrices.
-
One-year transitions (S&P, 1975–2021):
-
AAA sovereigns had a 96.82% probability of remaining AAA
-
BBB sovereigns had a 90.25% chance of no change, 4.48% upgrade, 5.26% downgrade
-
-
Over longer horizons (15 years), rating stability declines significantly.
-
A common criticism of rating agencies is regional bias, with systematic underrating observed in certain regions such as Latin America.
Topic 7. How Rating Agencies Measure Risk
-
Common framework: S&P, Moody’s, and Fitch follow broadly similar methodologies for sovereign ratings.
-
What ratings measure:
-
Assess a country’s creditworthiness from the perspective of banks and private bondholders, not official creditors (e.g., World Bank, IMF).
-
S&P: focuses on probability of default.
-
Moody’s: considers probability of default + loss severity (expected recovery).
-
Default definition: missed principal/interest payments or debt restructuring/rescheduling.
-
-
Key default risk drivers:
-
Economic, political, and institutional factors affecting debt repayment capacity.
-
S&P factors: political risk, economic structure and growth, fiscal flexibility, government debt burden, contingent/offshore liabilities, monetary flexibility, external liquidity, and external debt.
-
Moody’s & Fitch: use comparable factor-based frameworks.
-
-
Ratings decision process:
-
Lead analyst prepares a draft rating report.
-
Rating committee (typically 5–10 members) debates risk categories and votes on the final rating.
-
Topic 7. How Rating Agencies Measure Risk
-
Local vs. foreign currency ratings:
-
Both local and foreign currency ratings are typically assigned to countries.
-
Differences depend on monetary policy independence.
-
Countries without independent monetary policy (e.g., euro area) show converging ratings.
-
Floating FX regimes with strong domestic markets show larger divergence.
-
Approaches to LC vs. FC ratings:
-
Notch-up: foreign currency rating is primary; local currency rating is adjusted upward for domestic factors.
-
Notch-down: local currency rating is primary; foreign currency rating is adjusted downward for FX constraints.
-
-
-
Ratings review:
-
Periodic reviews plus event-driven reviews.
-
Shocks in one country can trigger reviews in neighboring countries due to contagion risk.
-
Topic 8. Sovereign Ratings Vs Default Risk
-
Rating agencies highlight a strong correlation between sovereign ratings and default risk, despite occasional rating errors.
-
S&P’s cumulative default study (1975–2021) empirically supports this relationship.
-
AAA-rated sovereigns recorded zero defaults within 15 months of rating assignment.
-
BBB-rated sovereigns showed a 4.78% probability of default over the same horizon.
-
CCC-rated sovereigns exhibited an extremely high default probability of 84.80% within 15 months.
Topic 9. Shortcomings of the Sovereign Rating System
-
Shortcomings of the Sovereign Rating System (Concise Bullets)
-
Upward bias: Ratings tend to be overly optimistic; reputational risk limits blatant bias, but optimism persists.
-
Herd behavior: Agencies often mirror each other’s upgrades/downgrades, reducing independent signals.
-
Lack of timeliness: Rating changes are often delayed, offering limited protection during fast-moving crises.
-
Crisis overreaction: Sharp downgrades during crises can amplify stress and create a vicious cycle.
-
Frequent rating revisions: Multiple changes within short periods suggest flawed initial assessments.
-
-
Key reasons behind rating failures
-
Poor data quality: Reliance on government-provided data, which may be incomplete or biased.
-
Limited resources: Analysts cover multiple countries, leading to shallow analysis and reliance on market consensus.
-
Revenue bias: Limited direct revenue from sovereign ratings; dependence on subsovereign revenues may soften judgments.
-
Indirect conflicts: Adjacent business lines may influence ratings, even without direct employment conflicts.
-
Topic 10. Credit Ratings and Sovereign Default Spreads
-
Growth of Sovereign Bond Markets: Since the 1980s, sovereign bond markets have expanded rapidly, with governments increasingly preferring bond issuance over bank borrowing.
-
Sovereign Default Spread: The yield difference between a risky sovereign bond and a risk-free benchmark (e.g., U.S. Treasury).
-
Market Interpretation: The sovereign default spread captures the market’s assessment of a country’s default risk.
-
Risk-Free Benchmark: U.S. Treasury bonds are commonly treated as risk free and used as the reference point for measuring sovereign risk.
-
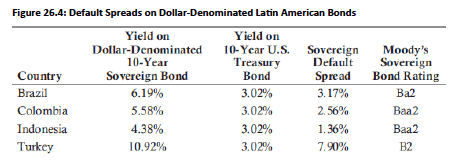
Example: On July 1, 2022, the 10-year Brazilian dollar bond yielded 6.00% versus 3.02% on the 10-year U.S. Treasury, implying a 2.98% sovereign default spread.
-
-
According to studies:
-
Default spreads are positively correlated with ratings and with default. In other words, low rated sovereign bonds are more likely to trade at higher yields (and yield spreads) and are more likely to default.
-
Default spreads are “leading indicators.” The spreads widen before a rating downgrade and narrow before a rating upgrade.
-
A rating change provides information to the market, despite the longer lag time relative to default spreads. The market reacts to rating changes when pricing bonds, implying that both ratings and default spreads are useful to market
participants when evaluating and understanding sovereign default risk.
-
Topic 10. Credit Ratings and Sovereign Default Spreads
-
Fig 26.4 shows the comparison of default spreads and Moody’s credit ratings for a
sample of dollar-denominated bonds in July 2022.
-
Same rating, different market perception: Despite both Colombia and Indonesia being rated Baa2 by Moody’s, investors require a higher return on Colombian sovereign bonds, indicating higher perceived risk.
-
Spread differential: In July 2022, Colombia’s default spread exceeded Indonesia’s by 120 bps (2.56% vs. 1.36%), reflecting this risk premium.
-
Topic 11. Advantages of Sovereign Default Spreads
-
Market-based spreads are more dynamic than ratings: As bonds trade and bond yields rise and fall, default spreads change, revealing information about the market’s perception of risk.
-
For example, in late 2005 the default spreads of Brazil and Venezuela were close, 3.18% and 3.09%, respectively. Spreads started to diverge between 2006 and 2009.
-
By December 2010, the default spread had widened to 10.26% on the Venezuelan bonds and narrowed to 1.32% on the Brazilian bonds.
-
It is clear that the market’s perception of the relative risk of the two countries was changing, as evidenced by the diverging spreads.
-
-
Spreads adjust quicker to new information: Similar to the advantage that changes occur in real time, yield spreads adjust more quickly to new information regarding the sovereign relative to bond ratings.
-
This means investors receive an earlier signal of potential threats and they can therefore adjust portfolios more quickly.
-
Topic 12. Disadvantages of Sovereign Default Spreads
-
Comparing local currency bond yields is less meaningful: Local currency bonds do not have a risk-free security with which to compare.
-
It is not practical to compare local currency bonds because differences in yields may reflect differences in expected inflation across countries rather than true risk.
-
Also, even with dollar-denominated bonds, it is the assumption that U.S. Treasury bonds are default risk free that makes calculating a yield spread meaningful.
-
-
Greater volatility in default spreads: Default spreads are volatile and changes in spreads may be affected by variables that are unrelated to the default risk of the sovereign.
-
For example, investor demand for the bonds and changes in liquidity can affect spreads but often have nothing to do with default risk.
-
-
Market size and concentration: CDS markets expanded rapidly, peaking near $60 trillion in 2007, then declined after the global financial crisis, with a small number of participants increasing systemic vulnerability.
-
Sovereign CDS growth: Although still a small share of the total market, sovereign CDS usage has risen steadily, with contracts referencing 85 sovereigns by July 2022.
-
Nature of a CDS contract: A CDS functions like insurance against bond default, where the buyer pays periodic premiums (CDS spread) on notional value and the seller compensates the buyer upon a predefined credit event.
-
Settlement mechanisms: CDSs settle either through cash settlement (difference between notional and market value) or physical settlement (delivery of the bond for full notional).
-
Practical example: An investor holding $20 million of 5-year Peru government bonds can buy 5-year CDS protection at 170 bps, paying $340,000 annually, and receive compensation if a default or restructuring occurs.
-
Key risks to the buyer: Protection pays out only if an official credit event occurs, and the buyer remains exposed to the counterparty risk that the CDS seller may fail to honor the contract.
Topic 13. Credit Default Swap (CDS) Spreads
-
Informational value of CDS spreads: CDS spreads react faster to market information than credit ratings, a pattern clearly observed during the 2009–2010 European sovereign crisis, including cases such as Greece.
-
Insights from spread movements: Changes in CDS spreads influence sovereign yields and ratings, predict sovereign risk more effectively than ratings, rise with macroeconomic stress and currency depreciation, and display contagion across related countries.
-
Limitations of CDS spreads: CDS pricing reflects credit, market, and liquidity risks and is often affected by illiquidity, which can distort pure credit risk signals.
-
Overall takeaway: Despite their imperfections, CDS spreads embed meaningful information about default risk, though they are not conclusively superior to market-based default spreads.
Topic 13. Credit Default Swap (CDS) Spreads
CR 8. Country Risk
By Prateek Yadav


