







Content ITV PRO
This is Itvedant Content department
Company Analysis and Business Evaluation
You are a financial analyst working for an investment research firm. Your task is to analyse Bajaj Finance Ltd. using its financial statements and annual reports. You will evaluate the company’s business model, financial performance, EPS, asset quality and competitive position against Shriram Finance and Cholamandalam. The analysis will help you determine the company’s overall financial performance and identify the stronger company among the three.
Business Scenario
Tools Required:
TradingView
NSE India / BSE India
Company Annual Report
ChatGPT or another AI tool
Pre-Lab Preparation
Topic : Fundamental & Ratio Analysis
Company analysis
Industry analysis
Macroeconomic analysis
Revenue and cost drivers
Liquidity ratios, Profitability ratios, Leverage ratios, Efficiency ratios
Task 1: Break Down the Business Model
1
Select an Indian Listed Company
Open TradingView or Screener.in and search for the selected company
Example : Company: Bajaj Finance
Note: You can download the annual report for the recent year 2025-26 from the investor section of the Bajaj Finance website, or download it from BSE or NSE
2
Understand the Business
Using the company's Annual Report and Investor Presentation, identify:
What products and services does the company offer?
Who are its major customers?
What are its major business segments?
What are the major factors driving revenue?\
What are the company's major operating costs?
What are its key competitive advantages?
What are the major business risks?
3
Use AI for Business Analysis
Enter a prompt such as:Companies: Bajaj Finance and its competitors
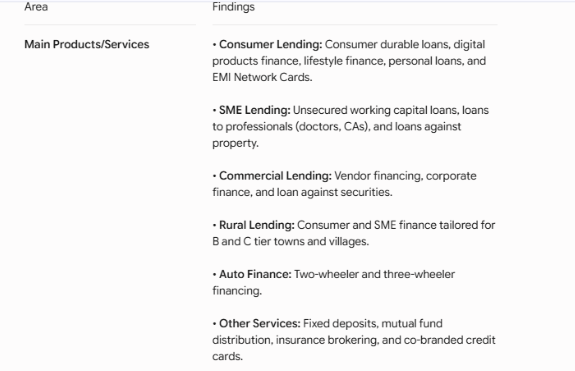
"Analyse the business model of Bajaj Finance using its latest annual report and investor presentation. Explain its main financial products and services, major customer segments, business segments, revenue sources, key revenue drivers, major costs, competitive advantages and key business risks. Present the findings in a concise table."
Student Output:
Prepare a Business Model Snapshot showing:
| Area | Findings |
|---|---|
| Main Products/Services | |
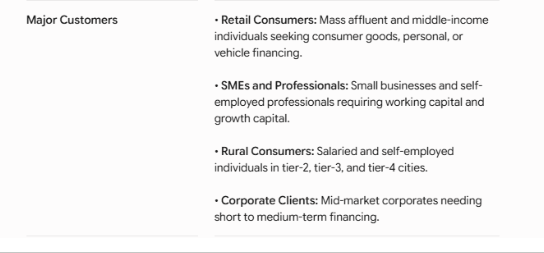
| Major Customers | |
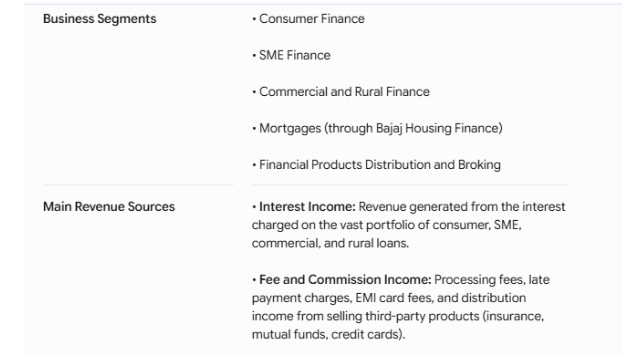
| Business Segments | |
| Main Revenue Sources | |
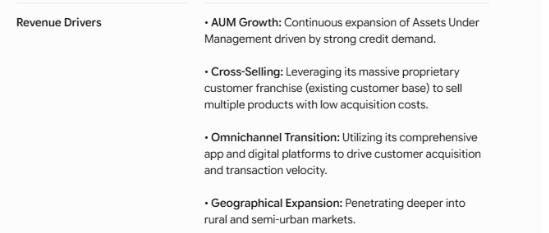
| Revenue Drivers | |
| Major Costs | |
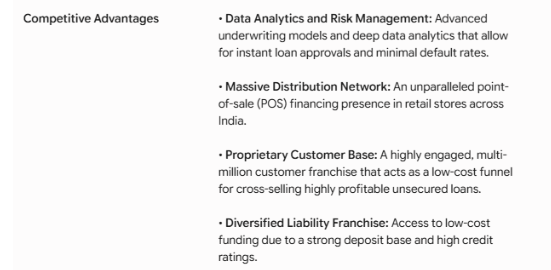
| Competitive Advantages | |
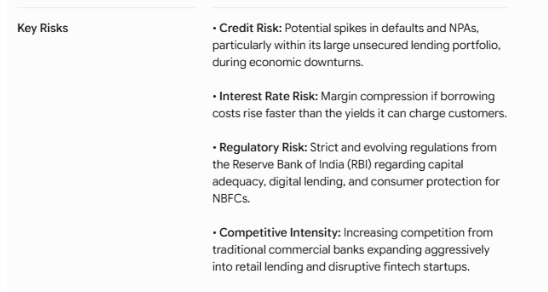
| Key Risks |
4
Review AI Output
5
| Area | Findings |
|---|---|
| Main Products/Services | Consumer, SME, commercial, rural and auto loans; insurance, mutual funds and other financial products |
| Major Customers | Retail consumers, SMEs, professionals, rural customers and corporates |
| Business Segments | Consumer Finance, SME Finance, Commercial & Rural Finance, Mortgages and Financial Product Distribution |
| Main Revenue Sources | Interest income from loans and fee/commission income |
| Revenue Drivers | Growth in loans/AUM, customer base, cross-selling and expansion into new markets |
| Major Costs | Interest on borrowings, credit losses/provisions and operating expenses |
| Competitive Advantages | Strong customer base, digital platforms, distribution network and data-driven credit assessment |
| Key Risks | Credit/default risk, interest-rate risk, regulatory changes and competition |
Interpret AI Output:
Takeaway:
Bajaj Finance mainly earns interest by lending money to different customer segments. Its growth depends on expanding its loan book and customer base, while its major risks are credit losses, funding costs and regulation.
Task 2: Analyse Financial Performance
Company: Bajaj Finance Ltd. | Period: Analyse the latest 3–5 financial years available.
Data to Collect
From TradingView, Screener.in, and the Investor Presentation, collect the following:
Revenue / Total Income
Operating Profit
Net Profit
EPS
Asset Quality (Gross NPA & Net NPA) (New Metric for Financial Companies)
1
Open TradingView
a
Open TradingView: https://in.tradingview.com/
b
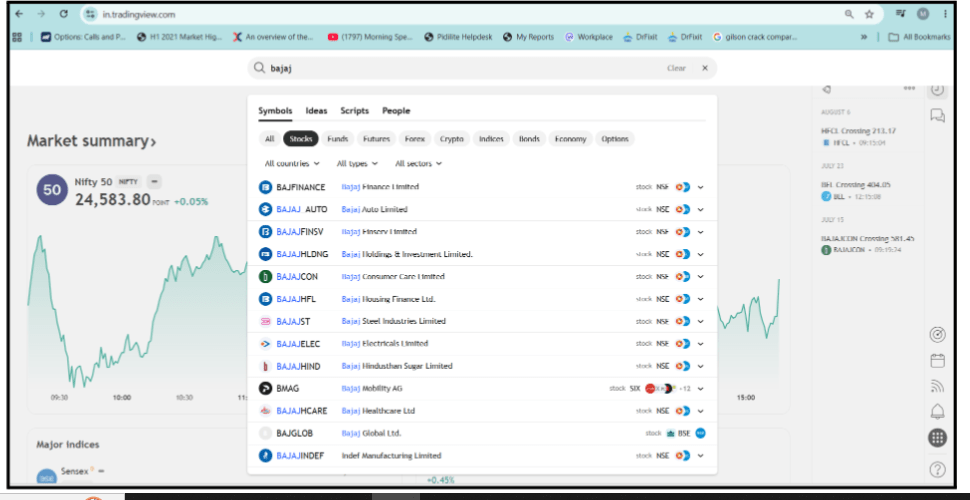
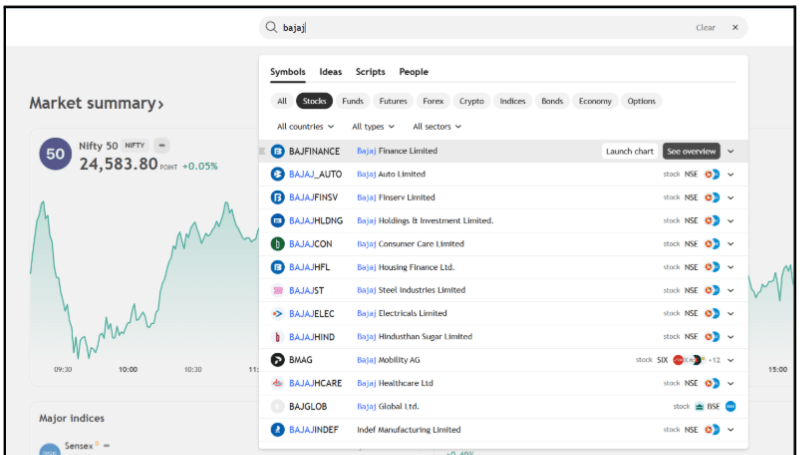
In the search bar, search for your company (e.g., Bajaj Finance Ltd. – NSE: BAJFINANCE).
c
Open the Overview page.
d
Click Financials.
e
Select “Statements” to view:
Income Statement
Balance Sheet
Cash Flow
f
Select “Annual” (Annual Reports) to view year-wise financial data
g
Understand the financial information for the latest years.
2
Income Statement Analysis
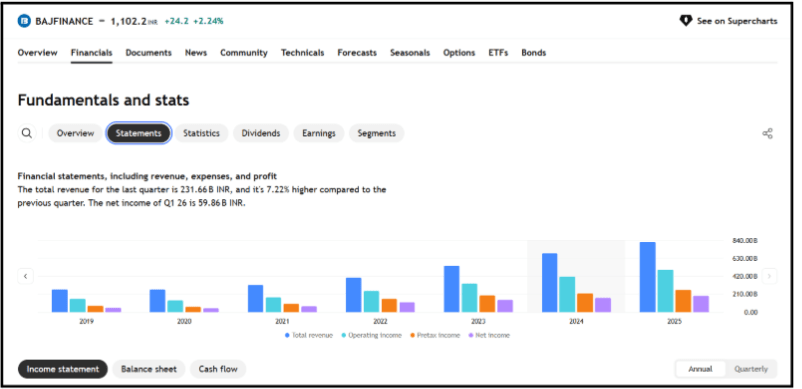
Note for Finance Companies: Unlike manufacturing companies, an NBFC's primary cost is borrowing money. Pay close attention to the "Total interest expense (banks)" line item in TradingView to understand their cost of funds.
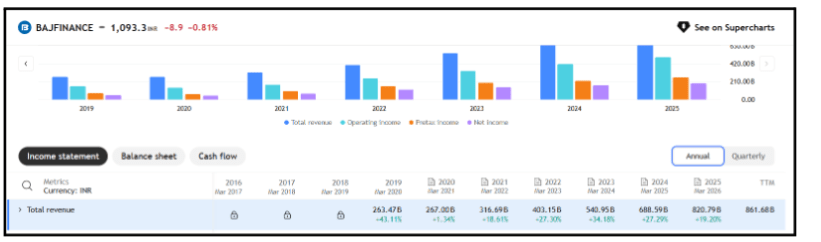
A. Revenue Growth Analysis:
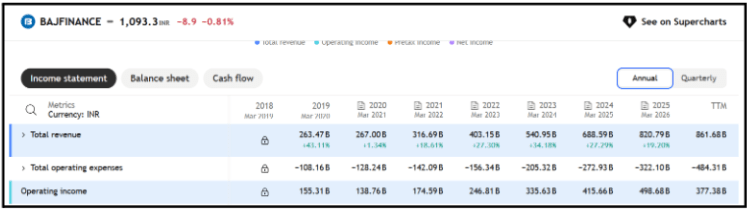
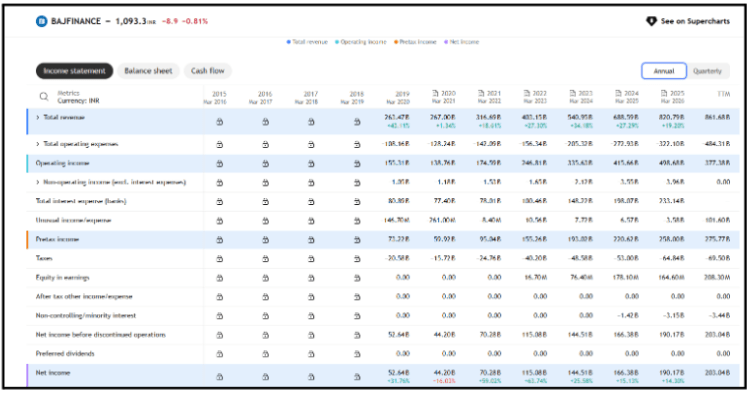
2024 → ₹540.95B (+34.2%)
2025 → ₹688.59B (+27.29%)
2026 → ₹820.79B (+19.2%)
Find Out the Reason: Investigate why revenue increased using Google Search, Annual Reports, or AI tools.
Open AI Tool – ChatGPT / Gemini / Grok
Enter Prompt:
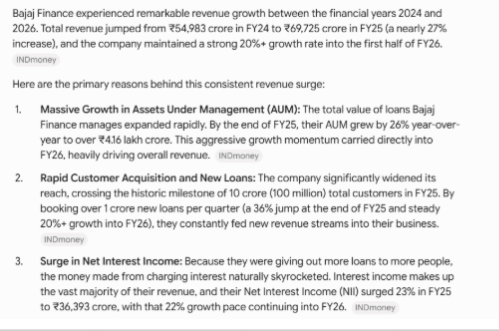
“Analyze Bajaj Finance's revenue growth from 2024 to 2026. Explain why revenue increased each year and identify the major factors responsible for the strong growth, especially from 2024 to 2026. Consider AUM, new loans, customer growth, interest income, product diversification, digital expansion and geographic expansion.”
Review AI Output :
Interpret AI Output
Revenue Growth Analysis – Bajaj Finance
Revenue Growth Analysis – Bajaj Finance
Bajaj Finance’s revenue grew strongly from 2024 to 2026. The main reasons were:
Higher AUM – The company’s total loan portfolio increased significantly, generating more income.
More customers and loans – A growing customer base and higher number of new loans increased revenue.
Higher interest income – More loans resulted in higher interest earnings.
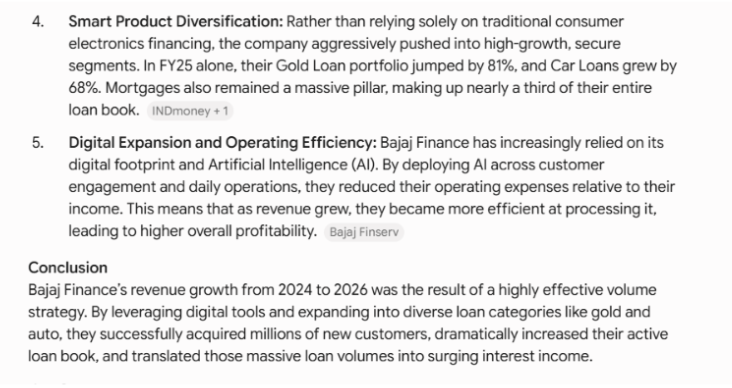
Product diversification – Growth in gold loans, car loans and mortgages helped increase business.
Digital expansion – Digital technology and AI helped the company reach customers and operate more efficiently.
Conclusion:
Bajaj Finance’s strong revenue growth was mainly driven by more loans, more customers, higher AUM, increased interest income and expansion into different loan products.
B. Operating Profit Growth Analysis
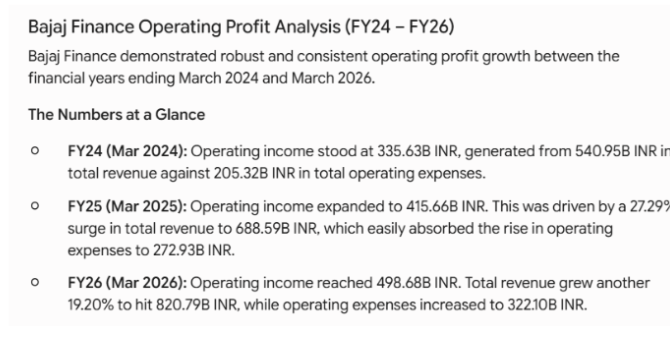
Calculate the growth for Operating Income. For Bajaj Finance:
2024 → ₹335.63B
2025 → ₹415.66B (+23.8%)
2026 → ₹498.68B (+20.0%)
Find Out the Reason: Investigate why operating profit increased using Google Search, Annual Reports, or AI tools.
AI Prompt:
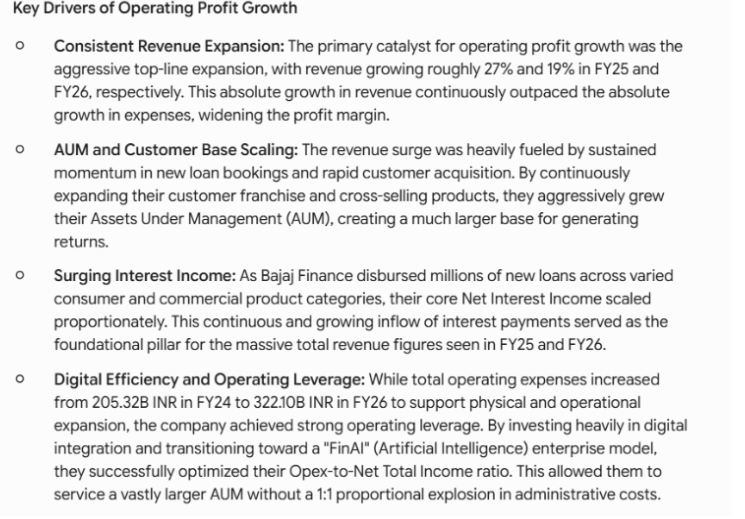
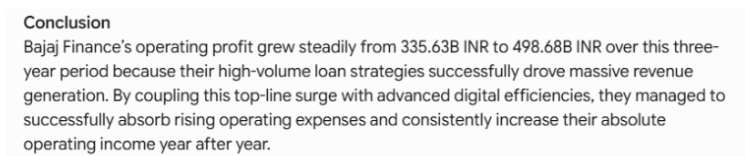
“Analyze Bajaj Finance's operating profit growth from 2024 to 2026. Explain why operating profit increased each year. Consider revenue growth, AUM, interest income, operating expenses, customer growth and digital efficiency.”
Review AI Output
C. Net Profit Growth Analysis
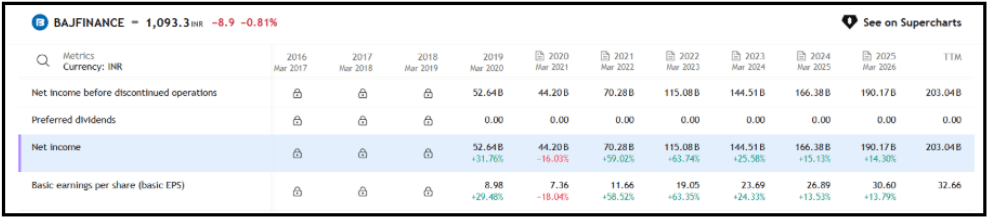
2024 → ₹144.51B
2025 → ₹166.38B (+15.1%)
2026 → ₹190.17B (+14.3%)
Find Out the Reason for Net Profit Growth
Prompt:
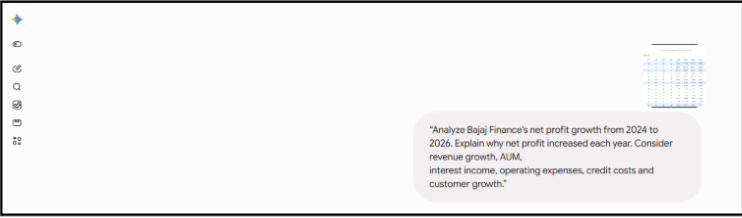
“Analyze Bajaj Finance's net profit growth from 2024 to 2026. Explain why net profit increased each year. Consider revenue growth, AUM, interest income, operating expenses, credit costs and customer growth.”
Review AI Output
Interpret AI Output – Net Profit Growth
Net Profit Analysis – Bajaj Finance
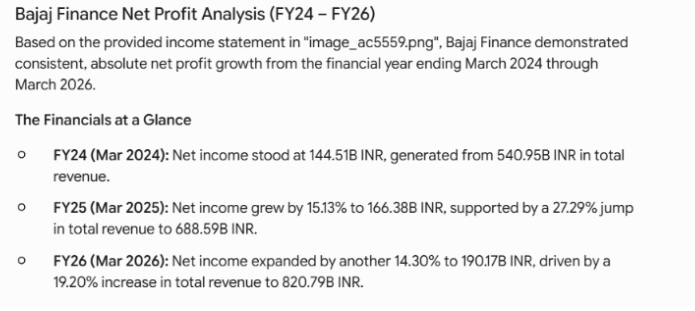
Bajaj Finance’s net profit increased from ₹144.51 billion in FY24 to ₹190.17 billion in FY26.
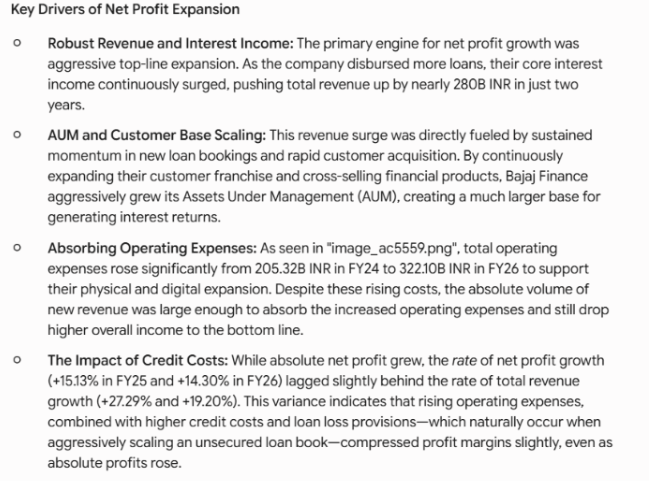
Main reasons:
Higher revenue and interest income – More loans generated more interest income.
Higher AUM – Growth in the loan portfolio supported profit growth.
More customers and loans – A larger customer base increased business.
Higher expenses – Operating expenses and credit costs also increased, which limited the rate of profit growth.
Overall strong business growth – Despite higher costs, revenue growth was sufficient to increase net profit.
Conclusion:
Bajaj Finance’s net profit grew steadily because of higher AUM, more customers, increased lending and interest income, although rising operating and credit costs reduced the pace of profit growth.
D. EPS (Earnings Per Share) Growth Analysis
2024 → ₹23.69 (+24.33%)
2025 → ₹26.89 (+13.53%)
2026 → ₹30.60 (+13.79%)
Find Out the Reason for EPS Growth
Prompt:
“Analyze Bajaj Finance's EPS growth from 2024 to 2026. Explain in simple language why EPS increased each year. Consider net profit growth, number of shares outstanding and overall business performance.”
Review AI Output
Interpret AI Output – EPS Growth
EPS Growth Analysis – Bajaj Finance
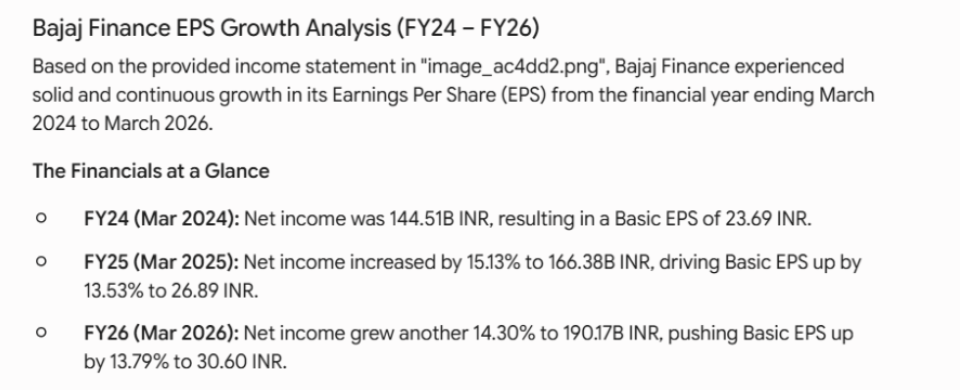
Bajaj Finance’s EPS increased from ₹23.69 in FY24 to ₹30.60 in FY26.
Main reasons:
Higher net profit – Rising profits increased earnings available to each shareholder.
Business growth – Higher AUM, more customers and increased lending supported profit growth.
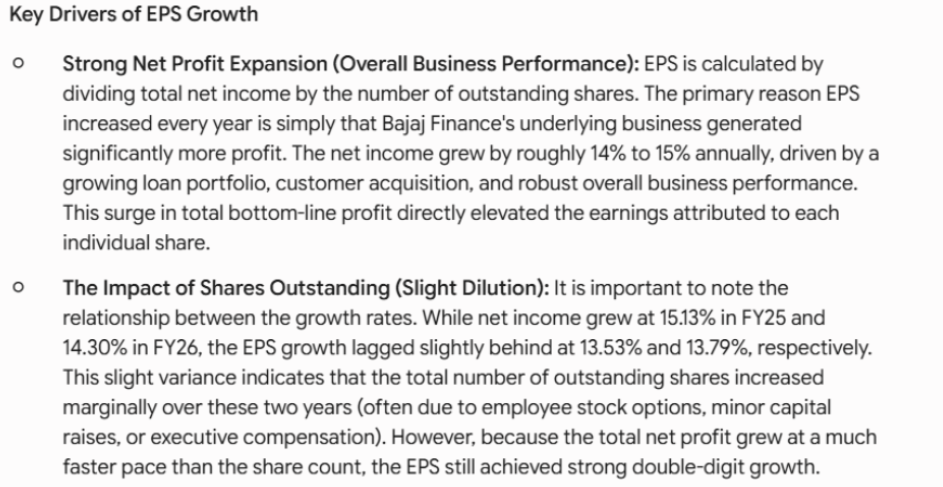
More earnings per share – Net profit grew faster than the number of shares outstanding.
Slight increase in shares – The small rise in shares slightly reduced the rate of EPS growth, but EPS still increased strongly.
Conclusion:
Bajaj Finance’s EPS grew steadily because net profit increased strongly and outpaced the growth in shares outstanding, resulting in higher earnings for shareholders.
E. Asset Quality Analysis (Gross NPA & Net NPA)
Check the company's Investor Presentation to find the NPA percentages.
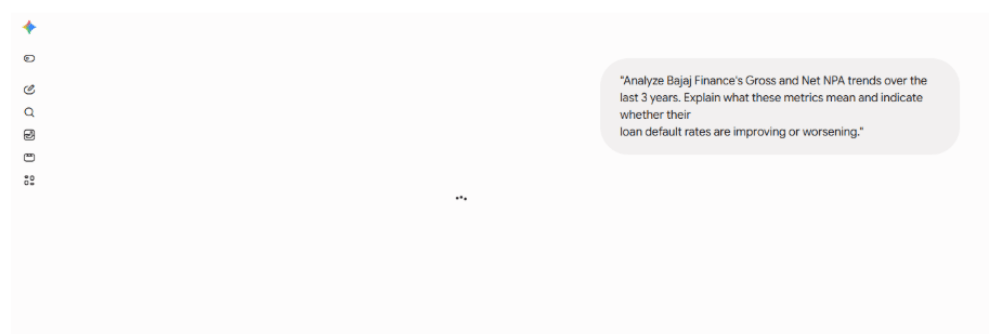
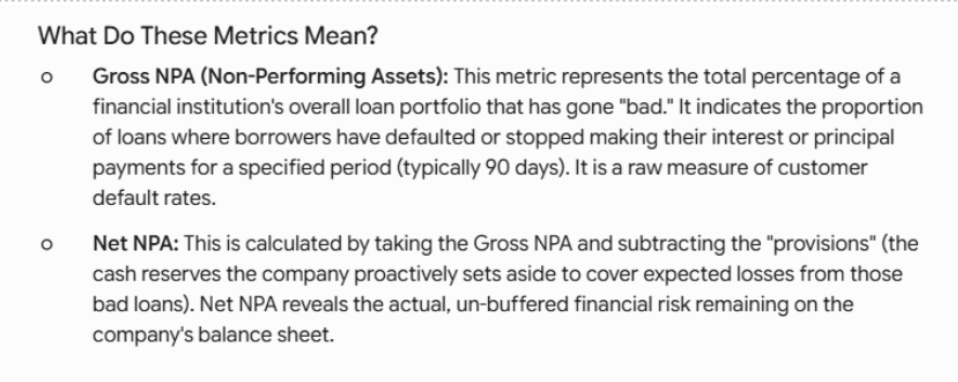
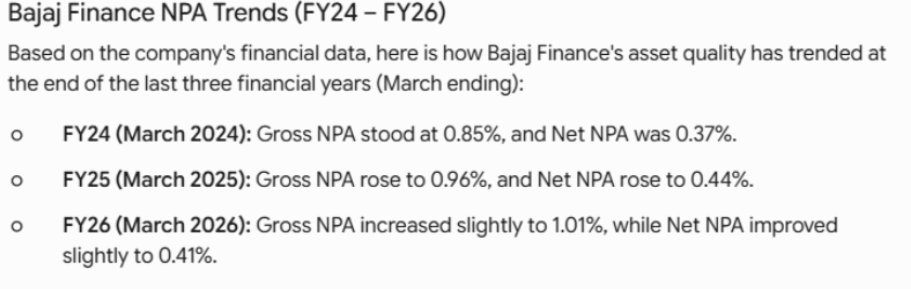
AI Prompt: "Analyze Bajaj Finance's Gross and Net NPA trends over the last 3 years. Explain what these metrics mean and indicate whether their loan default rates are improving or worsening."
Review AI Output:
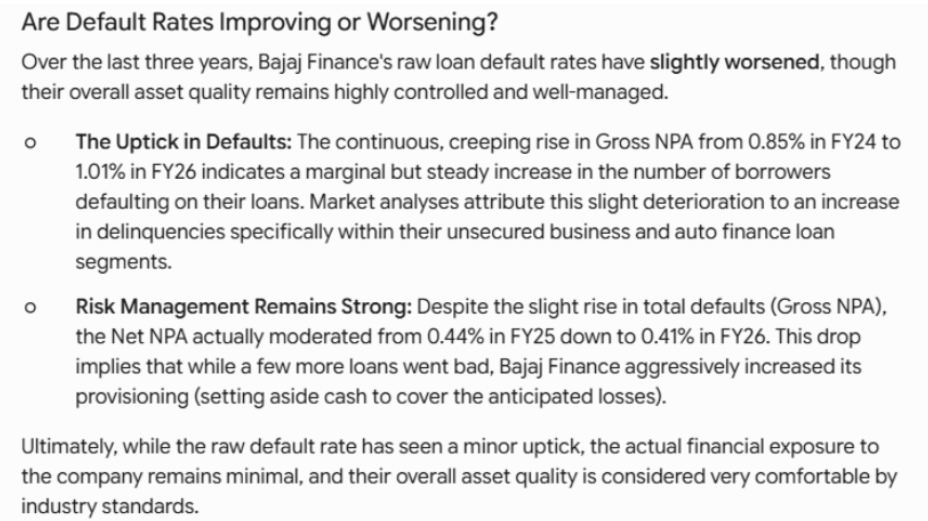
Interpret AI Output:
NPA Analysis – Bajaj Finance
Gross NPA: Increased from 0.85% in FY24 to 1.01% in FY26, showing a slight increase in loan defaults.
Net NPA: Increased from 0.37% in FY24 to 0.44% in FY25, but improved to 0.41% in FY26.
Overall: Asset quality has slightly weakened, but the level of NPAs remains low.
Risk management: The improvement in Net NPA in FY26 indicates that the company has maintained adequate provisions against bad loans.
Conclusion:
Bajaj Finance’s loan defaults have increased slightly, but overall asset quality remains well controlled.
Task 3 : Competitor Comparison:
1
AI Comparison Analysis Compare your primary company (e.g., Bajaj Finance) with two major competitors (e.g., Shriram Finance and Cholamandalam).
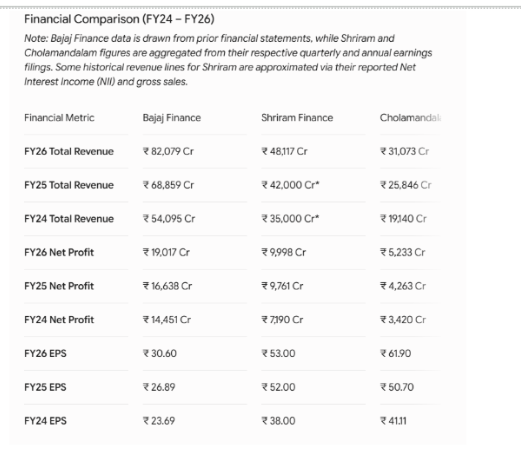
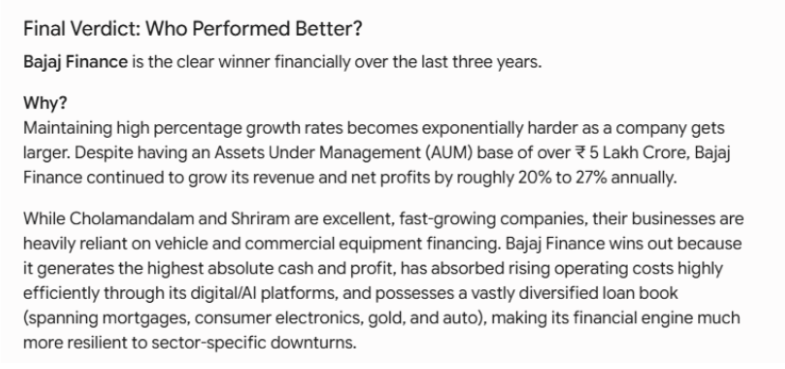
AI Prompt: "Compare Bajaj Finance with two major competitors (Shriram Finance and Cholamandalam) over the last 3 years. Compare their Revenue, Operating Profit, Net Profit and EPS. Explain the comparison in simple language and give a final verdict on which company performed better financially and why."
Review the AI output:
Interpret the AI Output :
Financial Comparison – Bajaj Finance vs Competitors
Bajaj Finance performed strongly over FY24–FY26 compared with Shriram Finance and Cholamandalam.
Key findings:
Largest company – Bajaj Finance had the highest revenue and net profit among the three.
Strong growth – Its revenue and net profit increased consistently over the three years.
Higher total profit – FY26 net profit was ₹19,017 crore, much higher than Shriram Finance (₹9,998 crore) and Cholamandalam (₹5,233 crore).
EPS – Shriram Finance and Cholamandalam had higher EPS, but this does not necessarily mean they are more profitable; EPS also depends on the number of shares.
Diversified business – Bajaj Finance operates across many lending segments, reducing dependence on one particular type of loan.
Verdict
Bajaj Finance is the strongest overall performer among the three based on revenue, net profit, consistent growth and business diversification.
Note for students: When comparing companies, don't decide the winner using only EPS. Look at revenue growth, profit growth, profitability, asset quality and other financial ratios together
Similarly, you can analyse the company's Balance Sheet by following the exact same steps outlined above.
Data to Collect:
Total Assets
Total Liabilities
Total Equity (Shareholders' Funds)
Total Borrowings (Debt)
Cash and Short-Term Investments
How to Analyse:
Navigate to the Financials tab on TradingView and select Balance Sheet.
Switch the view to Annual.
Extract the key metrics for the last 3 financial years.
Use an AI tool to interpret the trends and understand the company's financial health.
By Content ITV