Book 4. Valuation and Risk Models
FRM Part 1
VRM 13. Modeling Non-Parallel Term Structure Shifts And Hedging
Presented by: Sudhanshu
Module 1. Factors, Principal Components and Key Rates
Module 2. Ket Rate Exposures and Hedging
Module 3. Forward Bucket and Volatility
Module 1. Factors, Principal Components and Key Rates

Topic 1. Limitations of Single-Factor Approach
Topic 2. Principal Component Analysis (PCA)
Topic 3. PCA: Example of Factor Loadings and Factor Scores
Topic 4. Factor Scores
Topic 5. Key Rate Shift Analysis
Topic 6. Key Rate '01 (KR01)
Topic 7. Key Rate Duration
Topic 1. Limitations of Single-Factor Approach
- Single-Factor Limitation: Assumes all yield curve rate changes driven by one factor with parallel shifts only
- Restrictive Assumption: All interest rates (short to long-term) move up or down by same amount simultaneously
- Example Single Factor: 10-year par rate (10-year swap rate) driving all term structure movements
- Reality Check: Yield curve rarely shifts in perfectly parallel fashion - rates at different maturities move independently
- Multifactor Solution: Key rate and bucket approaches assume rate changes driven by two or more factors
- Practical Benefit of multifactor models: Multifactor models allow for nonparallel shifts, providing more accurate risk measurement and hedging
Topic 2. Principal Component Analysis (PCA)
-
PCA is used to decompose historical term structure movements into uncorrelated factors (principal components).
-
Captures patterns in the daily changes of interest rates across maturities.
-
Each day’s curve shift is modeled as a weighted sum of these factors:
-
Where:
- factor score (daily realization)
- factor loading vector
-
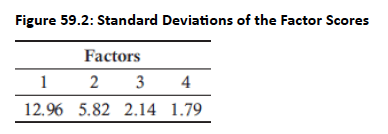
Factor Scores: Variable values relating to a specific data point covering daily changes, with their standard deviations aligned with the relative importance of each factor. The variance of all of the factor scores, when summed, equal the total variance of all rate movements.
-
Examples:
- Factor 1: Parallel (level) shift – affects all maturities in same direction.
- Factor 2: Slope shift – short- and long-term rates move in opposite directions.
- Factor 3: Curvature – mid-term rates move differently than short and long ends.
- Empirical studies show: 3 factors typically explain >95% of yield curve movement.
Topic 3. PCA: Example of Factor Loadings
-
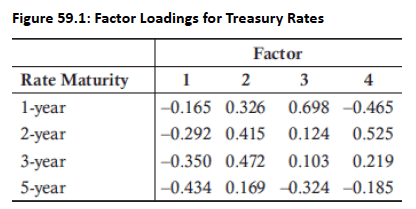
Factor Loadings:
-
Factor 3 Example: +1 unit changes 2-year rate by 0.124 bps and 3-year rate by 0.103 bps
- Factor 1 Direction: Positive units drive all rates lower; negative units drive all rates higher (parallel shift)
- Daily Rate Changes: Result from linear combination of all factor movements
-
Topic 4. Factor Scores
-
Factor scores are daily realizations of principal components—how much each factor moved on a day.
-
Standard deviation of factor scores = factor importance.
-
Variance contributed by each factor:
- Example:
- Contribution:
-
Use in volatility calculation:
Practice Questions: Q1
Q1. Assume the standard deviations for factor scores are 10.25, 7.16, 4.12, and 3.08. How much of an impact do the first two factors together have relative to the total variance?
A. 41.65%.
B. 57.48%.
C. 70.74%.
D. 85.52%.
Practice Questions: Q1 Answer
Explanation: D is correct.
The total variance is equal to the following:
The first two variances are 105.06 and 51.27 respectively, totaling 156.33 (which is 85.52% of the total).
Topic 5. Key Rate Shift Analysis
- Key Rate Exposures: Describe bond portfolio risk distribution along term structure and assist in proper hedging
- Liquid Instruments: Based on most liquid government bonds (recently issued, selling near par) for accurate risk measurement
- Partial '01s: Used for swap portfolios or bond/swap combinations; derived from liquid money market and swap instruments
- Forward-Bucket '01s: Measure risk based on yield curve shape changes rather than other securities; provide yield curve risk understanding
- Coverage Enhancement: Partial '01s and forward-bucket '01s use more rates than key rate approaches, dividing term structure into many regions
- Key Rate Simplification: Assumes all rates determined by few key rates (typically 2-, 5-, 10-, 30-year par yields for U.S. Treasury)
- Nonparallel Shifts: Key rate shift technique enables modeling of nonparallel yield curve movements where selected key rates drive all rate changes
Practice Questions: Q2
Q2. Which of the following statements regarding partial ‘01s is most accurate?
A. They reflect a 100 basis point change in rates.
B. They are derived from highly liquid instruments.
C. They cannot be used to hedge risk in swap portfolios.
D. They differ significantly from key rate exposures in terms of functionality.
Practice Questions: Q2 Answer
Explanation: B is correct.
Partial ‘01s are derived from highly liquid instruments. They reflect a one basis point change in rates, they are very often used to hedge swap portfolio risk, and they are very similar to key rate exposures in terms of functionality.
Practice Questions: Q3
Q3. Which of the following maturities is least likely associated with a key rate for U.S. Treasuries?
A. 2-year.
B. 10-year.
C. 15-year.
D. 30-year.
Practice Questions: Q3 Answer
Explanation: C is correct.
Key rates for U.S. Treasuries are typically 2-, 5-, 10-, and 30-year maturities. The 15-year maturity is not usually a key rate.
Topic 6. Key Rate '01 (KR01)
-
Definition: Dollar change in portfolio value due to +1bp change in one key rate.
- All KR01s sum to DV01:
- Negative KR01: Price increases as rate increases (typical for long bonds).
- Positive KR01: Price decreases as rate increases (e.g., shorting bonds).
- Example: If 5Y key rate increases by 1bp and value drops from 98.02 to 97.98:
Topic 7. Key Rate Duration
-
Measures % change in value from a 100bp change in one key rate:
- Or using KR01:
-
Example:
- Summing all key rate durations ≈ effective duration (for parallel shifts).
Practice Questions: Q4
Q4. Key rate duration is most accurately described as the:
A. dollar change in portfolio value associated with a 1 basis point change in yield.
B. dollar change in portfolio value associated with a 100 basis point change in yield.
C. percentage change in portfolio value associated with a 1 basis point change in yield.
D. percentage change in portfolio value associated with a 100 basis point change in yield.
Practice Questions: Q4 Answer
Explanation: D is correct.
Key rate duration is a measure of percentage change, not dollar change. The relevant change in yield is 100 basis points, not 1 basis point.
Module 2. Key Rate Exposures and Hedging
Topic 1. KR01-Based Hedging
Topic 2. Hedging Example
Topic 3. Assumptions and Limitations
Topic 1. KR01-Based Hedging
- DV01: Impact of one basis point shift in all spot rates on portfolio value (parallel shift hedging)
- KR01s/Partial '01s: Impact of shifts in specific spot rates (e.g., for 1-year, for 3-year, for 10-year)
-
Mathematical Relationship:
-
- Superior Hedging: KR01s hedging covers wider range of term structure movements than parallel-shift DV01 hedging
- Parallel Assumption: When all key rate shifts are summed, they assume parallel shift across all maturities
- Strong Assumption: Key rate analysis assumes rates affected only by surrounding key rates, but real shifts aren't perfectly linear
- Practical Value: Despite limitations, key rate exposure analysis provides useful tool for measuring bond price sensitivity
Practice Questions: Q5
Q5. A key rate for a 2-year spot rate will represent the increase in portfolio value from a:
A. one basis point increase in the 2-year spot rate.
B. one basis point decrease in the 2-year spot rate.
C. one basis point increase in the 1- and 2-year spot rates.
D. one basis point decrease in the 1- and 2-year spot rates.
Practice Questions: Q5 Answer
Explanation: B is correct.
Interest rates and portfolio values move in opposite directions. For a 2-year spot rate, a key rate will represent the increase in portfolio value from a one basis point decrease in the 2-year spot rate.
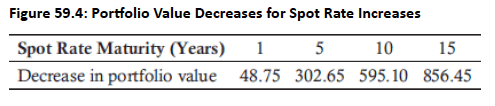
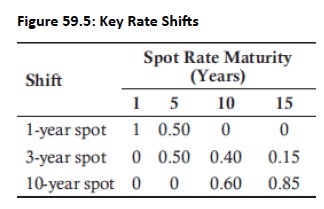
Topic 2. Hedging Example
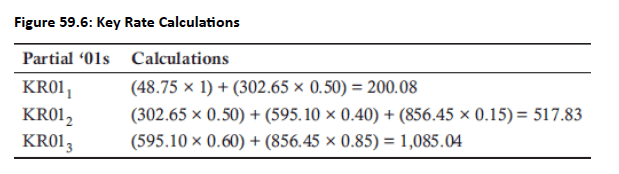
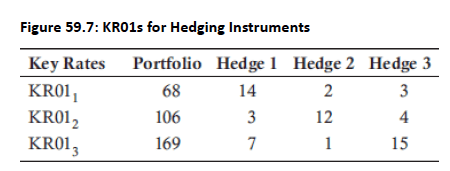
- Portfolio Composition: Equal investments in four ZCBs (1, 5, 10, and 15-year maturities). Figure 59.4: Shows portfolio value decrease from one basis point increases in relevant spot rates. Figure 59.5: Illustrates key rate shifts associated with each spot rate maturity. Key rates are calculated in Fig 59.6. For KR01 based hedging, Fig 59.7 shows available portfolio with KR01s.
- Instrument 1 KR01s: [3,−4],Instrument 2 KR01s: [2,1]\text{Instrument 1 KR01s: } [3, -4], \quad \text{Instrument 2 KR01s: } [2, 1]
-
For hedging, set KR01 to 0.
- On solving,
Practice Questions: Q6
Q6. Assume the following KR01s along with two hedging instruments.
To properly hedge this portfolio, which of the following positions should an investor take?
A. A short position of 1 and long position of 3 for
B. A long position of 6 and short position of 4 for
C. A long position of 5 and short position of 28 for
D. A long position of 46 and long position of 45 for
Practice Questions: Q6 Answer
Explanation: C is correct.
The correct algebraic equations to set up based on the table are:
Solving for the variables, we have 5 for and –28 for . This represents a long position of 5 and a short position of 28.
Topic 3. Assumptions and Limitations
-
Assumptions:
- Changes in yield curve are captured only at selected key points.
- Hedging instruments match key rate exposures linearly.
-
Limitations:
- Market rates may shift in ways not captured by selected key rates.
- Instruments may have cross-rate exposures (correlation between KR01s).
- Best Practice: Combine with PCA and forward buckets for more granular risk views.
Instrument 1 KR01s: [3,−4],Instrument 2 KR01s: [2,1]\text{Instrument 1 KR01s: } [3, -4], \qu
Module 3. Forward Bucket and Volatility
Topic 1. Forward-Bucket ‘01
Topic 2. Forward Bucket: Example
Topic 3. Forward-Bucket Duration
Topic 4. PCA + KR01 Volatility Estimation
Topic 1. Forward-Bucket ‘01
- Bucket Method: Uses segments of interest rates covering term structure instead of individual key rates.
- Example of buckets: 0–1Y, 1–2Y, 2–3Y (short-end exposure)
- Impact Calculation: Dollar impact derived from changing every spot rate in each bucket by 1bp.
- Forward Bucket '01: Dollar decrease in portfolio value due to 1bp increase in all forward rates in a bucket.
-
Spot rates can be derived from forward rates using the following formula if N is the specific year’s spot rate (R):
-
-
-
The impact of a one basis point change in forward rates on spot rates and the resulting portfolio value can then be calculated.
- If is initial value, and is value after shifting bucket iii:ViV_iV0V_0
- Total DV01:
Topic 2. Forward Bucket: Example
- Assume a 3Y bond with, FV = $100, 4.5% coupon, 3.5% flat term structure.
- Value before shift = 102.8245V0=102.8245V_0 = 102.8245
-
Bucket 0–1Y: 102.8245−102.8145=0.0100102.8245 - 102.8145 = 0.0100
-
Similarly,
- For bucket 1–2Y: 102.8245−102.8148=0.0097102.8245 - 102.8148 = 0.0097
- For bucket 2–3Y:
-
Now, assume all forward rates are increased by one basis point:
-
-
The price difference between 102.8245 and 102.7957 with rounding is approximately 0.0289
Practice Questions: Q7
Q1.The value of a 3-year bond is 103.960. If forward rates are increased by one basis point, the value falls to 103.925. Which combination of three forward-bucket ‘01s is feasible for this bond?
A. 0.010, 0.009, 0.008.
B. 0.014, 0.012, 0.009.
C. 0.017, 0.017, 0.017.
D. 0.020, 0.011, 0.006.
Practice Questions: Q7 Answer
Explanation: B is correct.
The difference in price is equal to 0.035 (103.960 – 103.925). The combination of three forward-bucket ‘01s must equal 0.035. The only choice that sums to 0.035 is 0.014, 0.012, and 0.009.
Topic 3. PCA + KR01 Volatility Estimation
- Banks must assess 10 KR01s, including spot rates at 3 and 6 months, along with rates at 1, 2, 3, 5, 10, 15, 20, and 30 years.
- Banks must also compute Value at Risk (VaR) and Expected Shortfall (ES).
- Combine PCA with KR01s:
-
where
- std dev of factor score
- daily change in portfolio from factor iii
- Alternative Approach: Par yields can be used instead of spot rates to define key rate shifts.
- Market Connection: Par yields ultimately reflect spot rates since they're derived from market prices of actively traded instruments.
Topic 4. Calculating Duration from KR01 and FB01
- Just as DV01 can be segmented into spot rates, par rates, or forward rates, the same concept applies to duration calculations.
-
An '01 measure can substitute for DV01 in duration calculations to achieve rate-specific duration measures
- Formula for Duration:
-
Example:
-
- Helps identify which forward segment most affects the portfolio.
Practice Questions: Q8
Q8.With an initial portfolio value of 100.565 and face value of 100, the forward-bucket duration for a forward-bucket ‘01 of 0.0095 is closest to:
A. 0.9447.
B. 0.9500.
C. 94.47.
D. 95.00.
Practice Questions: Q8 Answer
Explanation: A is correct.
The formula to calculate the duration is equal to: