Book 3. Operational Risk
FRM Part 2
OR 6. Risk Reporting
Presented by: Sudhanshu
Module 1. Organizational Committees
Module 2. Operational Risk Reporting Components
Module 3. Operational Risk Reporting Challenges
Module 4. External Reporting Best Practices
Module 1. Organizational Committees

Topic 1. Different Organizational Committees
Topic 2. Risk Committee
Topic 3. Audit Committee
Topic 4. Executive Committee (ExCo)
Topic 5. Central Operational Risk Function
Topic 6. Business Line Managers
Topic 1. Different Organizational Committees
- Final Risk Management Step: Risk monitoring provides organizational leaders with risk profile visibility, risk appetite compliance assurance, and framework effectiveness evaluation tools
- Comprehensive Risk Profile: Includes operational exposures, risk appetite/indicators, past events, mitigation strategies, and resilience measures for complete organizational assessment
- Key Performance Measure: Variance between actual and expected losses (both frequency and severity) serves as critical metric for general and granular risk assessment
- Dual Audience Structure: External audiences include regulators, clients, suppliers, and public; internal audiences encompass risk/audit/executive committees, central risk function, and business lines
- Multi-Board Participation: Individuals may serve on multiple boards concurrently, requiring tailored reporting approaches for different internal audience needs
Topic 2. Risk Committee
-
Role and Responsibilities
-
Charged by the Board of Directors with monitoring the firm's overall risk management framework.
-
Monitors operational risk alongside all other risk types.
-
Ensures monitoring and control systems are operating and complying with board-set risk appetite.
-
-
Information Received
-
Summary Level: Operational risk exposures, trends, emerging risks.
-
Detailed Level: Key Risk Indicators (KRIs), large event investigations, frequency and severity of risk events.
-
-
Outcome: Provides directives to be executed by the Executive Committee (ExCo).
Topic 3. Audit Committee
-
Role and Responsibilities:
-
Provides third-level oversight of an organization.
-
Directly managed by the internal audit function.
-
Assures the effectiveness and efficiency of the entity's internal control system.
-
-
Reporting:
-
Internal audit regularly reviews operational risk and internal control functionalities.
-
Reports findings to both the Audit Committee and the Executive Committee (ExCo).
-
Topic 4. Executive Committee (ExCo)
-
Role and Responsibilities:
-
Serves as the steering committee for the overall board.
-
Composed of senior executives and elected board members.
-
Prioritizes issues, ensures strong governance, oversees board policies.
-
Facilitates decision-making between board meetings and during crisis situations.
-
Oversees the effective and proper execution of the operational risk management framework.
-
-
Information Received:
-
Risk exposures, trends, events, action plans, culture, and remediation efforts.
-
Practice Questions: Q1
Q1. Which of the following statements about the board of directors is most accurate regarding operational risk monitoring?
A. The audit committee serves as the second line of risk oversight.
B. The risk committee is only tasked with monitoring operational-type risks.
C. A committee member cannot serve on both the risk committee and the audit committee.
D. The executive committee oversees the execution of the operational risk management framework.
Practice Questions: Q1 Answer
Explanation: D is correct.
The executive committee is tasked with overseeing the execution of the operational risk management framework, prioritizing issues, ensuring strong entity-wide governance, overseeing board policies, and facilitating decision-making.
The audit committee is the third line of risk oversight. The risk committee monitors all risk types, not just operational. Because there is often overlap in these functions, a committee member may serve on multiple committees (including audit and risk committees).
Topic 5. Central Operational Risk Function
-
Role and Responsibilities
-
Acts as the second line of oversight.
-
Collects and aggregates information for reporting to both the Risk Committee and individual Business Line Managers.
-
-
Information Collected
-
Risk exposures, action plan statuses, controls, risk profile modifications, and information on risk events.
-
-
Reporting Goal
-
Support decision-making at all levels.
-
Present risks and their interactions in a comprehensive and holistic manner.
-
Topic 6. Business Line Managers
-
Role and Responsibilities
-
Closest level of monitoring operational risk data.
-
Focus on Key Risk Indicators (KRIs), action plan progress, and types/impacts of operational risks.
-
Tasked with monitoring their own risks and benchmarking their risks against firm-wide averages or other lines/departments.
-
-
Reporting Challenges (General)
-
Determining appropriate report size
-
Too large: Readers may miss critical information.
-
Too small/condensed: May be too aggregated to provide real value.
-
-
Escalation: Defective key controls, near misses, and high risks are typically escalated with minimal adjustments; other data is summarized.
-
Practice Questions: Q2
Q2. The internal group most likely to focus on key risk indicators (KRIs) and benchmarking is the:
A. audit committee.
B. executive committee.
C. business line committee.
D. central operational risk function.
Practice Questions: Q2 Answer
Explanation: C is correct.
Business line managers are the closest level of operational risk management, and they will focus heavily on KRIs.
Module 2. Operational Risk Reporting Components
Topic 1. Components of Operational Risk Reports
Topic 2. Operational Risk Managenment (ORM) Report
Topic 3. Prioritized Risks and Outlook
Topic 4. Heatmap and Risk Registers
Topic 5. Risk Appetite Metrics
Topic 6. KRIs and Issue Monitoring
Topic 7. Risk Events and Near Misses
Topic 8. Action Plans and Remediation
Topic 9. Emerging Risks and Horizon Scanning
Topic 1. Components of Operational Risk Reports
-
Overall Goal: Ensure actions align with risk appetite, risk acceptance, and mitigation strategies.
-
Approach: Utilizes both quantitative and qualitative measures.
-
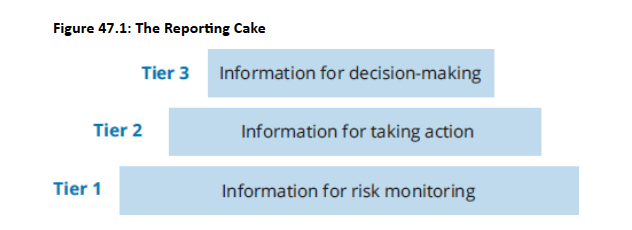
The "Reporting Cake" (Chapelle, 2015): Illustrates the volume of information reported to various stakeholders.
-
Tier 1 (Bottom): Business line managers and risk champions; full set of metrics, daily monitoring.
-
Tier 2 (Middle): Operational risk committee; information requiring action (e.g., process fixes, budget discussions, early interventions).
-
Tier 3 (Top): Executive and board risk committee; high-level data, leading indicators, performance trends, strategic plan progress, risk impacts relative to objectives.
-
Topic 2. Operational Risk Managenment (ORM) Report
-
A comprehensive internal operational risk management (ORM) report contains the following components
-
Prioritized risks and outlook,
-
Heatmap and risk register,
-
Risk appetite metrics,
-
Key risk indicators (KRIs) and issue monitoring,
-
Risk events and near misses,
-
Action plans and remediation, and
-
Emerging risks and horizon scanning.
-
Practice Questions: Q3
Q3. Using a reporting cake model, high-level data such as leading indicators and strategic plan progress will most likely be reported in which tier?
A. Tier 1.
B. Tier 2.
C. Tier 3.
D. Tier 4.
Practice Questions: Q3 Answer
Explanation: C is correct.
The top layer of the reporting cake is Tier 3, which is the information that is presented to the executive and board risk committee. The data is high level and includes information such as performance trends, leading indicators, and strategic plan progress.
Tier 1 is the bottom layer, which represents a full set of data going to business line managers and risk champions. Tier 2 is the middle layer, and information presented there goes to the operational risk committee. The data in Tier 2 is not high level, as it often requires action. There is no Tier 4 described in the reporting cake.
Topic 3. Prioritized Risks and Outlook
-
Content: A narrowed-down list, often the "top 10," presenting the most important risks from the entire risk inventory.
-
Prioritization Basis:
-
Magnitude of inherent risk (if no action is taken).
-
Level of residual risk (net impact after mitigation).
-
-
Common Top Risks: Technology breakdowns, cyberattacks, data loss, regulatory/compliance breaches, transformation projects.
-
Presentation Details for Each Risk:
-
Ranking
-
Description
-
Inherent components (likelihood, severity, rating)
-
Residual components (likelihood, severity, rating)
-
Outlook (improving, getting worse, or status quo)
-
Practice Questions: Q4
Q4. A presentation provided to executive leadership on the top 10 risks an entity is facing should include all of the following except:
A. descriptions of the risks.
B. timelines for risk eliminations.
C. inherent and residual elements of each risk.
D. a ranked order based on likelihood and severity.
Practice Questions: Q4 Answer
Explanation: B is correct.
A prioritized risk presentation will include (for each identified risk) a ranking, description, inherent components, residual components, and the outlook. Although it is unlikely that a risk can be totally eliminated, even if it could be eliminated, a timeline for it is unlikely to be presented in this structure.
Topic 4. Risk Register and Heatmap
-
Risk Register:
-
Created through Risk and Control Self-Assessment (RCSA) exercises.
-
Lists different operational risks within an entity.
-
Similar to the top 10 list but often includes controls applied to move from inherent to residual risk.
-
-
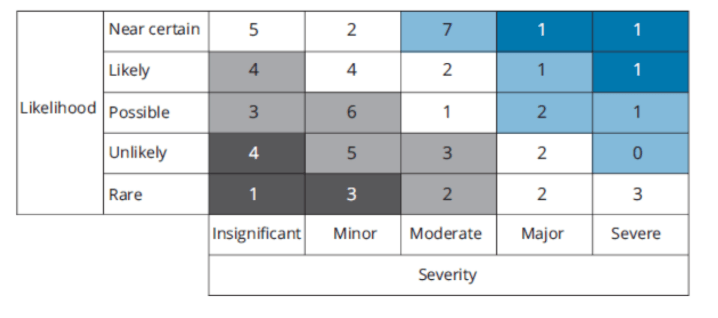
Heatmap:
-
A visual representation of the risk register.
-
More effective than lengthy narratives or data tables.
-
Typically maps likelihood against severity.
-
Color Coding
-
Red: Urgent
-
Amber: Above acceptable levels
-
Yellow: Approaching limits
-
Green: Within risk appetite
-
-
Topic 5. Risk Appetite Metrics
-
Purpose: Information presented to the board to determine if firm operations align with its risk appetite.
-
Function: Measure a firm's compliance with risk limits.
-
Standard KRI presentation template includes:
-
Type of KRI
-
Name
-
Thresholds
-
Actual values relative to thresholds
-
Overall score for each KRI
-
Topic 6. KRIs and Issue Monitoring
-
Key Risk Indicators (KRIs):
-
Used by management for forward-looking analyses and detailed analyses for specific risks.
-
Firms leverage existing collected information for efficiency.
-
KRI Dashboard: Summary presentation of key metrics, values, trends, and overall scores.
-
-
Examples of Metric Sources and Indicators:
-
Human Resources: Compliance training attendance, percentage trained, disciplinary cases.
-
Risk Control: Percentage of completed risk management action plans, timely reporting for operational incidents.
-
Audit: Timeliness of responses to audit findings, number of findings.
-
Compliance: Percentage of complaint responses within timeline, number of conflicts of interest reported.
-
-
Issue Monitoring:
-
Issues Defined: Indicators of operational problems or control system concerns that can cause incidents if not addressed.
-
Examples: Operational problems, process delays, documented IT problems.
-
Usefulness: Appear before actual incidents, making them useful as preventive KRIs.
-
Grouping: Typically grouped by business line or major project/initiative.
-
Topic 7. Risk Events and Near Misses
-
Risk Event Reporting: Fundamental to ORM reporting.
-
Specific narratives for larger incidents exceeding materiality thresholds.
-
Includes details on events (number, size), frequency, severity (per period), and trends over time.
-
-
Reporting Thresholds: Vary by entity (e.g., focus on large losses vs. all events).
-
Events tied to regulatory impacts or reputational damage are typically always collected.
-
-
Near Misses: Critical to report and evaluate based on the materiality of potential impact avoided.
-
Provide tremendously valuable "lessons learned" without actual losses.
-
Reporting thresholds for both actual events and near misses should ideally be based on potential impact.
-
Topic 8. Action Plans and Remediation
-
Action Plan Purpose: Designed to improve the control environment through risk mitigation programs.
-
Types of Plans:
-
Corrective Plans: Reactionary, often stemming from large incidents or unexpected gaps/weaknesses in ORM systems.
-
Detective Controls: Designed to identify potential incidents before they become loss events.
-
Preventive Action Plans: Proactively manage risks before they become major problems.
-
-
Responsibilities:
-
Business line owners track and report action plans, implement controls, and provide progress updates.
-
-
Goal: Achieve a "zero objective" (no overdue action plans, no overdue audit recommendations).
-
Reporting: "Discipline indicators" (overdue metrics) are reported along with current metrics to leadership.
Topic 9. Emerging Risks and Horizon Scanning
-
Horizon Scanning:
-
Used to identify emerging risks and new trends.
-
Reported monthly or quarterly to the board risk committee.
-
Primarily focused on the regulatory and compliance environment.
-
Looks for emerging risks and volatility changes.
-
Risk Timeline Categories:
-
Risks expected to arise within one year.
-
Risks expected to arise within one to three years.
-
Risks expected to arise beyond three years.
-
-
-
Risk Software: Governance, Risk, and Compliance (GRC) Systems
-
Software applications that assist organizations in collecting and reporting operational risk data.
-
Vary in cost and complexity.
-
Core Functions:
-
Collect and collate risk data.
-
Link risks with internal controls.
-
Generate automated reports for use throughout the organization.
-
-
Module 3. Operational Risk Reporting Challenges
Topic 1. Cost-Benefit Relationship
Topic 2. Operational Risk Event Data Asymmetry
Topic 3. Large Risk Event Escalation
Topic 4. Small, Frequent Losses
Topic 5. Operational Loss Benchmarking
Topic 6. Operational Risk Distributions
Topic 7. Concentrations, Outliers, and Scenarios
Topic 8. Qualitative Risk Data Aggregation
Topic 9. Combined Assurance
Topic 1. Cost-Benefit Relationship
- Cost-Benefit Evaluation: Must assess cost-benefit relationship when determining operational risk data collection, monitoring frequency, and reporting levels
- Information Value: Cost of collecting information must be less than the value that information provides to the organization
- Strategic Alignment: Information should be useful with content aligned to entity objectives and priorities for maximum effectiveness
- Decision Influence: Reporting should influence decision-making processes, even if the ultimate decision is to make no changes to current practices
- Additional Challenges: Beyond cost-benefit considerations, several other challenges exist related to operational risk reporting implementation and effectiveness
Topic 2. Operational Risk Event Data Asymmetry
-
Nature of Operational Losses
-
Tend to be heavily skewed away from the mean.
-
Small number of high-severity, but low-frequency events.
-
High-frequency, low-severity events typically have minimal impact on the loss budget.
-
-
Resource Allocation Implication
-
Resources devoted to risk management should focus on mitigating and preventing large incidents.
-
Less emphasis on remedying visible but insignificant events.
-
Practice Questions: Q5
Q5. Operational risk distributions do not lend themselves to using averages (i.e., mean values) for all of the following reasons except:
A. the distribution is asymmetric.
B. the data may have significant variances.
C. there may be a large quantity of outliers.
D. there is minimal skewness in either the right or left tail.
Practice Questions: Q5 Answer
Explanation: D is correct.
Operational risk distributions often have significant skewness in the tails, which does not lend itself to using averages. An average has more meaning in symmetric, bell curve–type distributions with minimal outliers, no skewness, minimal variance, and a single mode.
Topic 3. Large Risk Event Escalation
-
Management Review and Action
- Upper management must review and act on large risk events
- Includes near misses significant enough to exceed the organization's risk tolerance.
-
Required Actions:
-
Root-cause analyses.
-
Detailed reporting.
-
Action plans.
-
Topic 4. Small, Frequent Losses
-
Prevalence: Most operational risk incidents reported are small but frequent losses.
-
Impact: While they may not significantly impact the budget, they require regular analysis.
-
Purpose of Analysis:
-
Determine if structural flaws or control breaches exist that merit action.
-
Distinguish from random and relatively insignificant losses, which are less concerning.
-
Topic 5. Operational Loss Benchmarking
-
Purpose: Helps management decide on capital allocations and operational risk budgets.
-
Common Benchmarks:
-
Regulatory capital (e.g., basis points of capital consumed).
-
Gross income.
-
-
Comparison Across Entities:
-
Reporting losses in basis points of capital or as a percentage of total project budget, cost center budget, or gross income.
-
Percentage reporting facilitates comparison of entities of different sizes.
-
Topic 6. Operational Risk Distributions
-
Challenge with Averages (Mean Values)
-
Operational risk distributions do not follow symmetric, bell-curve patterns.
-
They exhibit skewness, outliers, and significant variance, making averages misleading.
-
-
Value of Outliers
-
The real value of Operational Risk Management (ORM) comes from identifying and understanding outliers (departures from the norm).
-
Averages hide diversity in data.
-
-
Superior Approach for Describing Distributions
-
Using the median (midpoint) and first and third quartiles.
-
Applies to operational losses, risk assessments, ratings, Key Performance Indicators (KPIs), and KRIs.
-
Practice Questions: Q6
Q6. For the second line of defense in a combined assurance approach, the central operational risk function will perform which of the following activities?
A. Internal audit reviews.
B. Deep dives into specific types of risks.
C. Overall assessments of risks and controls.
D. Oversight of the activities performed by the third line.
Practice Questions: Q6 Answer
Explanation: B is correct.
Deep dives into specific types of risk is a function of the second line of defense (the central operational risk function). The second line also oversees the activities performed by the first line, not the third line. The overall assessments of risks and controls are performed by the first line, and internal audit reviews are performed by the third line.
Topic 7. Concentrations, Outliers, and Scenarios
-
Informational Value of Outliers:
-
Hold tremendous informational value in risk management.
-
Past patterns, distribution concentrations, and distances between observations merit significant analysis.
-
-
Normality Baseline: Can be established through trend analysis across multiple cycles.
-
Data Analytics Adaptability:
-
Analytics must adapt to the features and nature of the data.
-
Data with different underlying functions and distributions should not be presented identically.
-
-
Learning from Positive Outliers:
-
While most reporting focuses on problems and large losses, lessons can also be learned from positive outliers and good performance.
-
-
Loss Profile Analysis:
-
Needs to be analyzed through the assessment of high-, medium-, and low-risk scenarios.
-
Example: Climate change and weather-related impacts increasingly require significant scenario modeling.
-
Topic 8. Qualitative Risk Data Aggregation
-
Challenge: Qualitative risk data must be aggregated but its presentation (e.g., color ratings, risk scores) makes quantification difficult.
-
Example: Extreme (Level 1) and low (Level 3) risks do not average to a moderate (Level 2) risk.
-
-
Options for Aggregating Qualitative Data:
-
Conversion and Addition:
-
Convert qualitative metrics into a continuous, additive, and linear monetary unit.
-
Non-financial elements (continuity, reputation) converted to financial amounts and summed.
-
Increases executive-level awareness by presenting risks in monetary terms.
-
-
Categorization:
-
Use color and score (e.g., red, yellow, green for high, moderate, low risks).
-
Graphical formats (e.g., bar charts) can visually represent concern (longer red area = greater concern).
-
-
Worst-Case Reporting:
-
Most conservative approach.
-
If even one KRI in a group is "red," the entire group is reported as red in aggregate.
-
Helpful when risk tolerance is low, but can create undue concern.
-
-
Topic 9. Combined Assurance
-
Goal: Align assurance processes among all providers (including internal audit).
-
Purpose: Inform senior management and the audit committee about governance, controls, and risk management.
-
Requirements:
-
Significant coordination and collaboration among the three lines of defense.
-
Emphasis on ownership, accountability, and avoiding duplication.
-
-
Combined Assurance Map:
-
Owned by the ORM function.
-
Used to report risk oversight results to appropriate committees.
-
Identifies risk types and assessment scopes.
-
Uses color coding (green: satisfactory, yellow: needing attention, red: unsatisfactory) for each line of defense's assessment.
-
-
Reviews Conducted by the Three Lines of Defense:
-
First Line: Assessment of risks and controls, controls testing, attestation of functioning risk management/control activities.
-
Second Line: Oversight of first-line, sample control testing, deeper dives into specific risk types.
-
Third Line: Periodic internal audit reviews in line with the audit cycle.
-
Module 4. External Reporting Best Practices
Topic 1. Best Practices for Reporting Risk Exposures
Topic 2. Qualitative Information
Topic 3. Historical Losses
Topic 4. Absence of Evidence is Evidence of Absence
Topic 1. Best practices for Reporting Risk Exposures
-
Foundation: The Basel regulatory framework (Pillar 3) addresses public disclosure of financial and operational risk information.
-
Regulatory Requirements: Banks must calculate operational risk capital using information compliant with the standardized approach.
-
Internal Loss Multiplier (ILM): Requires 10 years of internal loss events.
-
Business Indicator Component (BIC): Requires data from the last three years.
-
-
Three Types of Operational Risk Disclosure Requirements:
-
Qualitative Information
-
Historical Losses
-
Business Indicator and Subcomponents
-
Topic 2. Qualitative Information
-
Presentation of risk management and governance arrangements established by the entity.
-
How the entity manages, mitigates, and/or transfers its operational risks.
-
Information on the structure of their Operational Risk Management (ORM) and control functions.
-
Policies, procedures, and guidelines related to operational risk.
-
Details on data and systems used to measure operational risk.
Topic 3. Historical Losses
-
Requirement:
-
10 years of aggregate operational losses must be reported.
-
Inclusion of operational risk capital calculations.
-
-
Best Practices:
-
Regulated entities and banks should provide qualitative narratives.
-
Include material information alongside the quantitative data.
-
Crucially, protect proprietary and confidential information.
-
Practice Questions: Q7
Q7. To meet operational risk disclosure requirements, the number of years of historical aggregate operational losses that must be disclosed is closest to:
A. 3 years.
B. 5 years.
C. 10 years.
D. 15 years.
Practice Questions: Q7 Answer
Explanation: C is correct.
The requirement to report aggregate operational loss data is 10 years.
Topic 4. Absence of Evidence is Evidence of Absence
- Documentation Imperative: "Absence of evidence is evidence of absence" - auditors and regulators require documented proof over verbal assertions, with committee meeting minutes serving as appropriate evidence
- Mandatory Breach Reporting: Financial institutions must inform regulators of conduct breaches and significant operational events based on four criteria: reputation impact, resilience/customer harm, materiality thresholds, and financial stability threats
- Regulatory Transparency: Best policy involves full transparency with regulators despite inherent conflict between compliance requirements and negative disclosure effects of operational failures
- Annual Report Balance: Firm reports should include operational risk reporting alongside financial risk, balancing transparency/honesty with avoiding excessive stakeholder concern through competent risk addressing
- Upcoming Alignment: Operational resilience and risk reporting will align to meet regulatory/market expectations, with UK firms having until March 2025 to establish mapping/testing processes for impact tolerance compliance
Practice Questions: Q8
Q7. Significant operational risk event triggers can be categorized under all of the following criteria except:
A. stability.
B. materiality.
C. functional.
D. reputation.
Practice Questions: Q8 Answer
Explanation: C is correct.
The four criteria are reputation, resilience, materiality, and stability. There is no category in this context called functional.