Book 1. Market Risk
FRM Part 2
MR 7. VaR Backtesting Using Exceedance-Based Approach and Probability Integral Transform
Presented by: Sudhanshu
Module 1. Exceedance-Based Approach
Module 2. Probability Integral Transforms
Module 1. Exceedance-Based Approach
Topic 1. Properties of an Exceedance-based Backtest
Topic 2. Unconditional Coverage
Topic 3. Independence
Topic 4. Conditional Coverage

Topic 1. Properties of an Exceedance-based Backtest
-
Definition: The most prevalent backtesting framework is the exceedance-based backtest, which counts the number of times actual losses exceed the VaR threshold.
-
Expected Exceedances: For a 95% VaR, we would expect it to be exceeded 5% of the time. This means, out of 100 observations, we would expect five exceedances.
-
Important Note: Having more or less than the expected number of exceedances does not automatically mean the model should be rejected.
-
Independence: The probability of an exceedance on any given day should be independent of the probability of an exceedance on any other day.
-
The three main properties in exceedance-based backtesting are as follows:
-
Unconditional Coverage: This property determines if the model is properly calibrated to estimate the probability of VaR exceedance across the entire observation set.
-
Independence: This property evaluates if the probability of an exceedance on any given day is related to the probability of an exceedance on another day.
-
Conditional Coverage: This property determines if the model jointly satisfies both unconditional coverage and independence.
-
Topic 2. Unconditional Coverage
-
The unconditional coverage property follows the Kupiec approach where we are not worried about the independence or timing of exceedances and are interested only in the total number of exceedances.
- Too few exceedances: implies that VaR overestimates risk (too conservative) and too many exceedances: VaR underestimates risk (inadequate)
-
Suppose there are x exceedances over n observations. If the probability of an excession is p(x), then we can compute this probability as follows
-
For example, if there are 100 observations and the VaR model expects the probability of excession to be 5%, then the actual probability of finding three exceedances is equal to:
- A Likelihood plot of 100 observations with known 5% exceedance probability indicates that the peak occurs at 5 exceedances (5% of 100), as expected

Topic 2. Unconditional Coverage
-
To validate a VaR model based on the number of exceedances, hypothesis testing is conducted.
-
Test Statistic: The test statistic is a log-likelihood ratio (LR).
-
Critical Value: The critical value is obtained from a chi-squared distribution with one degree of freedom; for a 95% confidence level, it is 3.84.
-
The log-likelihood ratio for unconditional coverage is computed as follows:
-
-
-
Kupiec's concluded that for a 95% VaR model with 252 observations (one year), the acceptable range is 6-20 exceedances around the expected 12.6 (5% × 252).
-
Models with ≤6 exceedances overestimate risk (too conservative), while ≥20 exceedances indicate underestimation of potential losses.
Practice Questions: Q1
Q1. Which of the following characteristics must a VaR model satisfy to ensure it passes the unconditional coverage test?
A. Exceedances must occur in clusters.
B. Exceedances must be independent of prior exceedances.
C. Exceedances must follow a uniform distribution over [0,1].
D. The total number of exceedances must match the expected frequency within a confidence level.
Practice Questions: Q1 Answer
Explanation: D is correct.
The unconditional coverage test ensures that the number of exceedances aligns with the model’s expected exceedance frequency, such as 5% for a 95% VaR model.
Topic 3. Independence
-
It is important to understand if exceedances are independent or if clustering is occurring.
-
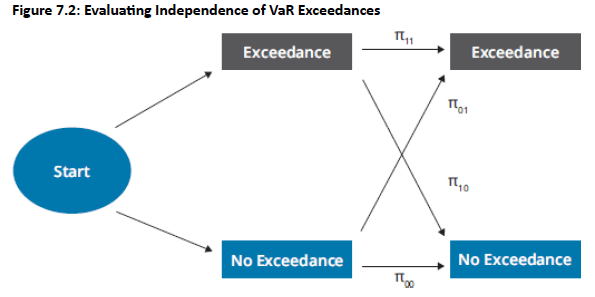
Markov Chain Analysis: Independence is analyzed by considering the process of exceedances as a Markov chain. This involves examining random variables moving between states based on defined probabilities, where the next event's probability depends on the previous state.
-
Consider the below fig across 2 observations, having 4 possibilities: {Exceedance, Exceedance}, {Exceedance, No Exceedance}, {No Exceedance, Exceedance}, and {No Exceedance, No Exceedance}.
-
π01: probability of no exceedance in Observation 1 but an exceedance in Observation 2.
-
Null Hypothesis: The null hypothesis for independence is H0 :π01=π11, meaning the probability of an exceedance on any given day is independent of the prior day's exceedance.
-
Test Statistic: The test statistic for independence (LRind) also follows a chi-squared distribution with one degree of freedom.
Topic 4. Conditional Coverage
-
Combined Test: Conditional coverage combines the unconditional coverage and independence properties.
-
Joint Null Hypothesis: The null hypothesis for conditional coverage is H0: π01 =π11=p, which asks if the model correctly predicts the rate of exceedances and if those exceedances are independent.
-
Combined Test Statistic: The combined test statistic is calculated as:
-
LRcc=LRuc+LRind.
-
-
Distribution: Both individual components and their sum are chi-squared distributed.
-
Rejection Criteria: At a 95% confidence level, the model is rejected if LRcc>5.99. Rejection of the independence term alone occurs if LRind>3.84.
-
Model Adjustment: If serial dependence in exceedances is found, the VaR model needs adjustment for observed correlations.
Practice Questions: Q2
Q2. What does it mean when exceedance-based backtest analysis on VaR models suggests that the model has conditional coverage at a given confidence level?
A. The model performs well only on a subset of positions.
B. The model requires specific distribution assumptions to adequately deliver results.
C. The model cannot be rejected on the basis of observed exceedances, nor can it be rejected for potential lack of independence.
D. The suggested rate of exceedance incidents cannot be rejected; however, there is serial correlation among the exceedance observations.
Practice Questions: Q2 Answer
Explanation: C is correct.
Conditional coverage means we are testing both the exceedance rate as well as the independence of exceedances.
Module 2. Probability Integral Transforms
Topic 1. Probability Integral Transforms: Overview
Topic 2. Probability Integral Transforms: Illustration
Topic 3. Distribution of PITs
Topic 4. Evaluating PIT Distributions
Topic 5. Kolmogorov-Smirnov Test
Topic 6. Anderson-darling Test
Topic 7. Cramer-von Mises Test
Topic 8. Independence of PIT Values
Topic 1. Probability Integral Transforms: Overview
-
Beyond Exceedance-Based: PITs move beyond simple exceedance counting by analyzing how well the VaR model predicts the entire distribution of outcomes, not just the tail cutoff.
-
Addressing Dynamic Distributions: Financial portfolios have dynamic distributions of outcomes due to changing risk factors (e.g., market volatility) or asset allocation. The PIT approach allows daily profit and loss (P&L) observations to be compared on the same platform.
-
Derivation Steps:
-
Forecast Distribution: Obtain a forecast of the distribution for a given period (e.g., P&L normally distributed with mean $0 and standard deviation $500).
-
Collect Observation: Collect the actual observation for that period (e.g., actual P&L was -$250).
-
Convert to Uniform: Convert the observation into an "equivalent" one from a uniform distribution by finding its location on the cumulative distribution function (CDF). This value is the PIT. For example, –$250 is –0.5 standard deviations away from the mean, which suggests that 30.8% of the cumulative distribution is at or below this level. This is equivalent to computing 0.308 from a uniform distribution over the interval [0,1]. In this example, 0.308 is the PIT value for this observation.
-
Analyze PIT Distribution: Analyze the distribution of the PITs for uniformity, independence, and conditional coverage, similar to the exceedance-based approach.
-
Topic 2. Probability Integral Transforms: Illustration
-
PIT values come from a risk model's forecasted distribution.
-
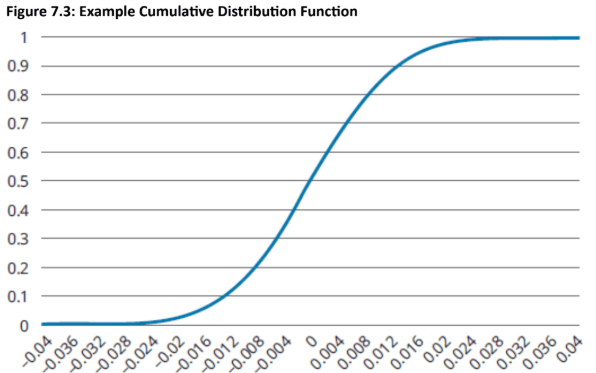
For example, in Figure 7.3's cumulative distribution: 25% of observations fall below ~-0.007, 50% below 0, and 75% below ~+0.007. While this example shows symmetry, the backtesting approach works with any distribution shape.
-
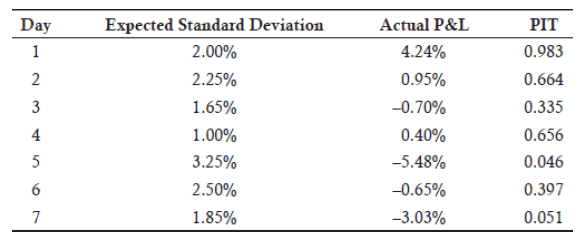
The forecasted distribution predicts Day 1 portfolio price changes. The actual Day 1 P&L (+0.005 or 0.50%) is compared to the CDF to find its percentile position—in this case, the 69.1% mark. Day 2 generates a new forecast distribution and observation, producing another PIT value. This process continues daily.
-
For illustration, assume normal distributions with zero mean and varying standard deviations across time. An example time series is shown in below figure.
-
Determining these values for each day will generate a distribution of PITs that can be used in the backtesting process.
Practice Questions: Q1
Q1. Which of the following statements correctly describes the purpose of probability integral transform (PIT) values for backtesting VaR models? PIT values:
A. are used to determine the total number of exceedances for a VaR model.
B. measure the conditional coverage property of exceedance-based models.
C. analyze exceedance independence by forming a Markov chain of observations.
D. convert observed data points into a uniform distribution for the enre forecasted distribution.
Practice Questions: Q1 Answer
Explanation: D is correct.
PIT values transform observed outcomes into a uniform distribution over [0,1], enabling the validation of the entire forecasted distribution rather than just tail events.
Topic 3. Distribution of PITs
-
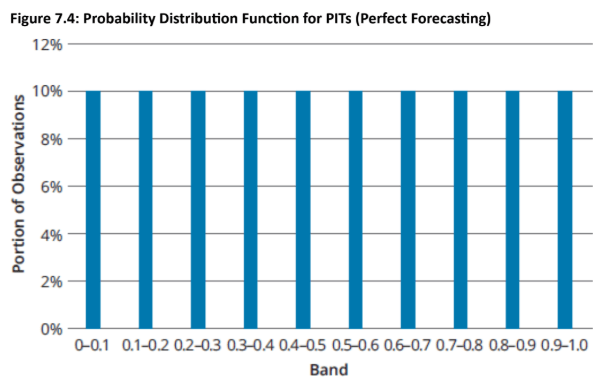
Perfect Forecasting (Ideal Outcome): If the next period's P&L distribution can be forecasted with complete accuracy, a large number of PITs should result in a uniform distribution between 0 and 1, with independence among observations.
-
Uniformity Implication: This means that 10% of PITs would fall within each decile (e.g., between 0 and 0.10).
-
Generalization of Exceedance-Based: This is a generalization of the exceedance-based approach, where for a 95% VaR, we expect 5% exceedances and 95% below the cutoff. PIT-based backtesting views the distribution more broadly.
-
-
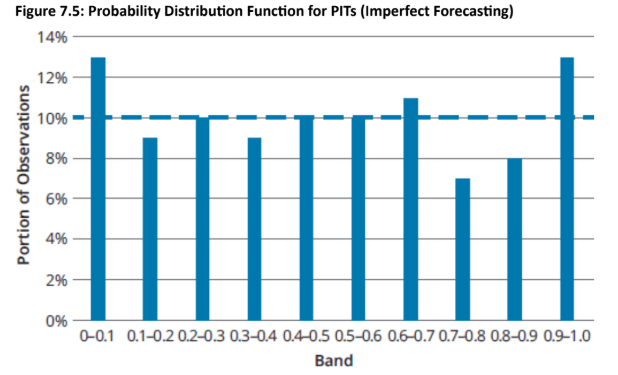
Imperfect Model: An imperfect VaR model will show a PIT distribution that deviates from uniformity, indicating that forecasted distributions underestimate or overestimate losses/gains in different areas.
-
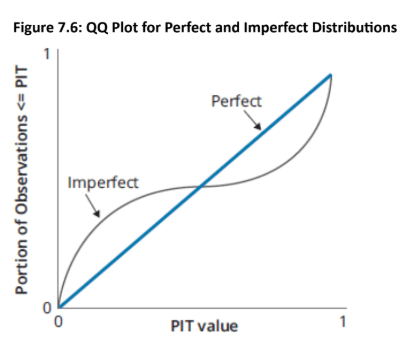
Quantile-Quantile (QQ) Plot: It is often more useful to construct a QQ plot, which contrasts two probability distributions.
-
Interpretation: The QQ plot for PITs plots the portion of PITs less than or equal to each value (0 to 1) against a "perfect" distribution, which would be a straight line.
Topic 3. Distribution of PITs
Practice Questions: Q2
Q2. Ideally, when backtesting VaR models, a QQ plot of probability integral transforms (PITs) should be close to a(n):
A. horizontal line.
B. inverted parabola.
C. straight line from [0,0] to [1,1].
D. uniformly distributed scatterplot.
Practice Questions: Q2 Answer
Explanation: C is correct.
A QQ plot for a group of PITs should be close to a straight line from the origin to [1,1]. The closer the set of PITs is to that straight line, the more conidence we can have that the VaR model is achieving its goal of forecasting the distribution of outcomes each period.
Topic 4. Evaluating PIT Distributions - Goodness-of-Fit Tests
-
Purpose: Goodness-of-fit tests evaluate how the theoretical uniform distribution of PITs differs from the actual distribution. They use QQ plots to compare the actual cumulative distributions to the theoretical true uniform [0,1] distribution.
-
Common Tests:
-
Kolmogorov-Smirnov (KS) test
-
Anderson-Darling (A-D) test
-
Cramér-von Mises (CVM) test
-
Topic 5. Kolmogorov-Smirnov Test
-
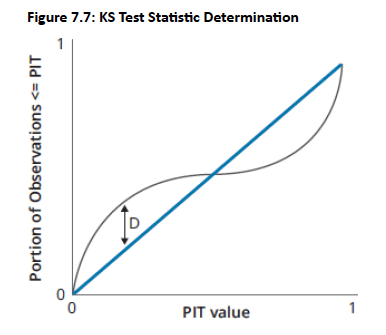
Mechanism: The KS test examines the QQ plot and calculates the maximum vertical distance (D) between the theoretical uniform distribution and the actual PIT distribution.
-
D=maxj∣zj−Aj∣
-
Where zj is the theoretical (perfect) distribution and Aj is the actual CDF distribution.
-
-
Interpretation: A lower KS test statistic indicates a better fit. For perfect forecasting with many observations, D is expected to converge to zero.
-
Statistical Test: The computed test statistic is compared against the Kolmogorov distribution.
Topic 6. Anderson-Darling Test
-
Addressing KS Criticism: A common criticism of the KS test is that it treats all discrepancies equally, while in risk management, tail behavior is more critical.
-
Tail Emphasis: The Anderson-Darling (A-D) test places higher emphasis on tail observations, making it more suitable for risk managers.
-
Test Statistic: The A-D test statistic is defined as:
-
Interpretation: This test statistic also converges to zero for perfect distribution forecasts.
Practice Questions: Q3
Q3. Which of the following goodness-of-fit tests used to evaluate the distribution of probability integral transforms (PITs) best captures tail events?
A. Anderson-Darling test.
B. Cramér-von Mises test.
C. Kolmogorov-Smirnov test.
D. Tests of independence for PIT values.
Practice Questions: Q3 Answer
Explanation: A is correct.
The Anderson-Darling (A-D) test is designed to be more sensitive to how well PITs fit the tail of the distribution.
Topic 7. Cramér-von Mises Test
- Similarity to KS: The Cramér-von Mises (CVM) test is similar to the KS test.
-
Difference: Instead of evaluating the maximum difference between distributions, the CVM test considers the mean squared deviation.
-
Test Statistic: The CVM test statistic is defined as:
Topic 8. Independence of PIT Values
-
Berkowitz's Approach: Berkowitz (2001) describes an approach to evaluate independence through PIT values. Berkowitz noted that it might be easier to conduct independence tests outside of the range of a uniform distribution.
-
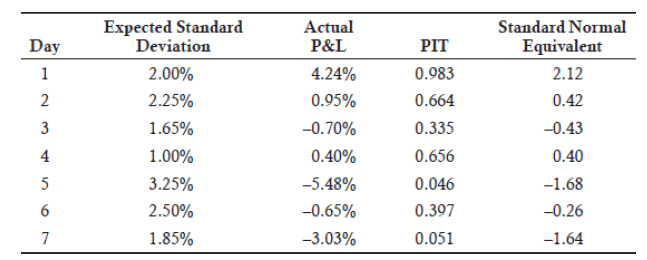
Transformation: For independence testing, PITs are transformed into standard normal variables. This avoids bounding support issues. The ordered distribution for dependencies can then be evaluated.
-
Similar to our earlier example of determining PITs, we add a column for the equivalent standard normal values as shown in below figure.
-
Analysis: The transformed series can then be analyzed for independence across observations using well-known log-likelihood functions.
-
Visual Check: Conditional coverage can be visually checked by viewing scatterplots of PITs versus lagged PITs. Ideally, there should be no clustering and a uniform distribution across all subportfolios.