Book 4. Liquidity and Treasury Risk
FRM Part 2
LTR 10. Liquidity Stress Testing and Risk Reporting
Presented by: Sudhanshu
Module 1. Liquidity Risk Reports
Module 2. Liquidity Stress Tests
Module 1. Liquidity Risk Reports

Topic 1. Best Practices in Liquidity Reporting
Topic 2. Interpreting Liquidity Risk Reports
Topic 3. Deposit Tracker Report
Topic 4. Daily Liquidity Report
Topic 5. Funding Maturity Gap (Mismatch Report)
Topic 6. Cash Flow Survival Report
Topic 7. Funding Concentration Report
Topic 8. Undrawn Commitment Report
Topic 9. Liability Profile
Topic 10. Wholesale Pricing and Volume
Topic 11. Summary Liquidity Report MI
Topic 1. Best Practices in Liquidity Reporting
-
Liquidity Risk Reports
-
The management information (MI) liquidity reporting process is mandated by regulatory authorities who determine the frequency and content of the reports.
-
The Asset-Liability Committee (ALCO) is the bank's leadership team responsible for overseeing liquidity risk.
-
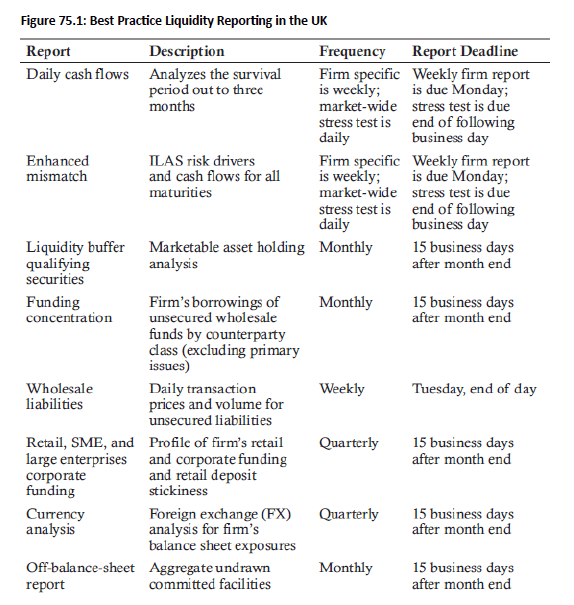
- Best practices in UK: The best practices for liquidity reporting, as set by the UK's Financial Services Authority (FSA), include specific reports and frequencies. Other countries have similar requirements.
-
The following reports and frequency are required by the FSA:
- Daily reports: daily cash flows and mismatch for market-wide stress tests.
- Weekly reports: daily cash flows and enhanced mismatch (a.k.a.maturity gap) for firm-specific tests and the wholesale liability.
- Monthly reports: liquidity buffer, funding concentration, and off balance sheet.
- Quarterly reports: funding and currency analysis.
Topic 1. Best Practices in Liquidity Reporting
-
Best Practices for nonmaturity and off-balance-sheet Items
-
Nonmaturity Items:
-
Regulators typically treat callable and demand deposits as having a one-day tenor.
-
Regulators may permit behavioral adjustments for stable retail deposits (e.g., up to 50% treated as longer maturity), but they are generally assumed to be payable within one day.
-
-
-
Off-Balance-Sheet Items:
-
Derivatives are generally not included in liquidity ratio calculations, with the exception of coupons receivable or payable on their pay dates.
-
Undrawn commitment exposure is included as a cash outflow and is part of liquidity ratio calculations.
-
-
Banks Models: In practice, banks do not always follow exactly the suggestions of the FSA.
-
Bank models commonly apply the following guidelines with respect to off-balance-sheet items.
-
Derivatives are included to the amount that collateral is payable or receivable under an ISDA master agreement or credit support annex (CSA), in addition to including coupons on the pay date as recommended by FSA.
-
Undrawn commitments are included in liquidity ratio calculations as a cash outflow.
-
-
Topic 1. Best Practices in Liquidity Reporting
Practice Questions: Q1
Q1. The treatment of tenor for certain types of cash flows for liquidity reporting is a concern for senior managers preparing reports for the Financial Services Authority (FSA) in the United Kingdom (UK). Based on recommendations of the FSA, what should be the treatment in liquidity reports for callable or demand deposits that have no maturity date?
A. 1 day.
B. 1 week.
C. 1 month.
D. 1 year.
Practice Questions: Q1 Answer
Explanation: A is correct.
The FSA in the UK recommends that callable and demand deposits are treated as 1-day tenor by regulators.
Topic 2. Interpreting Liquidity Risk Reports
-
Benchmark liquidity reporting: The sample reports illustrate standard liquidity reports used by regulated banks in the UK, with similar regulatory requirements applied in other countries.
-
Reporting frequency and content: Liquidity reports are produced daily, weekly, monthly, and quarterly, and include both quantitative metrics and qualitative assessments.
-
Key reports include
-
Deposit tracker report
-
Daily liquidity report
-
Funding maturity gap (mismatch) report
-
Funding concentration report
-
Undrawn commitment report
-
Liability profile
-
Wholesale pricing and volume
-
Topic 3. Deposit Tracker Report
-
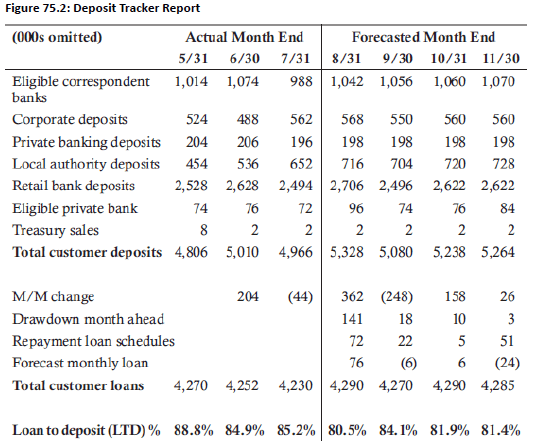
Purpose of the deposit tracker report: Summarizes current and forecasted deposit balances to support liquidity monitoring and planning.
-
Frequency and usage: Produced weekly and monthly and used to compute the immediate-term loans-to-deposits (LTD) ratio, a key liquidity metric reported by bank management.
-
Content breakdown: Shows month-end actual and forecasted customer deposits by deposit type, along with historical and forecasted total customer loans/assets.
-
LTD calculation: The LTD ratio is calculated using total customer loans divided by total customer deposits.
-
Example: Based on last row, if LTD limit is 85%, the management has exceeded this limit in two out of last three months. However, the forecasted months are projected to be within the LTD limit.
Topic 3. Deposit Tracker Report
-
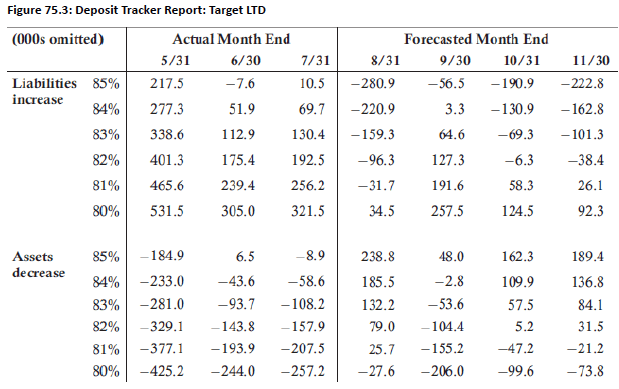
A second typical section included in the deposit tracker report is shown in Fig. 75.3.
-
The first column provides target LTD ratios set by the board.
-
The top half show how much liabilities would need to increase with all other assets held equal, to meet the target LTD ratio.
-
The bottom half shows the decrease in assets necessary to meet the target LTD ratio, holding liabilities constant.
-
Example: Based on the historical and forecasted information provided in Fig 75.3, how much would assets need to increase or decrease in November (the final column), all other things held equal, for the bank to meet the LTD ratio of 85%?
-
Solution: All other things held equal, assets (i.e., loans) would need to increase of 189,400 to meet an 85% LTD ratio in November.
Topic 3. Deposit Tracker Report
-
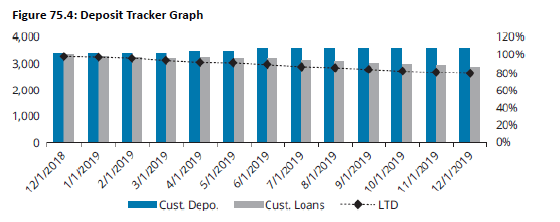
Fig. 75.4 illustrates a deposit tracker report in a bar and line graph for another bank.
-
The bars represent the cash inflows and outflows of customer deposits and loans, respectively quantified by the y-axis on the left-hand side. The line graph is the LTD ratio based with the scale shown on the right-hand side for the y-axis.
-
Actual results are displayed up to July 2019 with the remainingmonths reflecting forecasted values.
-
Assuming the bank board has a target LTD ratio of 85%, the bank’s liquidity positionexceeds the LTD ratio for the first half of 2019, but the forecasted trend is positive as the LTD is projected to reach 80% by December 2019.
-
Example: Based on the historical and forecasted information provided in Fig 75.3, is the liquidity gap between customer deposits and customer loans improving or getting worse over the year 2019?
-
Solution: The bank is improving its gap between customer deposits and customer loans as customer deposits are increasing while customer loans are decreasing. This is improving the liquidity position of the bank as it is projected to have an LTD ratio of approximately 80% by the end of 2019.
Topic 3. Deposit Tracker Report
-
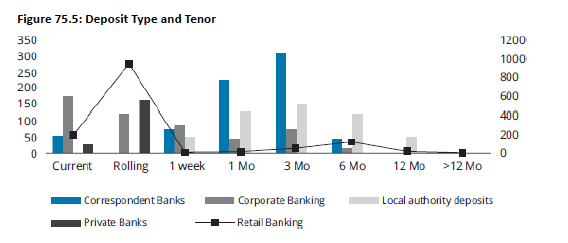
Fig 75.5 shows the daily liquidity report which breaks down the customer deposits by type and maturity (tenor). The graph shows the retail banking division deposits as a line graph with the scale represented on the righthand side of the graph. The other four divisions are shown as bar graphs with the scale on the left-hand y-axis of the graph.
-
Example: Based on the information in Fig 75.5, where do the largest percentage of deposits lie for private banking, corresponding bank deposits and local authority deposits? What actions should management take to improve the liquidity position?
-
Solution: From Fig 75.5, the retail banking division for this bank has a large percentage of the deposits in current and rolling accounts. Whereas, the corresponding bank deposits and local authority have a greater percentage of their deposits in fixed-term deposits. Regulators will not allow the short-term private banking liabilities to be treated as liquid funds. Bank managers should explore ways to have private banking customers move their deposits into longer-term fixed accounts to improve the bank’s liquidity metrics.
Topic 4. Daily Liquidity Report
-
Purpose of the daily liquidity report: The bank’s balance sheet is used to produce a daily liquidity report summarizing liquid assets, liabilities by maturity, and the cumulative liquidity position.
-
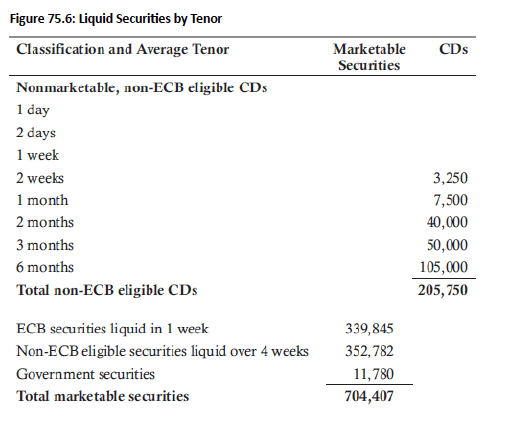
Content of the report: The report lists liquid securities, including nonmarketable CDs by tenor and marketable assets by maturity.
-
Asset classification: Liquid assets are broken down by eligibility and tenor, such as central bank–eligible securities, noneligible bank securities, and government securities.
Topic 4. Daily Liquidity Report
-
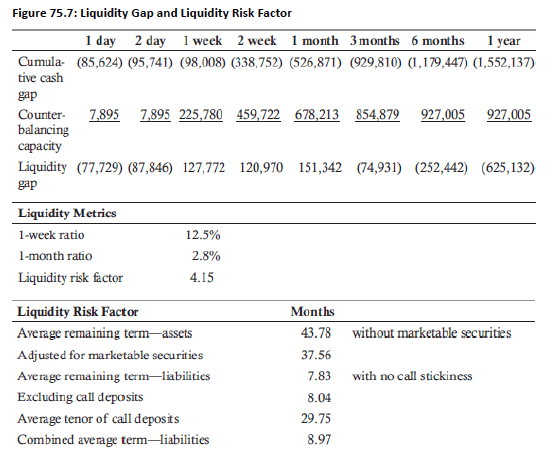
Scope of the daily liquidity report: In addition to tenor-wise assets and liabilities, the report summarizes the cumulative cash gap, counterbalancing capacity, liquidity gap, and liquidity risk factor.
-
Balance sheet linkage: Balance sheet data is used to calculate the liquidity gap and the liquidity risk factor included in the daily report.
-
Counterbalancing capacity: This represents the total value of securities available for liquidation to meet sudden cash outflows.
-
Liquidity gap calculation: The liquidity gap is computed as the cumulative cash gap (cash inflows minus cash outflows) minus the counterbalancing capacity.
Topic 5. Funding Maturity Gap (Mismatch) Report
-
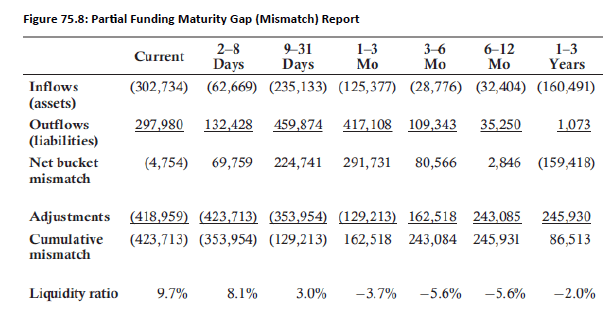
Purpose of the report: The funding maturity gap (mismatch) report shows timing mismatches between asset and liability cash flows across different maturity buckets.
-
Cash flow aggregation: It summarizes cumulative liquidity cash flows, similar to a liquidity gap report, by time bucket.
-
Mismatch interpretation: Because asset and liability cash flows do not fully offset within each bucket, net inflows and outflows arise.
-
Adjustment for liquidity: Net cash flows are adjusted for liquid securities to compute the cumulative liquidity mismatch over time.
Topic 6. Cash Flow Survival Report
-
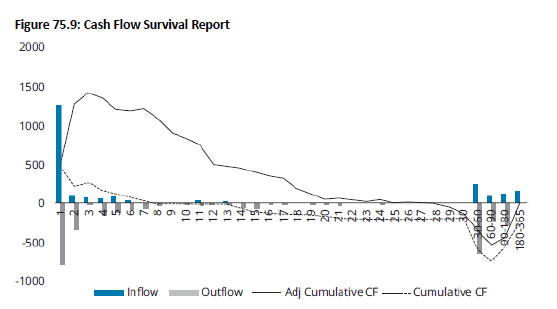
Construction of the report: Information from the maturity mismatch report is used to construct the cash flow survival report.
-
Regulatory focus: The cash flow survival report assesses the bank’s ability to meet the Basel III requirement of a 30-day survival horizon.
-
Scenario representation: The dashed line shows cash flow survival under normal conditions, while the solid line reflects survival after incorporating marketable securities and other adjustments.
-
Example: Based on the cash survival report in Fig 75.9, the bank does not meet the requirements and has only 8 days of cumulative cash flows under normal conditions and only 27 days after adjustments are made to the cumulative cash flows.
Practice Questions: Q2
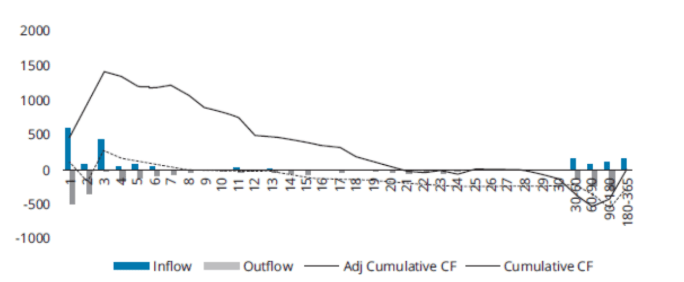
Q2. The management of a large national bank creates several reports to track progress in meeting Basel III requirements. The following graph is a cash flow survival horizon that was generated from the maturity gap report. Based on this report, which of the following statements best describes the banks progress in meeting Basel III?
A. The bank satisfies Basel III requirements because, after adjustments, cash flow does not fall below $-1,000$, indicating that the survival horizon is met.
B. The bank does not satisfy Basel III requirements because, after adjustments, cash flow falls below -500 , indicating that the survival horizon is not met.
C. The bank satisfies Basel III because cumulative cash flows before adjustments are near zero for a horizon of 60 days.
D. The bank does not satisfy Basel III requirements because cumulative cash flows before and after adjustments have a horizon of less than 30 days.
Practice Questions: Q2 Answer
Explanation: D is correct.
Basel III requires that banks can meet a 30-day stress test in meeting cash flows. The cash flow survival horizon is approximately only 8 days for this bank before adjustments and only 21 days after adjustments.
Topic 7. Funding Concentration Report
-
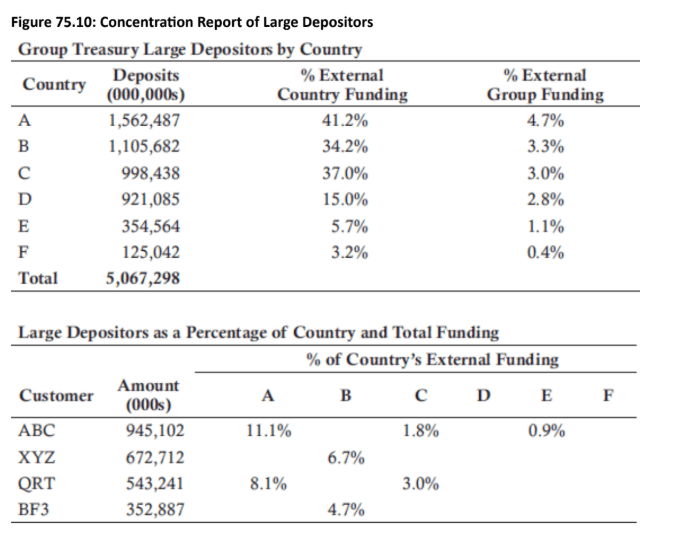
Monitoring deposit concentration: Senior Treasury and relationship managers use large-depositor concentration reports to assess deposit diversity and funding stability.
-
Liquidity risk mitigation: Banks should diversify funding sources by type and geography and avoid excessive reliance on intragroup funding.
-
Definition of large depositors: Large depositors may be defined by an absolute threshold (e.g., USD 50 million) or as a percentage of total liabilities.
-
Governance and regulatory guidance: ALCO oversees liquidity risk management, with UK regulators recommending deposits >5% of total liabilities be treated as large depositors.
Topic 7. Funding Concentration Report
-
Example (Concentration report of large depositors): The ALCO for a bank must set a maximum single-source concentration limit. The ALCO set a limit of 10% for the bank with the concentration report of large depositors illustrated in Figure 75.10. What concerns should the ALCO address at this time?
-
Solution: The ALCO should limit the exposure to ABC customer as the percentage amount from this single-source just exceeded the limit by 1.1%. The bank should try to increase total liabilities to bring this account within limits. If the bank is unable to increase total liabilities, it will need to require that the customer ABC move some funds out of the bank so that the exposure is reduced to under 10%.
Topic 8. Undrawn Commitment Report
-
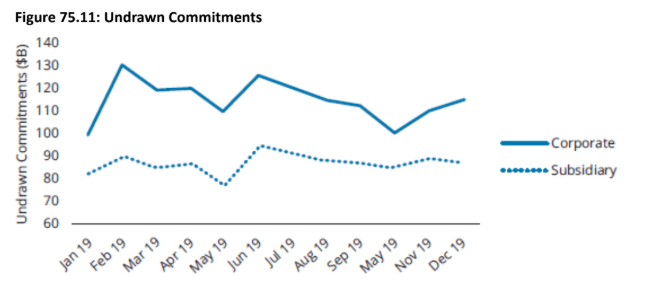
Liquidity drawdowns in stress: During stress events, customers may face liquidity shortages and draw on unused funding lines, increasing banks’ liquidity pressure.
-
Off-balance-sheet exposure: Products such as liquidity lines, letters of credit, revolving credit facilities, and guarantees can significantly amplify liquidity stress in a crisis.
-
Undrawn commitment reporting: Banks use undrawn commitment reports to monitor total liquidity exposure across the head office and subsidiaries and track trends over time.
-
Granular visibility: These reports typically break down aggregate exposures into detailed customer-level commitments for better liquidity risk assessment.
Topic 9. Liability Profile
-
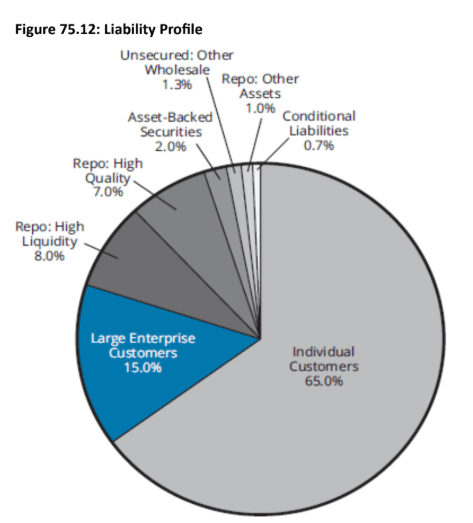
Liability profile definition: A liability profile shows each liability category as a percentage of total liabilities, typically presented in a table or graph.
-
Example composition: In the illustrated liability profile, individual customers represent the largest share at 65%, followed by large enterprise customers at 15%.
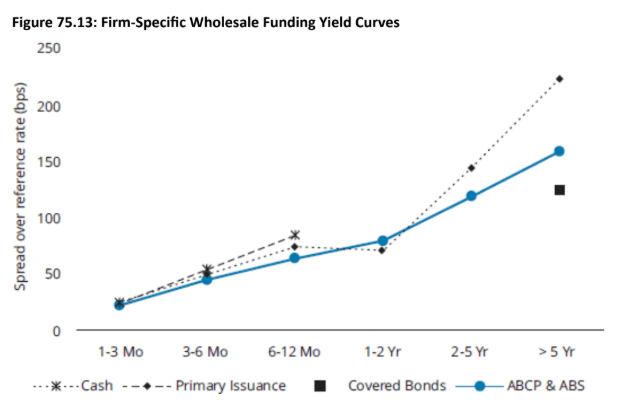
Topic 10. Wholesale Pricing and Volume
-
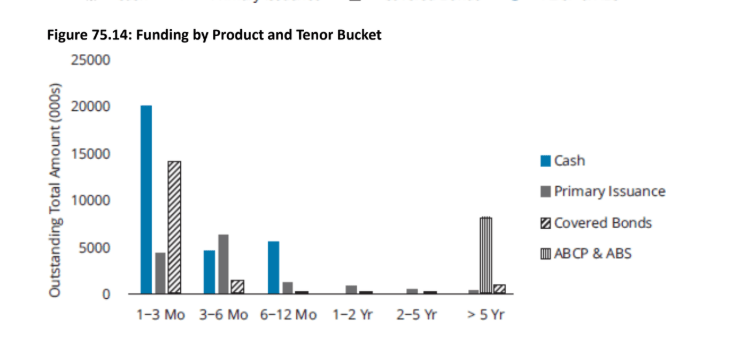
Key liquidity metrics: A bank’s overall funding cost and its funding mix by product are critical indicators of its liquidity position.
-
Regulatory monitoring: Regulators compare firm-specific yield curves across banks to identify institutions of concern when their funding curves rise significantly above peers.
-
Management oversight: Banks can use benchmark information from regulators to help senior management monitor and assess their own funding position.
-
Reporting and frequency: Firm-specific yield curves and funding-volume breakdowns by product are typically reported quarterly, unless regulators request more frequent reporting.
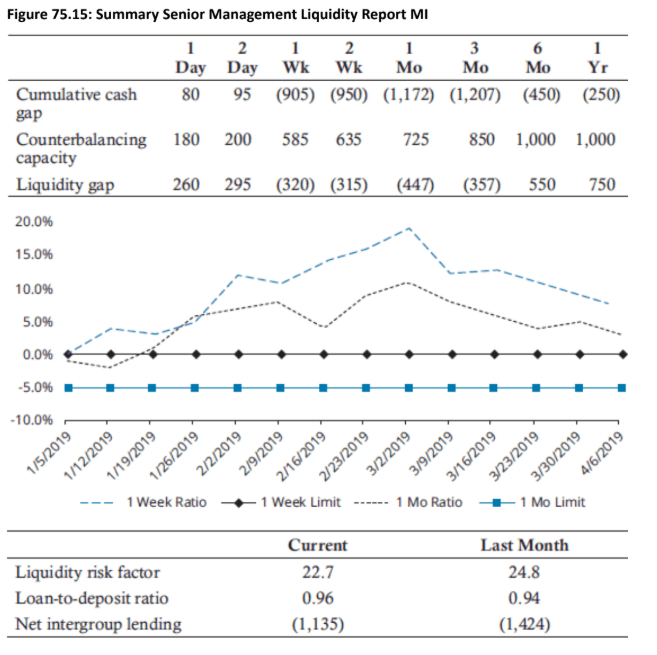
Topic 11. Summary Liquidity Report MI
-
Liquidity summary: A one-page liquidity summary report is prepared monthly for senior management, with more frequent reporting if requested by ALCO during stress periods.
-
Enhanced visibility: The concise, one-page format improves senior management’s visibility and focus on key liquidity risk metrics.
Module 2. Liquidity Stress Tests
Topic 1. Liquidity Stress Testing Reporting
Topic 2. Cash Flow Survival Report
Topic 3. Liquidity Measures in Stress Test Report
Topic 4. Liability Stickiness Report
Topic 5. Quarterly Stress Test Report
Topic 1. Liquidity Stress Testing Reporting
-
Enables senior management to assess the bank’s liquidity position under idiosyncratic (firm-specific) and market-wide stress scenarios.
-
Evaluates potential funding difficulties that may arise during extreme but plausible stress events.
-
Provides structured stress test reports to support decision-making during bank-specific or systemic crises.
-
Helps management identify vulnerabilities and take timely actions to mitigate liquidity risk.
-
Relies on cash flow survival reports, produced weekly for firm-specific stress and daily for market-wide stress.
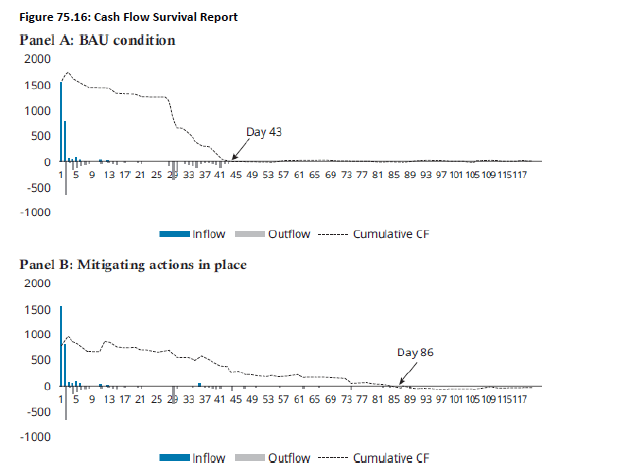
Topic 2. Cash Flow Survival Report
-
Core liquidity stress test: The cash flow survival report is the most critical stress test used to assess a bank’s liquidity risk.
-
BAU vs mitigated scenarios: It evaluates liquidity under business-as-usual (BAU) conditions and after senior management implements mitigating actions.
-
Management actions: Typical mitigating actions include liquidating securities and accessing contingent funding sources.
-
Cumulative position tracking: The report presents both daily cash flows and the cumulative cash flow position over time.
-
Survival horizon impact: In the example, mitigation actions nearly double the cash flow survival horizon from 43 days to 86 days.
Practice Questions: Q1
Q1. One of the most important stress tests for senior bank managers is the cash flow survival report. It is common for banks to forecast two types of cumulative cash inflows and outflows to measure the liquidity risk of the bank. Which of the following best describes the two types of cumulative cash flows, and how often is the report typically run for firm-specific and market-wide stress tests?
A. The two types of cash flows are business as usual and cash flows with adjustments for derivatives and nonmaturing deposits. All stress tests are required weekly.
B. The two types of cash flows are business as usual and cash flows with adjustments for off-balance-sheet items and contingent funding. All stress tests are required daily.
C. The two types of cash flows are business as usual and cash flows with adjustments for retail banking deposits and contingent funding. Firm-specific stress tests are required daily and market-wide stress tests are required weekly.
D. The two types of cash flows are business as usual and cash flows with adjustments for liquidated marketable securities and contingent funding. Firm-specific stress tests are required weekly and market-wide stress tests are required daily.
Practice Questions: Q1 Answer
Explanation: D is correct.
The two types of cash flows are business as usual and cash flows with adjustments for liquidated marketable securities and contingent funding. The Financial Services Authority (FSA) in the UK requires firm-specific stress tests weekly and market-wide stress tests daily.
Topic 3. Liquidity Measures in Stress Test Report
-
The FSA in the UK requires large banks to report the cash flow survival horizon report along with other key metrics in the stress report.
-
The following list includes examples of liquidity measures included in a typical stress report.
-
Wholesale funding
-
Retail
-
Intraday, three-day, and five-day
-
Cross-currency
-
Intragroup
-
Off balance sheet
-
Marketable assets
-
Nonmarketable assets
-
Funding concentration
-
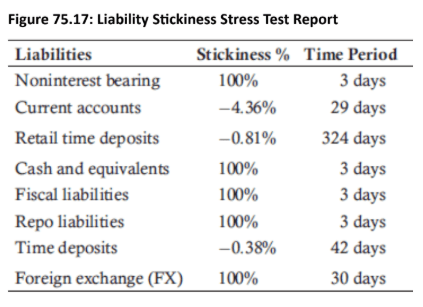
Topic 4. Liability Stickiness Report
-
Observed behavioral forecasting (OBF): Stress reports include OBF to assess the stickiness and withdrawal behavior of liabilities under stress scenarios.
-
Management reporting: Liability stickiness reports (e.g., Figure 75.17) are presented to senior management as part of liquidity stress testing.
-
Scope of application: OBF analysis may cover not only core liabilities but also corporate deposits, government time deposits, interbank time deposits, and intragroup deposits.
Topic 5. Quarterly Stress Test Report
-
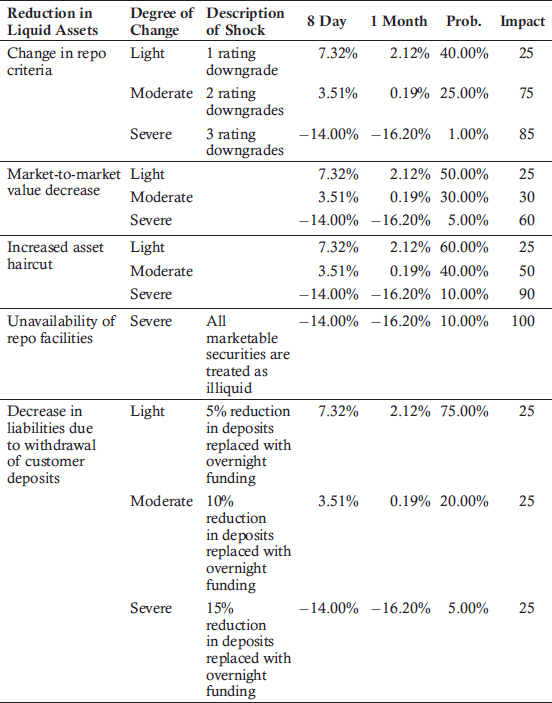
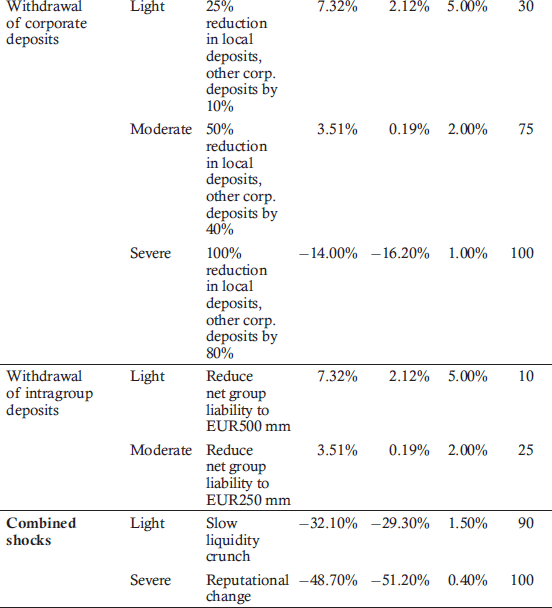
Regulatory requirement: The UK FSA requires institutions to submit quarterly, line-by-line liquidity stress test reports (Fig. on next page), with some regulators in other jurisdictions requiring more frequent reporting.
-
Stress test content: Reports quantify the impact on liquidity ratios and the probability of occurrence across different shock severities (light, moderate, severe).
-
Shock scenarios covered: Stress categories include reductions in liquid assets, declines in liabilities, FX mismatches, and combined multi-shock scenarios occurring simultaneously.