Introduction to Data Science
Karl Ho
School of Economic, Political and Policy Sciences
University of Texas at Dallas
2025 Institute for Social Science Methodology
-
Karl Ho is:
- Professor of Instruction at University of Texas at Dallas (UTD) School of Economic, Political and Policy Sciences (EPPS)
- Co-founder of the UTD Social Data Analytics and Research program (SDAR)
- Projects
- Taiwan Studies Initiative at UTD EPPS funded by MOE
- Taiwan Research Academy funded by TFD
- UTD Math and Coding Camp (EPPS)
- Co-PI: Hong Kong Election Study
- Co-PI: North Texas Quality of Life
- Website: karlho.com (talks, lecture, publications)
Speaker bio.
NCHU-UTD
Dual Degree Program in Data Science
UTD Partnerships in Taiwan (EPPS)
- NCHU: MPA DDP
- NCCU: Diplomacy (in progress)
- NTU SPE: Student Exchange Mobility
Illustration: Collecting stock data
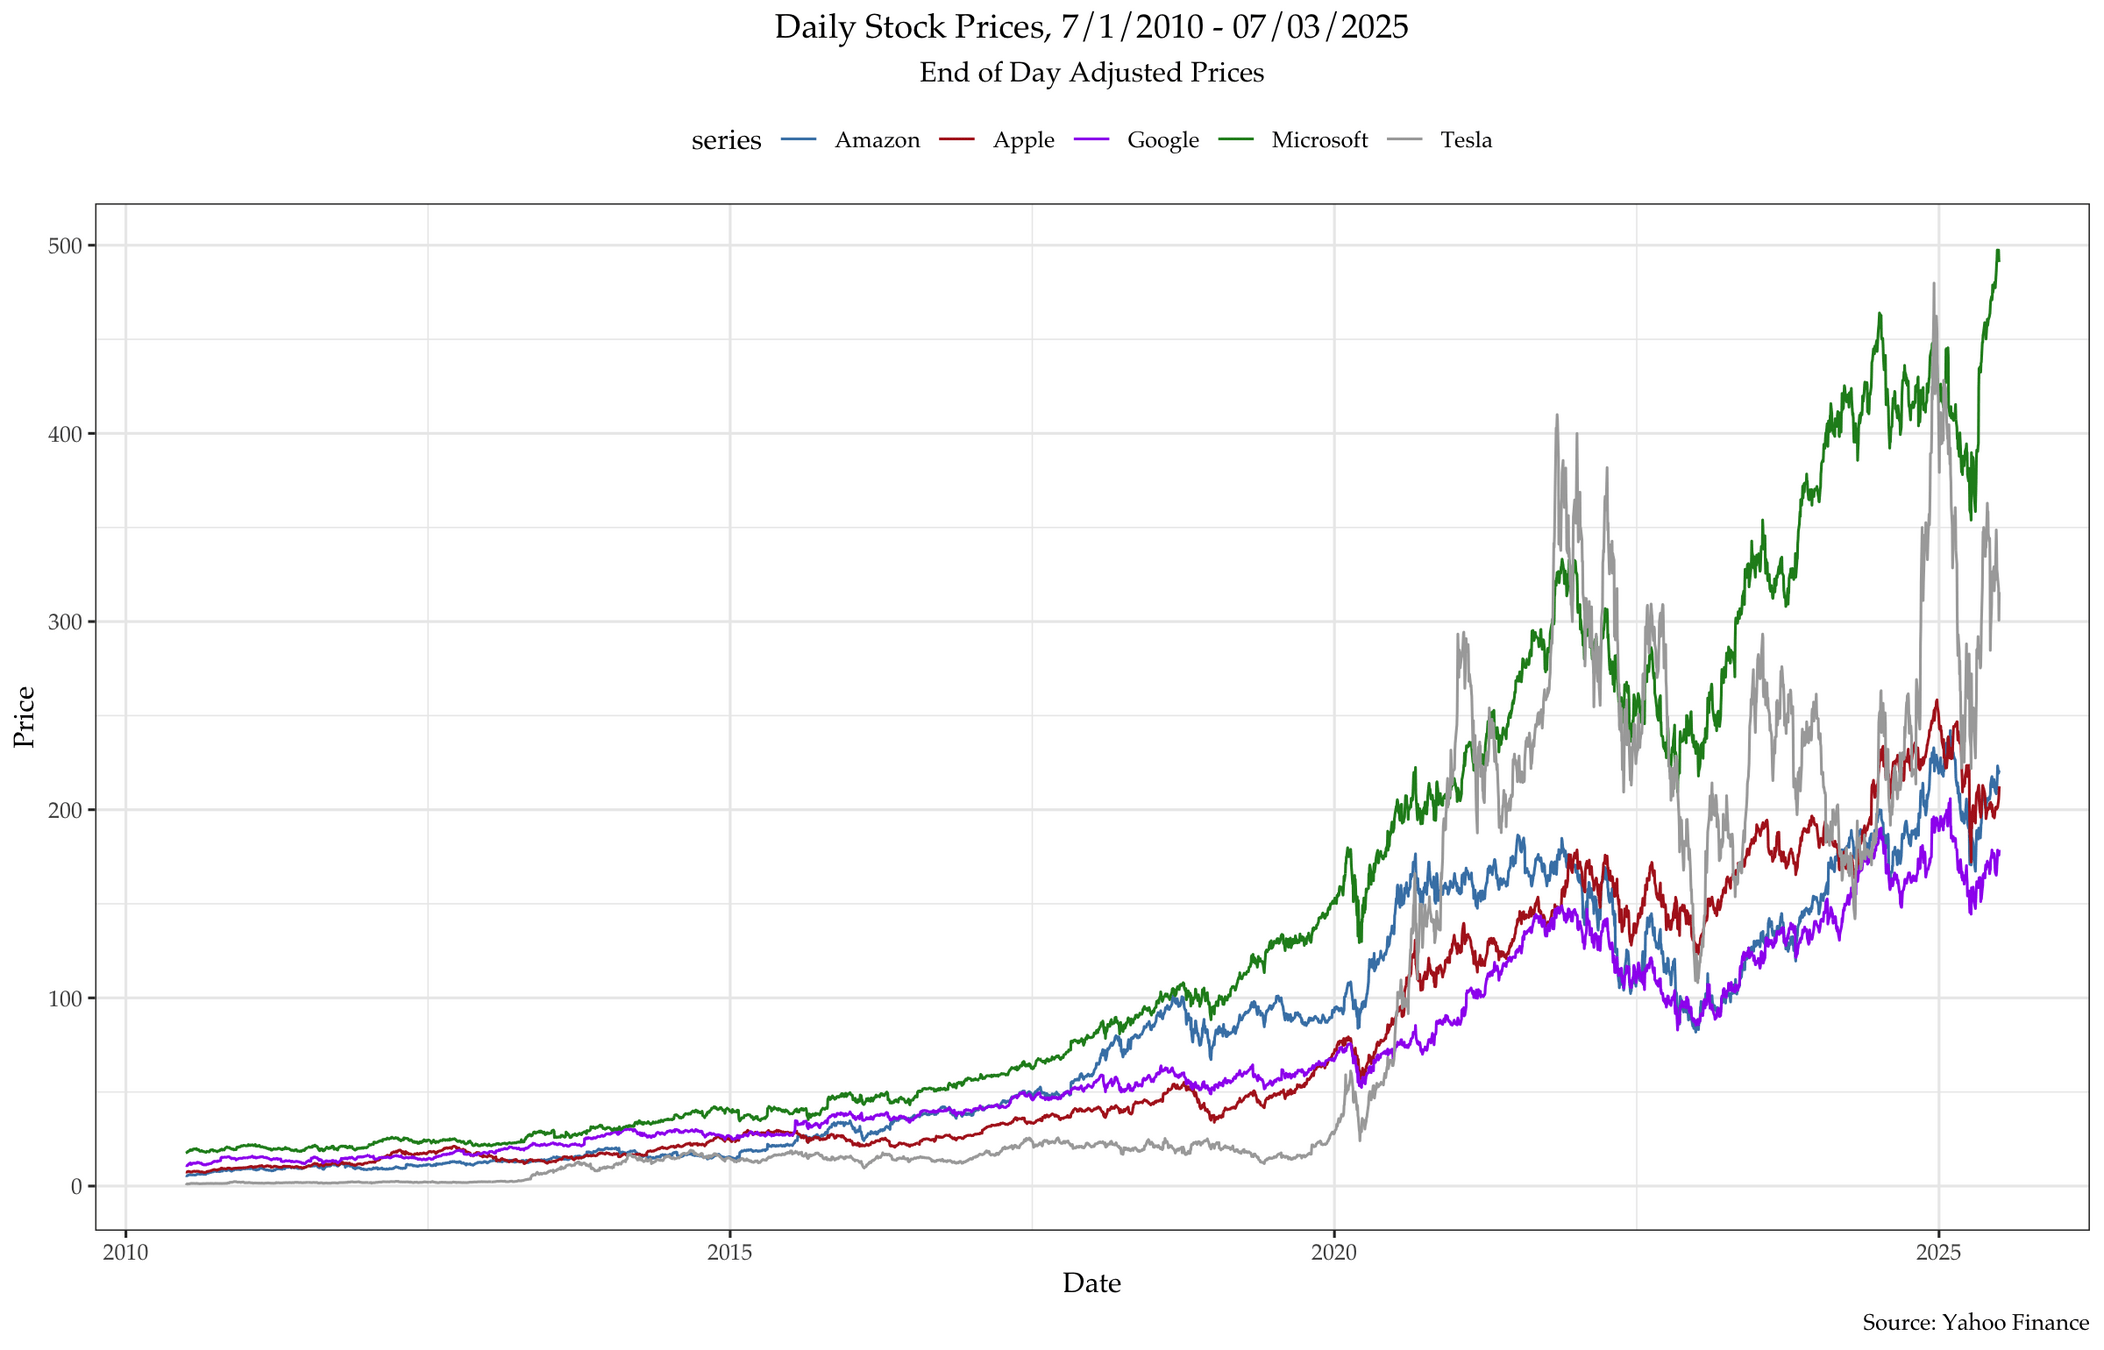
Illustration: Collecting stock data
Data: Daily COVID deaths
Wordcloud using YouTube data

Automated Machine Learning
Analytics using Twitter data
Overview:
The two-part workshop is designed to introduce students to data science and applications. Each course is delivered in three hours, giving overview and survey in subfields of data science with illustrations and hands-on practices. Students should follow pre-class instructions to prepare materials and own device before coming to class.
Whom is this course for?
-
Regular track: any students with no to any background in data programming and statistics
-
Advanced Progress (AP) track: students with some and intermediate backgrounds in data programming and statistical modeling
Pre-class preparation
- Bring own device (Windows 10 or MacOS, no tablets)
- All software/applications used in this class are open-sourced
- Programming in cloud platforms (RStudio cloud, Google Colab)
- Recommended accounts: GitHub

Please fill out this survey
In the beginning.....
This introductory course is an overview of Data Science. Students will learn:
- What is Data Science?
- What is Big Data?
- How to equip for data scientist
- Tools for professional data scientists
Prepare for class
Recommended software and IDE’s
- R version 4.x (https://cran.r-project.org)
- RStudio version 2025.0x (https://posit.co/download/rstudio-desktop/)
Cloud websites/accounts:
- GitHub account (https://github.com)
- RStudio Cloud account (https://rstudio.cloud)
Optional software and IDE’s:
Text editor of own choice (e.g. Visual Studio Code, Sublime Text, Bracket)
Ask me anything!

Overview:
-
Why Data Science? Why now?
-
Data fluency (vs. Data literacy)
-
Types of Data Science
-
Data Science Roadmap
-
Data Programming
-
Data Acquisition
-
Data Visualization
Why Data Science? Why now?
McKinsey & Co., An Executive’s Guide to AI

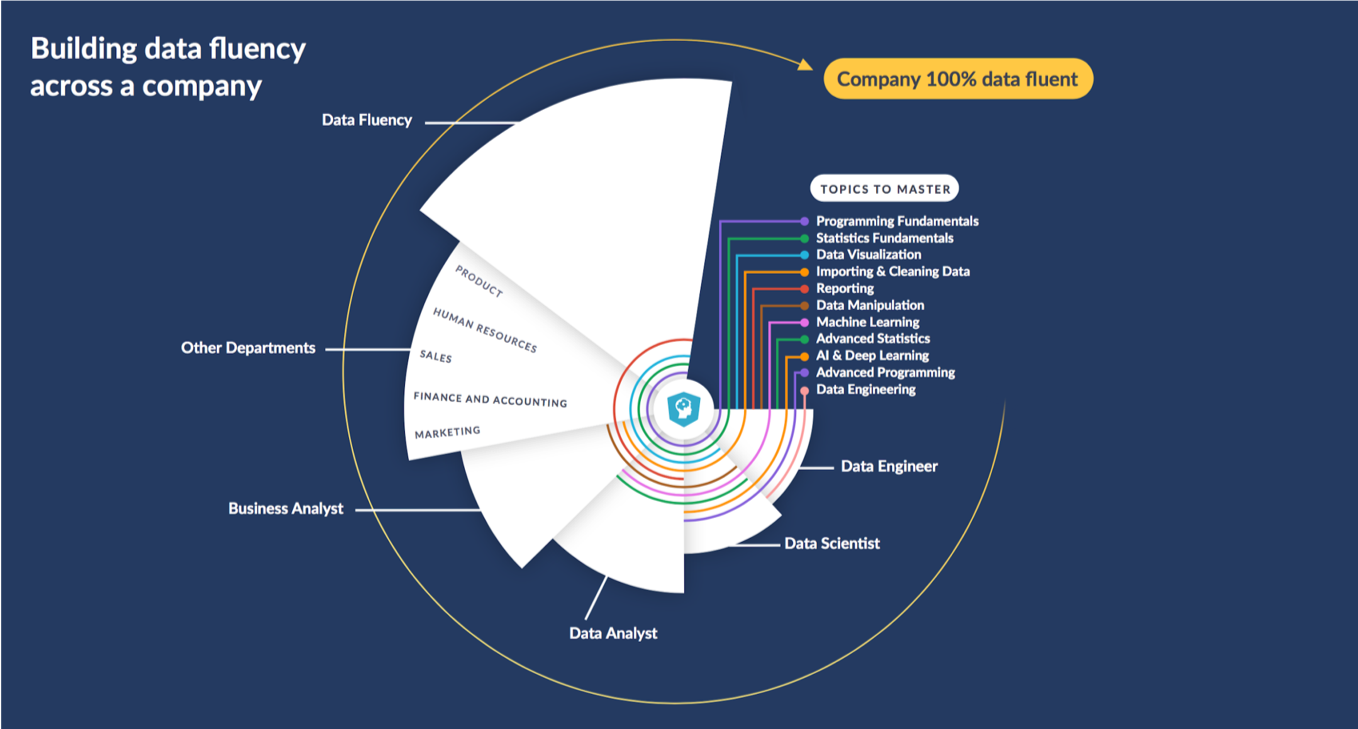
Data fluency
Hugo Bowne-Anderson. 2019. "What 300 L&D leaders have learned about building data fluency"
Data fluency
Hugo Bowne-Anderson. 2019. "What 300 L&D leaders have learned about building data fluency"
Data fluency
Hugo Bowne-Anderson. 2019. "What 300 L&D leaders have learned about building data fluency"
Data fluency
Everybody has the data skills and literacy to understand and perform data driven documents and tasks
Danger of immature data fluency
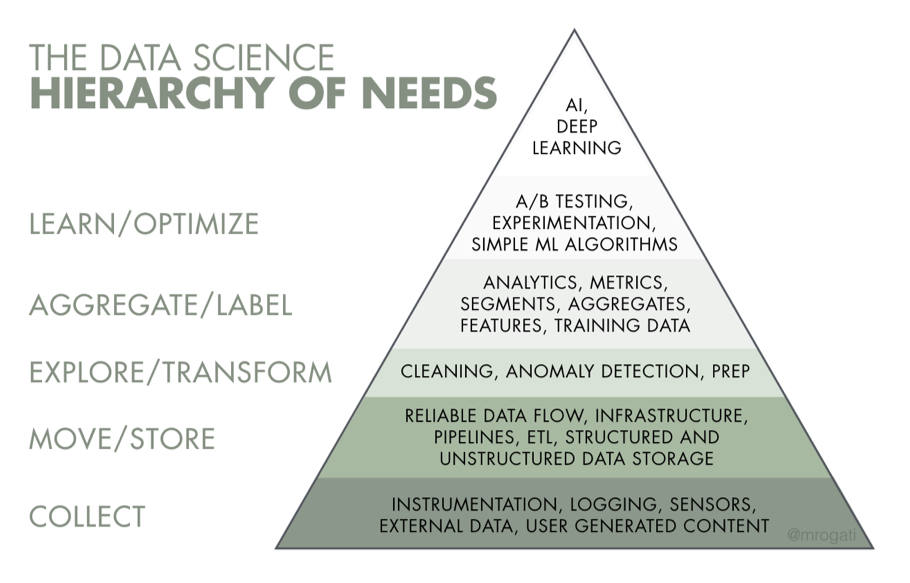
Types of Data Science
- Business intelligence (Descriptive analytics)
- Machine learning (Predictive analytics)
- Decision making (Prescriptive analytics)
Rogati AI hierarchy of needs
Data Science Roadmap
-
Introduction - Data theory
-
Data methods
-
Statistics
-
Programming
-
Data Visualization
-
Information Management
-
Data Curation
-
Spatial Models and Methods
-
Machine Learning
-
NLP/Text mining
What is data?
facts and statistics collected together for reference or analysis"
- Oxford dictionary
- fundamental component in the process of analysis,
- where it serves as the raw input that can be processed to generate information and insights.
the representation of facts, concepts, or instructions in a formalized manner suitable for communication, interpretation, or processing by humans or by automatic means"
- McGraw-Hill Dictionary of Scientific and Technical Terms, 2003
- structured and communicable
- can be interpreted and processed for various applications.
a reinterpretable representation of information in a formalized manner suitable for communication, interpretation, or processing"
- ISO/IEC 2382-1:1993
- reinterpretable
- can be reanalyzed or reused in different contexts to extract new information.
a set of values of qualitative or quantitative variables"
- Mark A.Beyer, 2014
the basis for:
- modeling
- inference.
Beyer, M. A. 2014. "Gartner Says Solving 'Big Data' Challenge Involves More Than Just Managing Volumes of Data." Gartner Research.
What is data?
-
Data generation
-
Made data vs. Found data
-
Structured vs. Semi/unstructured
-
Primary vs. secondary data
-
Derived data
-
metadata, paradata
-
-
What is Data?
-
Data is measured.
-
Data is perceived.
-
Data is produced.
-
Data is collected.
What is Data?
Data is everything.
-
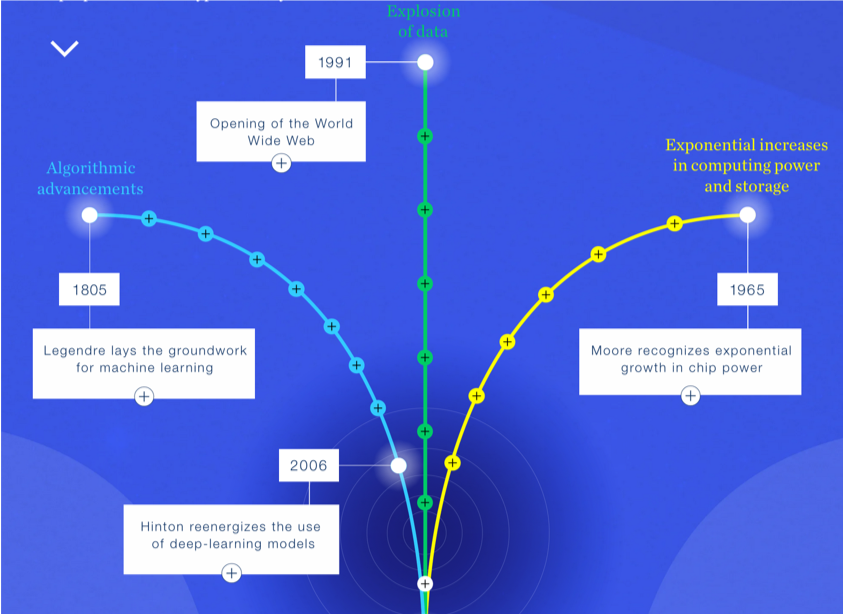
Data is ever growing......
-
Moore's Law
-
Parkinson's Law
-
Moore's Law

Moore's Law
Moore's Law
General-purpose computing capacity grew at an annual rate of 58%.
Computing power doubles every 18 months.
Telecommunication
The world's capacity for bidirectional telecommunication grew at 28% per year, closely followed by the increase in globally stored information (23%)
Hilbert, M. and López, P., 2011. The world's technological capacity to store, communicate, and compute information. science, p.1200970.
Digital Revolution
Humankind's capacity for unidirectional information diffusion through broadcasting channels has experienced comparatively modest annual growth (6%). Telecommunication has been dominated by digital technologies since 1990 (99.9% in digital format in 2007), and the majority of our technological memory has been in digital format since 2000s.
Parkinson's Law of Data
“Data expands to fill the space available for storage.”
Quick note about size
Bits: 8 bits = 1 byte
Bytes: 1024 bytes = 1 KB (1 to 3 digits)
Kilobytes: 1024 KB = 1 MB (4 to 6 digits)
Megabytes: 1024 MB = 1 GB (7 to 9 digits)
Gigabytes: 1024 GB = 1 TB (10 to 12 digits)
Terabytes: 1024 TB = 1 PB (13 to 15 digits)
Petabytes: 1024 PB = 1 EB (16 to 18 digits)
Exabytes: 1024 EB = 1 ZB (19 to 21 digits)
Zettabytes: 1024 ZB = 1 YB (22 to 24 digits)
Yottabytes: more than enough... (25 to 27 digits)
A Taxonomy of Data
-
Numbers
-
Text
-
Images
-
Audio
-
Video
-
Signals
-
Data of data: Metadata and Paradata
How Data are generated?
-
Computers
-
Web
-
Mobile devices
-
IoT (Internet of Things)
-
Further extension of human users (e.g. AI, avatars)
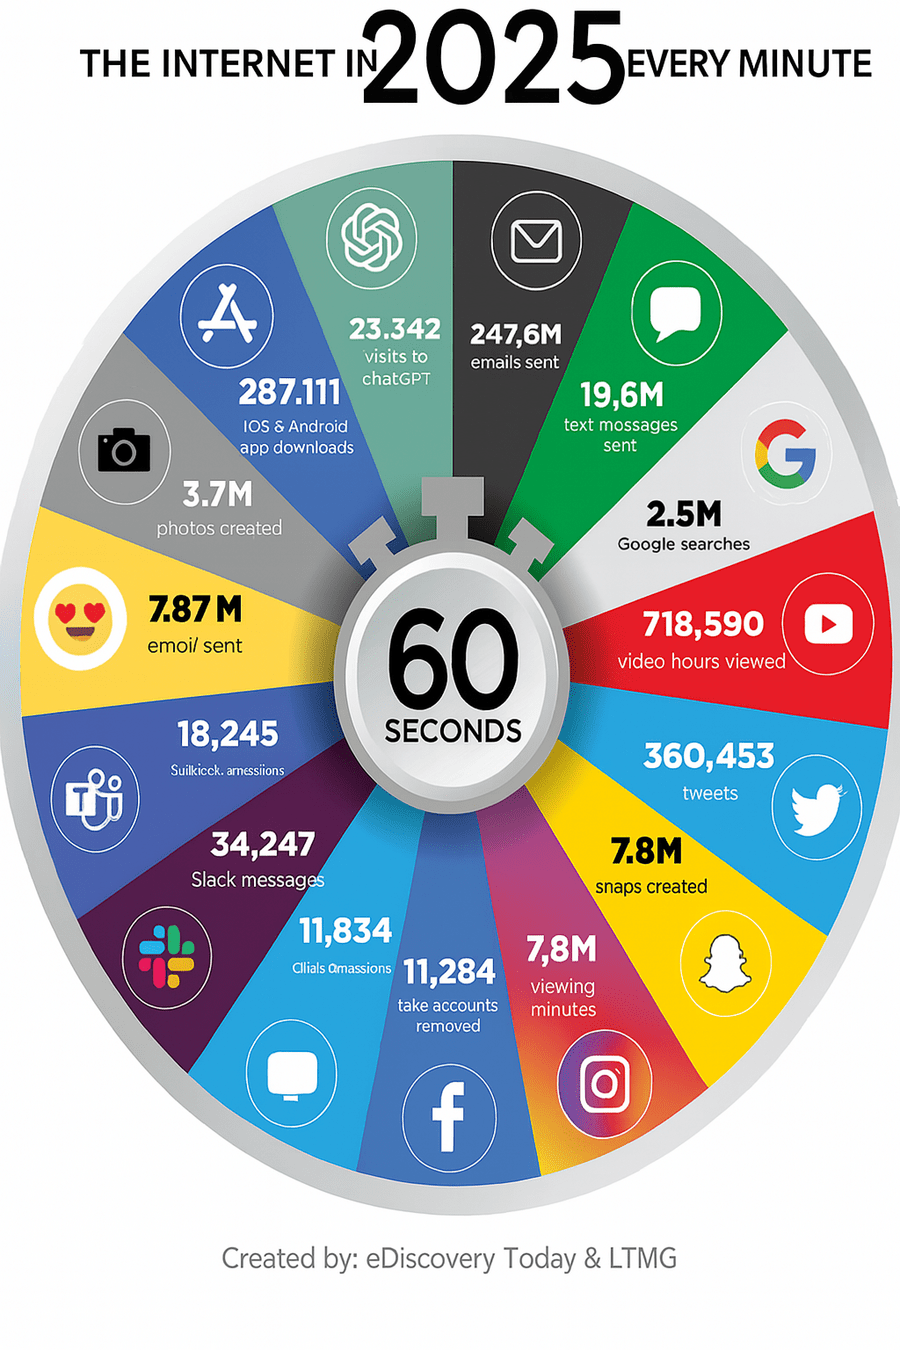
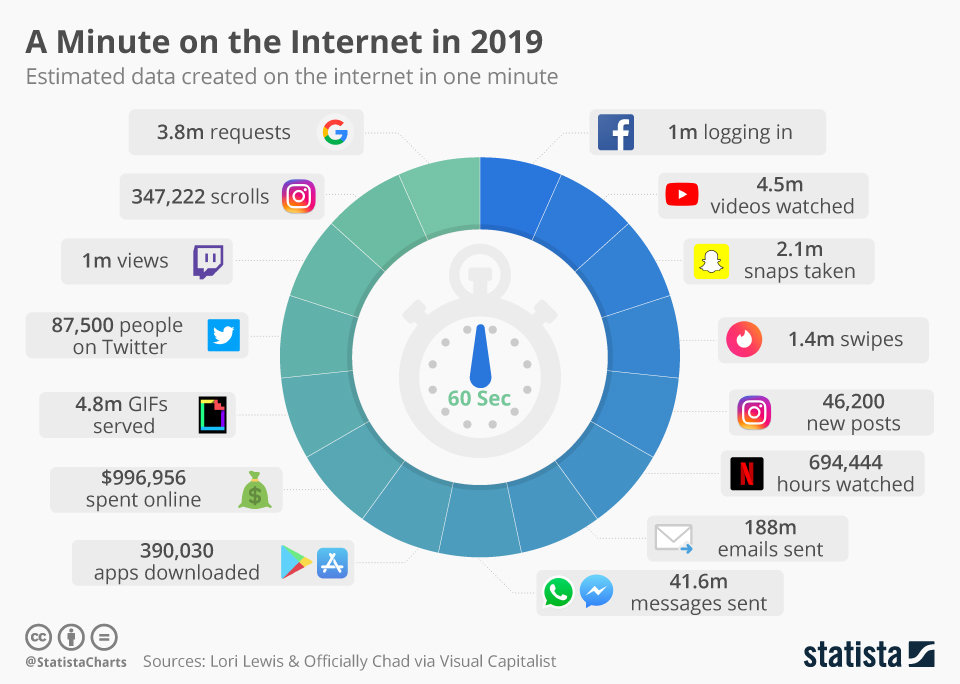
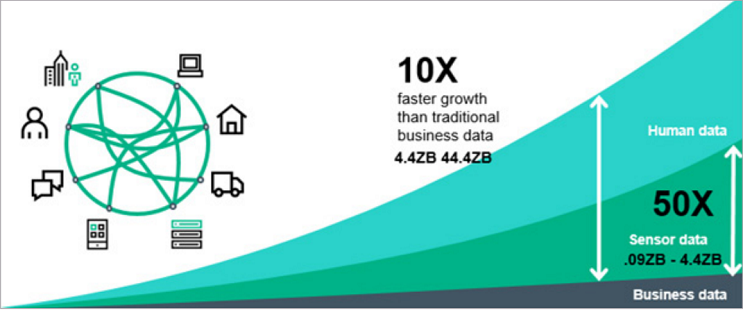
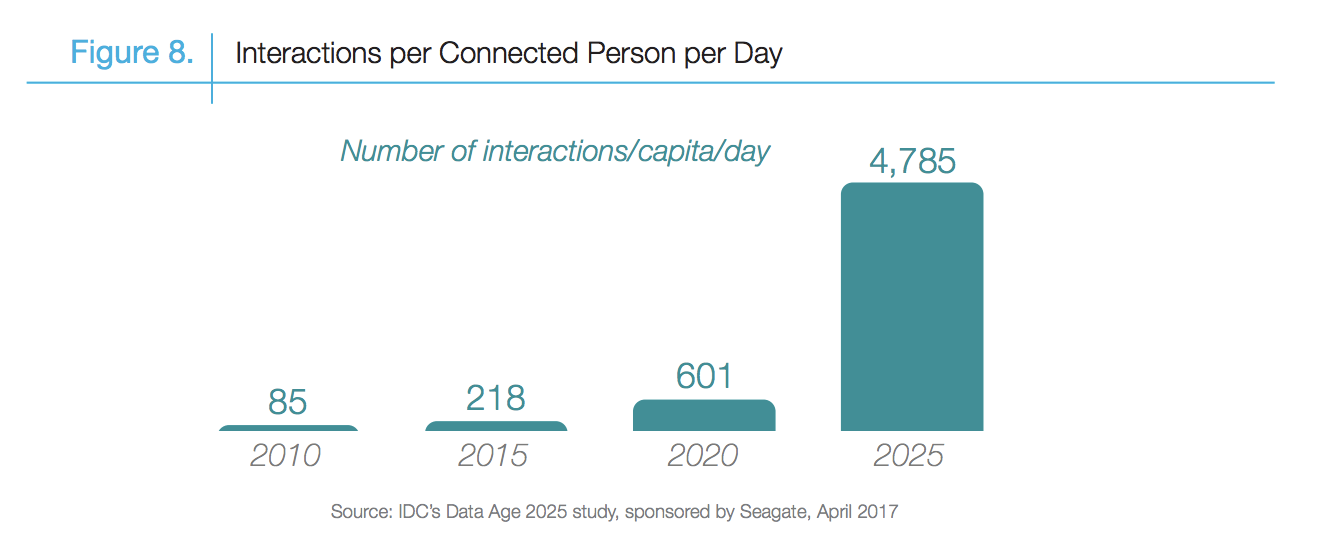
How Data are generated?
The size of the digital universe will double every two years at least.
- InsideBigdata.com
How Data are generated?
"Data Lake" Ubiquitous
Massive raw data repository in its rawest form pending processing.
Categories of Data
(by method)
-
Survey
-
Experiments
-
Qualitative Data
-
Text Data
-
Web Data
-
Complex Data
-
Network Data
-
Multiple-source linked Data
-
Big Data Research
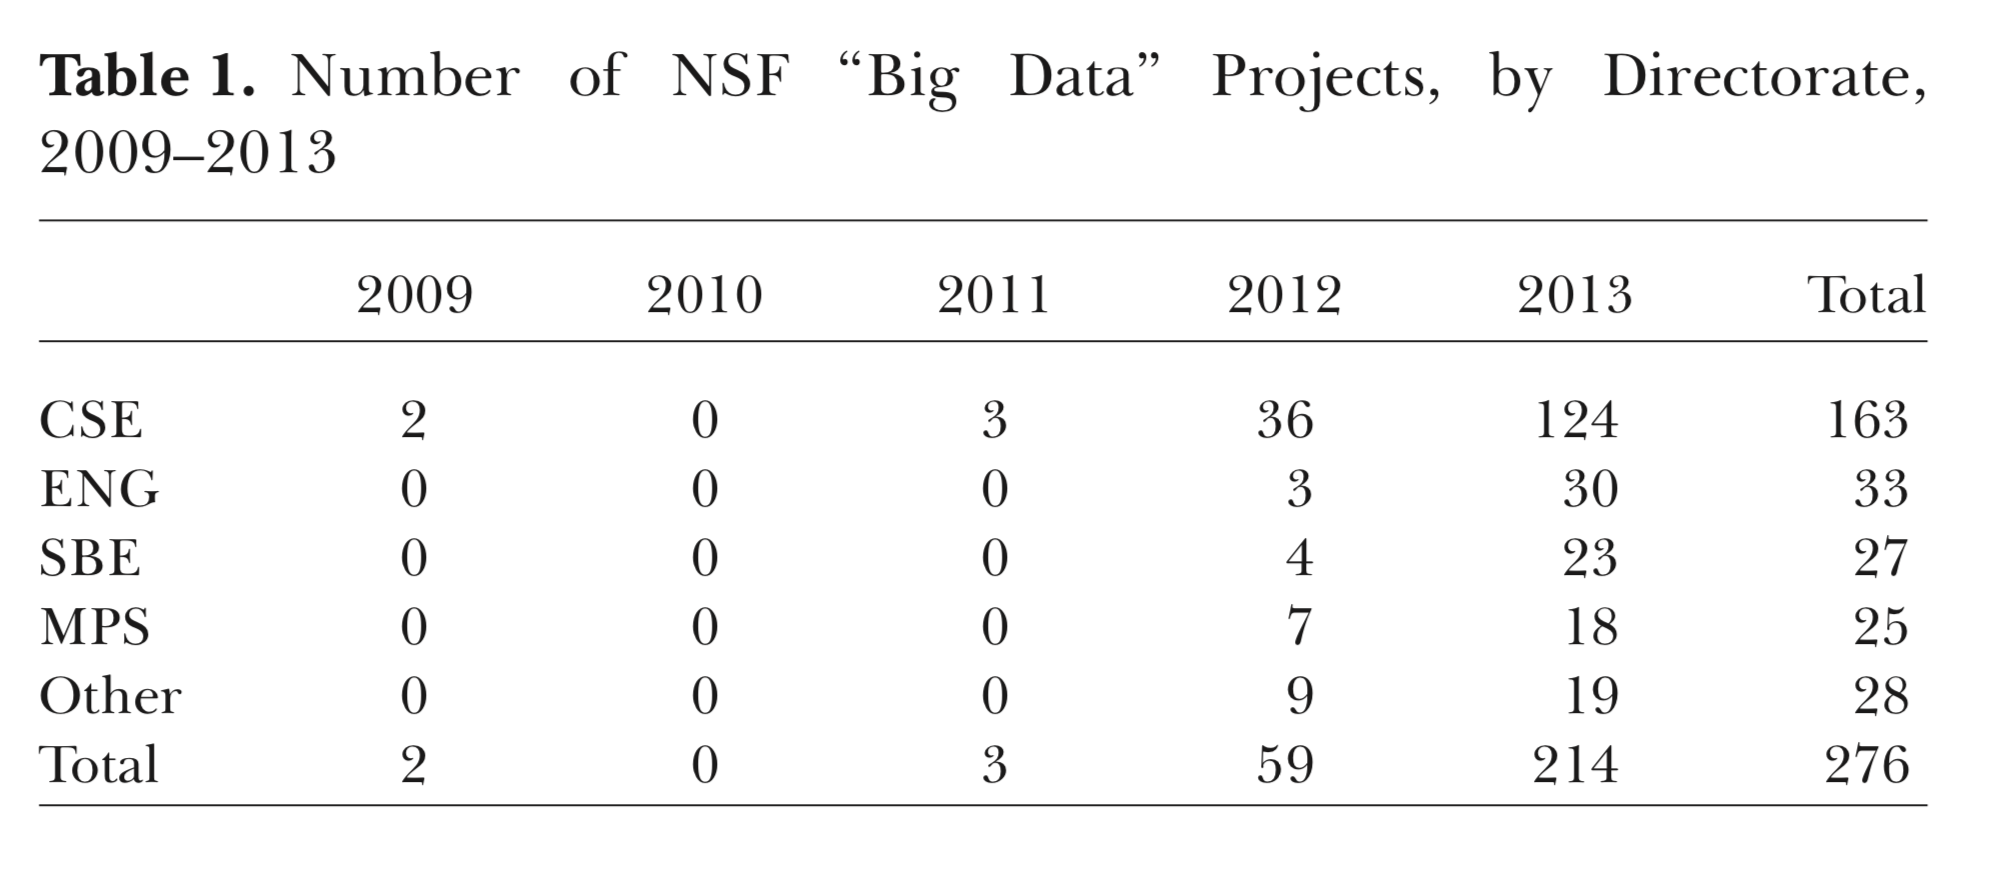
CSE - Computer and Information Science and Engineering
ENG - Engineering
SBE - Social Behavioral and Economic Sciences
Mathematics and Physical Science
-
Prediction-explanation gap
-
Induction-deduction gap
-
Bigness-representativeness gap
-
Data access gap
Three challenges facing data science
-
Generalization from samples to population
-
Generalization from the control group to the treatment group
-
Generalization from observed measurements to the underlying constructs of interest.
- Andrew Gelman
Data methods
Experimental design
Measurements
Social (Data) Scientist's mission
Two major areas to which social scientists can contribute, based on decades of experience and work with end users, are:
-
Inference
-
Data quality.
- Foster et al. 2016
Social (Data) Scientist's mission
Compared to computer scientists and business analytics researchers, we are distinct in not only our familiarity with data, statistical models and inference.
Social scientists pursue a good cause, something we can contribute: to make a difference, to bring public good and to shape a better society.
Social (Data) Scientist's mission
Grimmer, J., 2015. We are all social scientists now: how big data, machine learning, and causal inference work together. PS: Political Science & Politics, 48(1), pp.80-83.
Social scientists know that large amounts of data will not overcome the selection problems that make causal inference so difficult.
Let the dataset change your mindset.
- Hans Rosling
Hans Rosling
- Founded Gapminder Foundation
- Visualize historical data on public health and poverty
Data Literacy
- Data generating process
- Graphic grammar
- Statistical judgement
Data Literacy
-
Data generating process
- How data are generated
- Distribution
- Missing values
- Wrong data
Data Literacy
- Graphic grammar
- Bad charts deliver incorrect message
- Poor design
- Color
- Label
- Scale
Data Literacy
- Statistical understanding
- Size does (not) matter
- Representativeness does
- Forecast/prediction minded
- Explanation
Data Literacy
- Why we need numeric data?
- History of data
Darkest hour: Churchill and typist

What is Data Science?
What is Data Science?
-
Science of Data
-
Understand Data Scientifically
The key word in "Data Science" is not Data....
- Jeff Leek
it is Science.
The long term impact of Data Science will be measured by the scientific questions we can answer with the data.
- Jeff Leek
Data Science Keywords
-
Data collection and production
-
Data mining
-
Web scraping
-
-
Data Visualization
-
Interactive charts
-
Dashboards
-
-
Data management
-
Database
-
SQL, NoSQL
-
-
Data analytics
-
Machine learning
-
Deep learning
-
-
CRMs
A Theory of Data: Understanding Data Generation
Data Generation
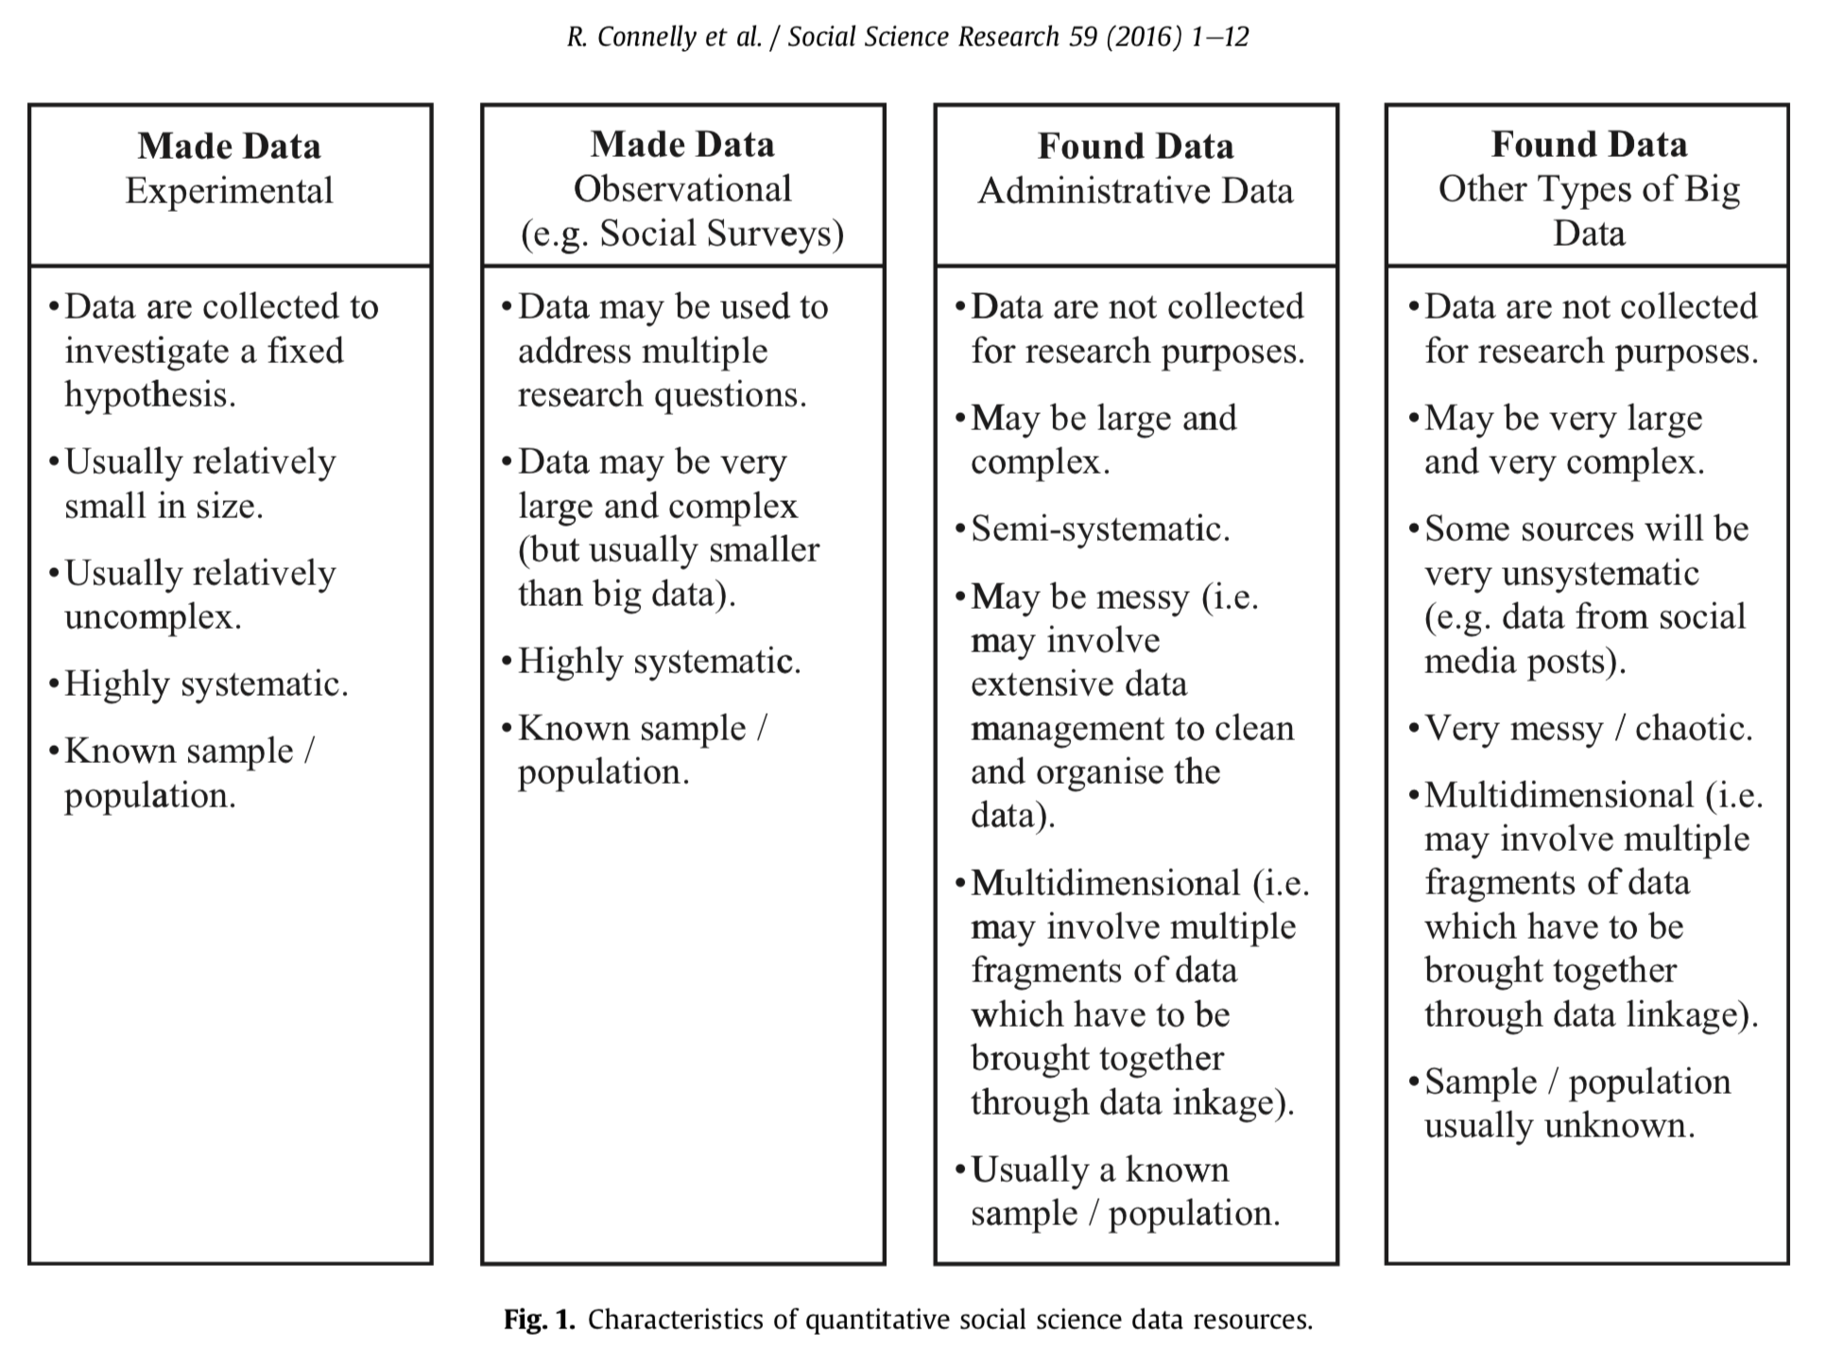
Administrative Data
Administrative data are defined as data which derive from the operation of administrative systems, typically by public sector agencies
- Connelly et al. 2016
Statistical Modeling:
The Two Cultures
Leo Breiman 2001: Statistical Science
| One assumes that the data are generated by a given stochastic data model. |
|---|
| The other uses algorithmic models and treats the data mechanism as unknown. |
|---|
| Data Model |
|---|
| Algorithmic Model |
|---|
| Small data |
|---|
| Complex, big data |
|---|
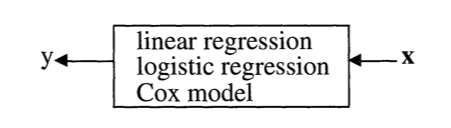
Theory:
Data Generation Process
Data are generated in many fashions. Picture this: independent variable x goes in one side of the box-- we call it nature for now-- and dependent variable y come out from the other side.

Theory:
Data Generation Process
Data Model
The analysis in this culture starts with assuming a stochastic data model for the inside of the black box. For example, a common data model is that data are generated by independent draws from response variables.
Response Variable= f(Predictor variables, random noise, parameters)
Reading the response variable is a function of a series of predictor/independent variables, plus random noise (normally distributed errors) and other parameters.
Theory:
Data Generation Process
Data Model
The values of the parameters are estimated from the data and the model then used for information and/or prediction.
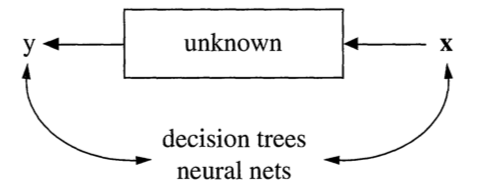
Theory:
Data Generation Process
Algorithmic Modeling
The analysis in this approach considers the inside of the box complex and unknown. Their approach is to find a function f(x)-an algorithm that operates on x to predict the responses y.
The goal is to find algorithm that accurately predicts y.
Theory:
Data Generation Process
Algorithmic Modeling
Unsupervised Learning
Supervised Learning vs.
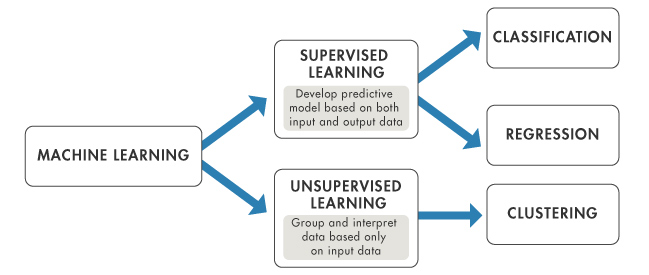
Source: https://www.mathworks.com
-
Data Thinking
-
Multi-disciplinary Thinking
-
Computationally Thinking
Your Data Literacy Depends on Understanding the Types of Data and How They’re Captured
- Hugo Bowne-Anderson
What is Big Data?
The Big data is about data that has huge volume, cannot be on one computer. Has a lot of variety in data types, locations, formats and form. It is also getting created very very fast (velocity) (Doug Laney 2001).
The Big data is about data that has huge volume, cannot be on one computer. Has a lot of variety in data types, locations, formats and form. It is also getting created very very fast (velocity) (Doug Laney 2001).
What is Big Data?
Burt Monroe (2012)
5Vs of Big data
Volume
Variety
Velocity
Vinculation
Validity
- Programming is a practice of using programming language to design, perform and evaluate tasks using a computer. These tasks include:
- Computation
- Data collection
- Data management
- Data visualization
- Data modeling
- Data Programming with GenAI
What is programming?
Data programming
}
- Understand the differences between apparently similar constructs in different languages
- Be able to choose a suitable programming language for each application
- Enhance fluency in existing languages and ability to learn new languages
- Application development
Why learning programming Languages?
- Maribel Fernandez 2014
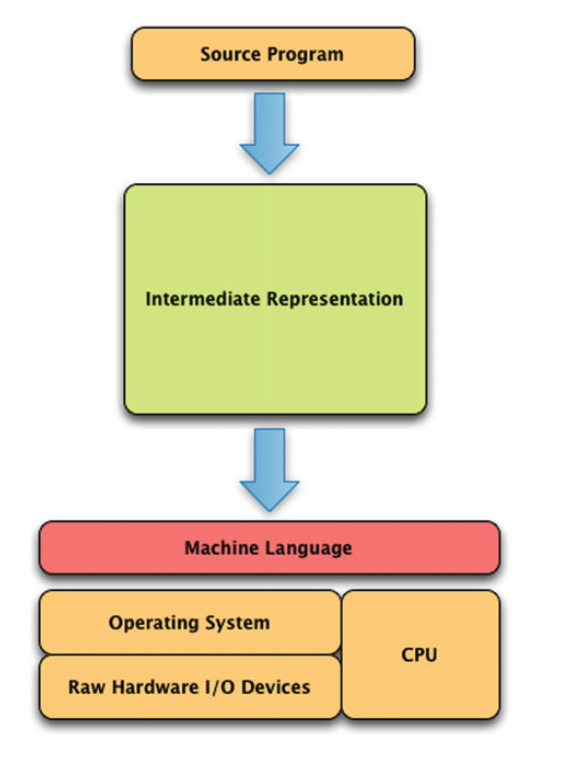
Language implementations
Compilation
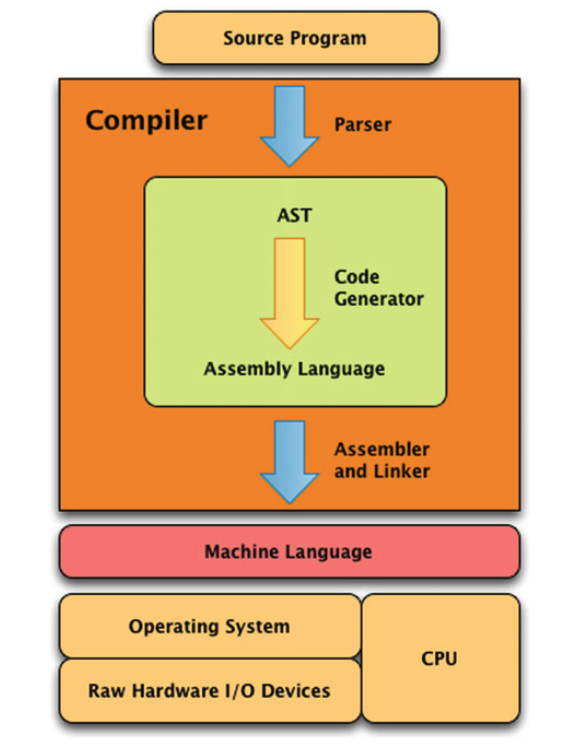
Interpretation

- Machine language
- Assembly language
- C
Low-level languages
- BASIC
- REALbasic
- Visual Basic
- C++
- Objective-C
- Mac
- C#
- Windows
- Java
Systems languages
- Perl
- Tcl
- JavaScript
- Python
Scripting languages
DRY – Don’t Repeat Yourself
Write a function!
Function example
# Create preload function
# Check if a package is installed.
# If yes, load the library
# If no, install package and load the library

preload<-function(x)
{
  x <- as.character(x)
  if (!require(x,character.only=TRUE))
  {
    install.packages(pkgs=x,  repos="http://cran.r-project.org")
    require(x,character.only=TRUE)
  }
}
- For social scientists, programming is more than just developing an application. It could introduce social injustice:
Why learning programming?
learning how to program can significantly enhance how social scientists can think about their studies, and especially those premised on the collection and analysis of digital data.
- Brooker 2019:
Chances are the language you learn today will quite likely not be the language you'll be using tomorrow.
What is R?
R is an integrated suite of software facilities for data manipulation, calculation and graphical display.
- Venables, Smith and the R Core team
- array
- interpreted
- impure
- interactive mode
- list-based
- object-oriented (prototype-based)
- scripting
R
What is R?
-
The R statistical programming language is a free, open source package based on the S language developed by John Chambers.
-
Some history of R and S
-
S was further developed into R by Robert Gentlemen (Canada) and Ross Ihaka (NZ)

Source: Nick Thieme. 2018. R Generation: 25 years of R https://rss.onlinelibrary.wiley.com/doi/10.1111/j.1740-9713.2018.01169.x
What is R?
-
Ihaka, Ross and Robert Gentleman. 1996. R: A language for data analysis and graphics. Journal of Computational and Graphical Statistics, 5(3):299–314
-
Roger Peng's 2015 video of R history
What is R?
It is:
-
Large, probably one of the largest based on the user-written add-ons/procedures
-
Object-oriented
-
Interactive
-
Multiplatform: Windows, Mac, Linux

What is R?
According to John Chambers (2009), six facets of R :
-
an interface to computational procedures of many kinds;
-
interactive, hands-on in real time;
-
functional in its model of programming;
-
object-oriented, “everything is an object”;
-
modular, built from standardized pieces; and,
-
collaborative, a world-wide, open-source effort.
Why R?
-
A programming platform environment
-
Allow development of software/packages by users
-
Currently, the CRAN package repository features 12,108 available packages (as of 1/31/2018).
-
Graphics!!!
-
Comparing R with other software?
Getting the software
-
R home: https://www.r-project.org
-
Downloads: https://cran.r-project.org
-
Select Download R for Windows or Mac or Linux
-
R 4.x
-
Caveat:
-
Frequent updates/upgrades
-
Packages/library
-
Workshop I: Data Programming
RStudio
RStudio is a user interface for the statistical programming software R.
-
Object-based environment
-
Window system
-
Point and click operations
-
Coding recommended
-
Expansions and development
-
Posit Cloud: https://posit.cloud/content/6625059
RStudio
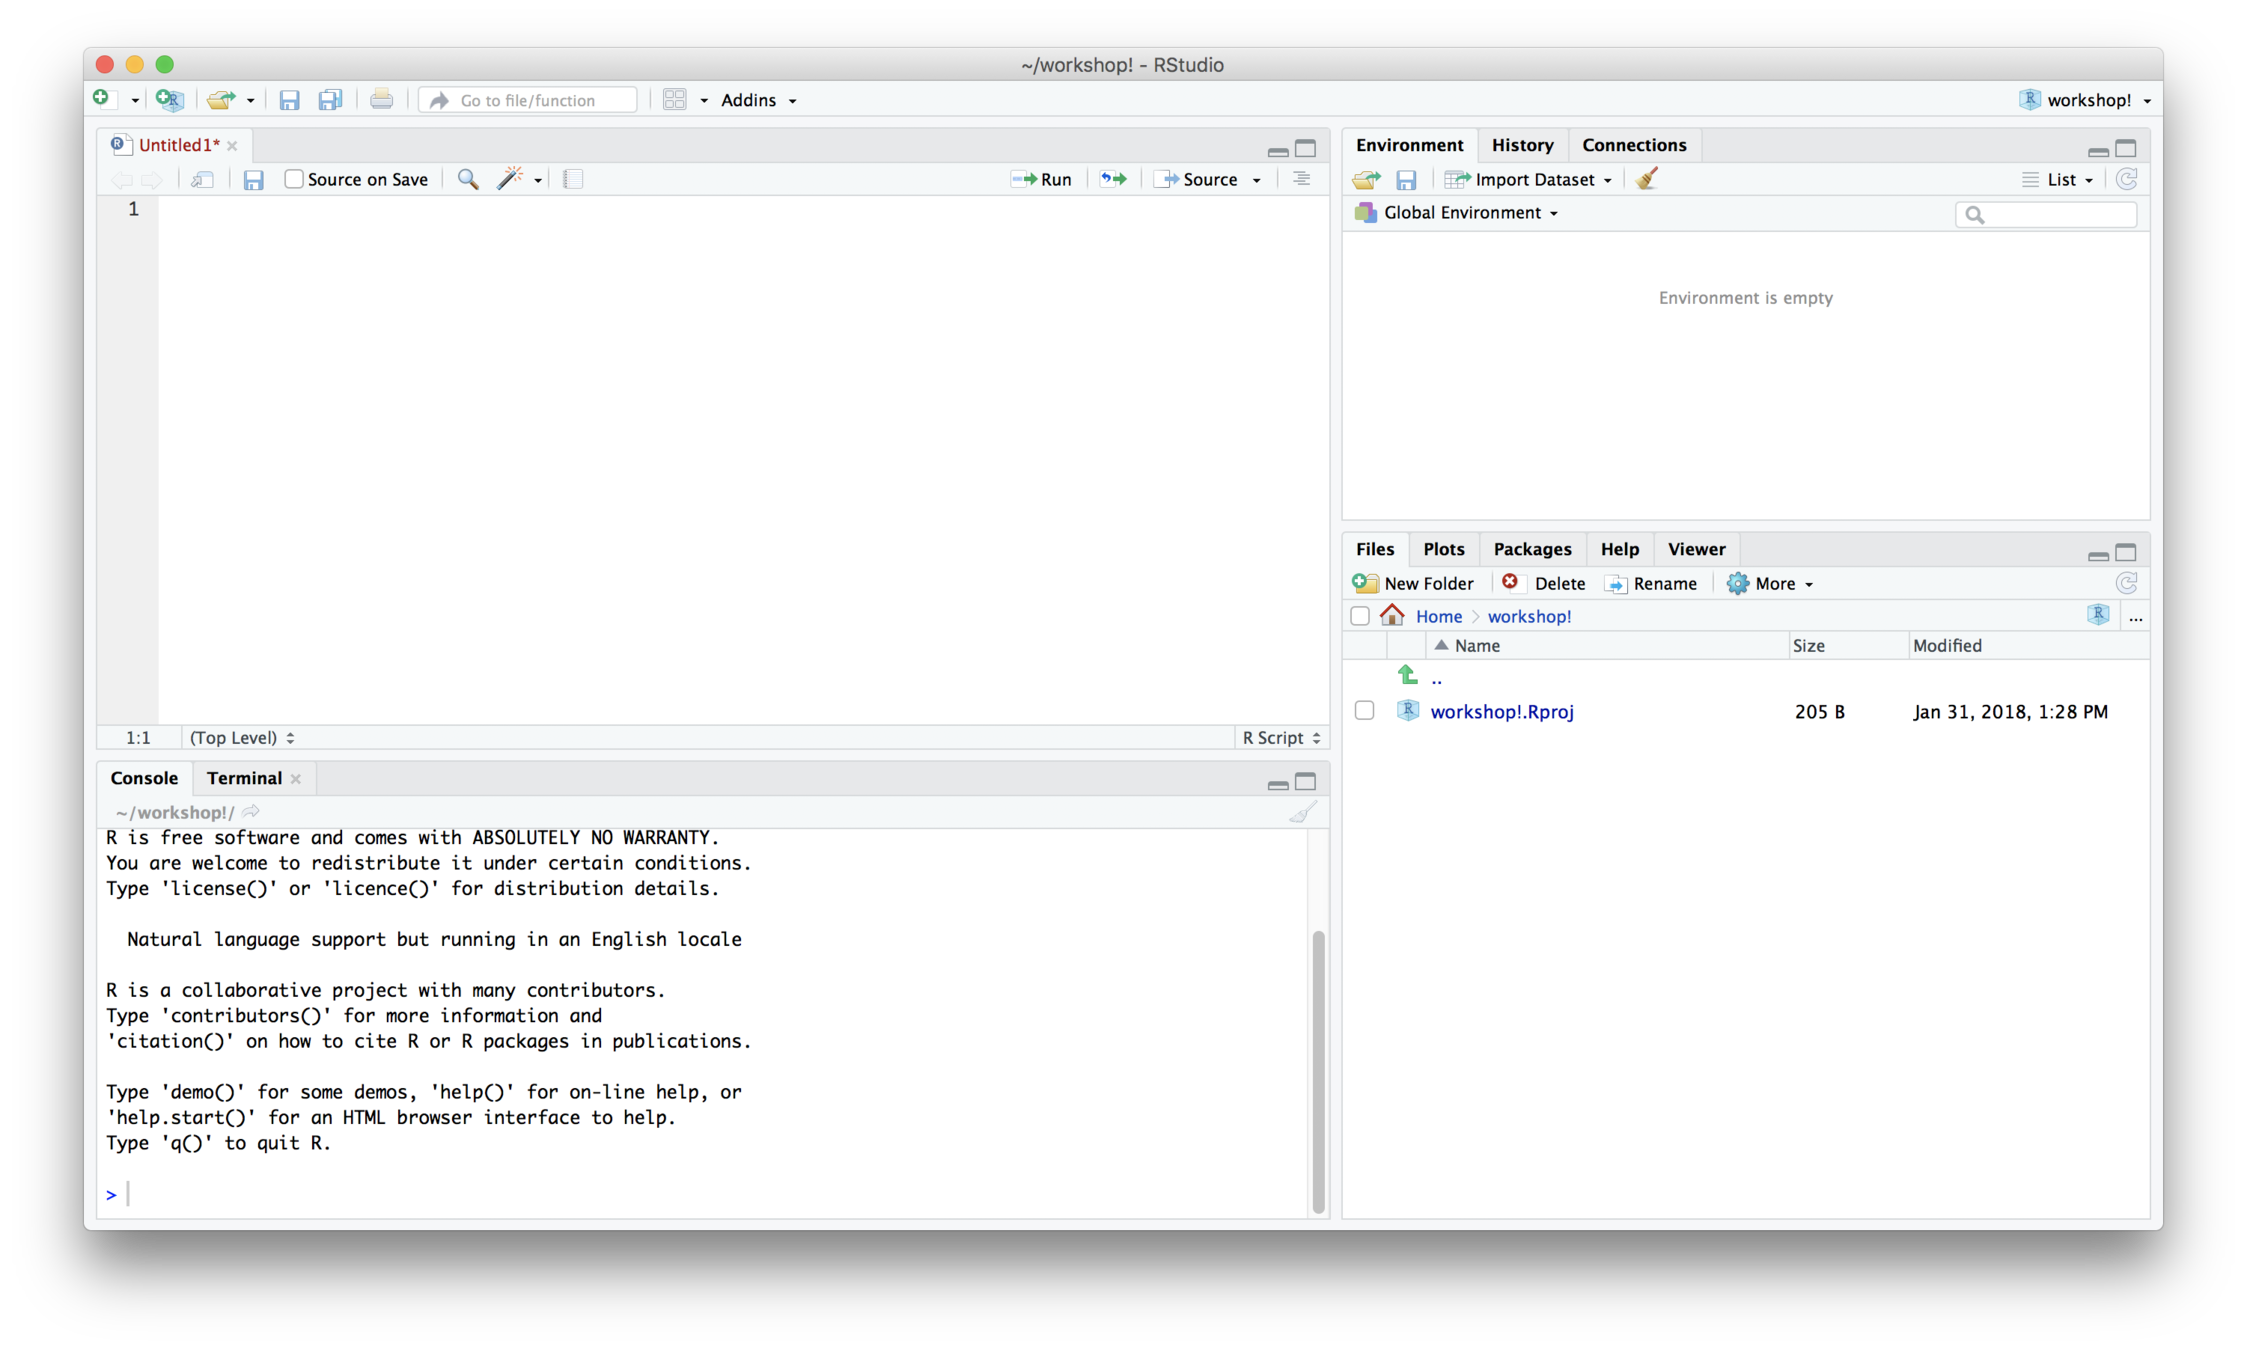
The script window:
You can store a document of commands you used in R to reference later or repeat analyses
Environment:
Lists all of the objects
Console:
Output appears here. The > sign means R is ready to accept commands.
Plot/Help:
Plots appear in this window. You can resize the window if plots appear too small or do not fit.
RStudio
The script window:
You can store a document of commands you used in R to reference later or repeat analyses
Environment:
Lists all of the objects
Console:
Output appears here. The > sign means R is ready to accept commands.
Plot/Help:
Plots appear in this window. You can resize the window if plots appear too small or do not fit.
R Programming Basics
-
R code can be entered into the command line directly or saved to a script, which can be run as a script
-
Commands are separated either by a ; or by a newline.
-
R is case sensitive.
-
The # character at the beginning of a line signifies a comment, which is not executed.
-
Help can be accessed by preceding the name of the function with ? (e.g. ?plot).
Importing data
-
Can import from SPSS, Stata and text data file
Use a package called foreign:
First, install.packages(“foreign”), then you can use following codes to import data:
mydata <- read.csv(“path”,sep=“,”,header=TRUE)
mydata.spss <- read.spss(“path”,sep=“,”,header=TRUE)
mydata.dta <- read.dta(“path”,sep=“,”,header=TRUE)
Importing data
Note:
-
R is absolutely case-sensitive
-
R uses extra backslashes to recognize path
-
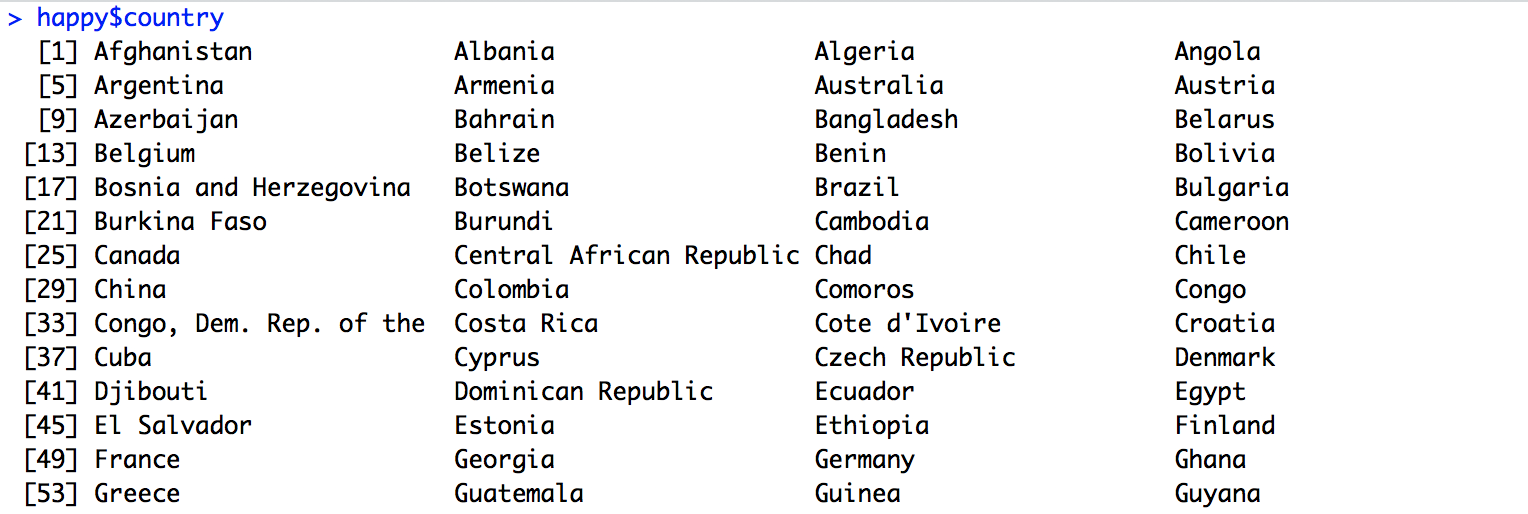
Read data directly from GitHub:
happy=read.csv("https://raw.githubusercontent.com/kho7/SPDS/master/R/happy.csv")
Accessing variables
To select a column use:
mydata$column
For example:
Manipulating variables
Recoding variables
For example:
mydata$Age.rec<-recode(mydata$Age, "18:19='18to19'; 20:29='20to29';30:39='30to39'")
Getting started
Beware of bugs in the above code; I have only proved it correct, not tried it."
- Donald Knuth, author of The Art of Computer Programming

Source: https://www.frontiersofknowledgeawards-fbbva.es/version/edition_2010/
Break
Overview
In this module, we will help you:
-
Understand data generation process in big data age
-
Learn how to collect web data and social data
-
Illustration: Open data
-
collecting stock data
-
collecting COVID data
-
-
Illustration: API
Data Methods
-
Survey
-
Experiments
-
Qualitative Data
-
Text Data
-
Web Data
-
Machine Data
-
Complex Data
-
Network Data
-
Multiple-source linked Data
-
Made
Data
}
}
Found
Data
Data Methods
-
Small data or Made data emphasize design
-
Big data or Found data focus on algorithm
How Data are generated?
-
Computers
-
Web
-
Mobile devices
-
IoT (Internet of Things)
-
Further extension of human users (e.g. AI, avatars)
Web data
How do we take advantage of the web data?
-
Purpose of web data
-
Generation process of web data
-
What is data of data?
-
Why data scientists need to collect web data?
Data file formats
-
CSV (comma-separated values)
- CSVY with metadata (YAML)
-
JSON (JavaScript Object Notation)
-
XML (Extensible Markup Language)
-
Text (ASCII)
-
Tab-delimited data
-
Proprietary formats
- Stata
- SPSS
- SAS
- Database
YAML (Yet Another Markup Language or YAML Ain't Markup Language) is a data-oriented, human readable language mostly use for configuration files)
Open data
Open data refers to the type of data usually offered by government (e.g. Census), organization or research institutions (e.g. ICPSR, Johns Hopkins Coronavirus Resource Center). Some may require an application for access and others may be open for free access (usually via websites or GitHub).
Open data
Since open data are provided by government agencies or research institutions, these data files are often:
-
Structured
-
Well documented
-
Ready for data/research functions
API
-
API stands for Application Programming Interface. It is a web service that allows interactions with, and retrieval of, structured data from a company, organization or government agency.
-
Example:
-
Social media (e.g. Facebook, YouTube, Twitter)
-
Government agency (e.g. Congress)
-
-
APIs can take many different forms and be of varying quality and usefulness.
-
RESTful API (Representational State Transfer) is a means of transferring data using web protocols
- Example:
- Crossref API
http://api.crossref.org/works/10.1093/nar/gni170 - Taiwan Legislative Yuan API
https://www.ly.gov.tw/WebAPI/LegislativeBill.aspx?from=1050201&to=1050531&proposer=&mode=json
- Crossref API
API
API
Like open data, data available through API are generally:
-
Structured
-
Somewhat documented
-
Not necessary fully open
-
Subject to the discretion of data providers
-
E.g. Not all variables are available, rules may change without announcements, etc.
For the type of found data not available via API or open access, one can use non-API methods to collect this kind of data. These methods include scraping, which is to simulate web browsing but through automated scrolling and parsing to collect data. These data are usually non-structured and often times noisy. Researchers also have little control over data generation process and sampling design.
Non-API methods
Non-API methods
Non-API data are generally:
-
Non-structured
-
Noisy
-
Undocumented with no or little information on sampling
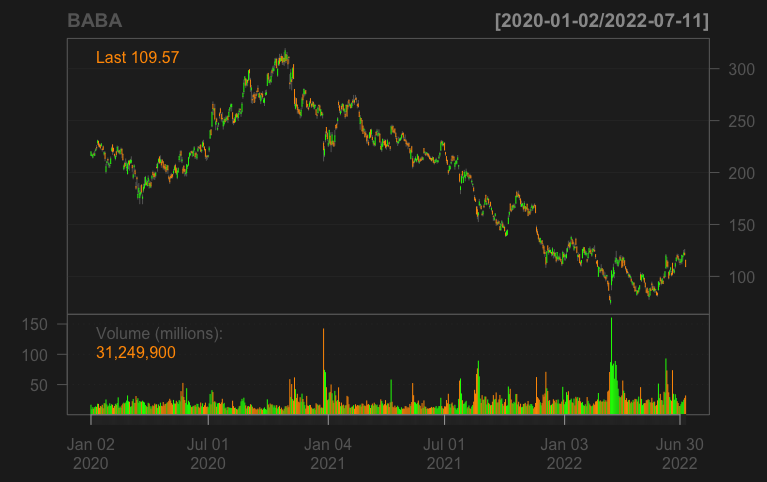
Illustration: Collecting stock data
This workshop demonstrates how to collect stock data using:
- an R package called quantmod
Illustration: Collecting stock data
This workshop demonstrates how to collect stock data using:
- an R package called quantmod
This workshop demonstrates how to collect stock data using:
Link to RStudio Cloud:
https://posit.cloud/content/6625059
- Need a GitHub and RStudio Account
Link to class GitHub:
Workshop II: Data collection
Assignment 1
-
Install R and RStudio
-
Download the R program in class GitHub (under datascience/codes)
-
DPR_stockdata.R
-
-
Can you download TSM's (台積電) data in the last three years?
-
Plot the TSM data in the last three years using the sample codes (plot and ggplot2)
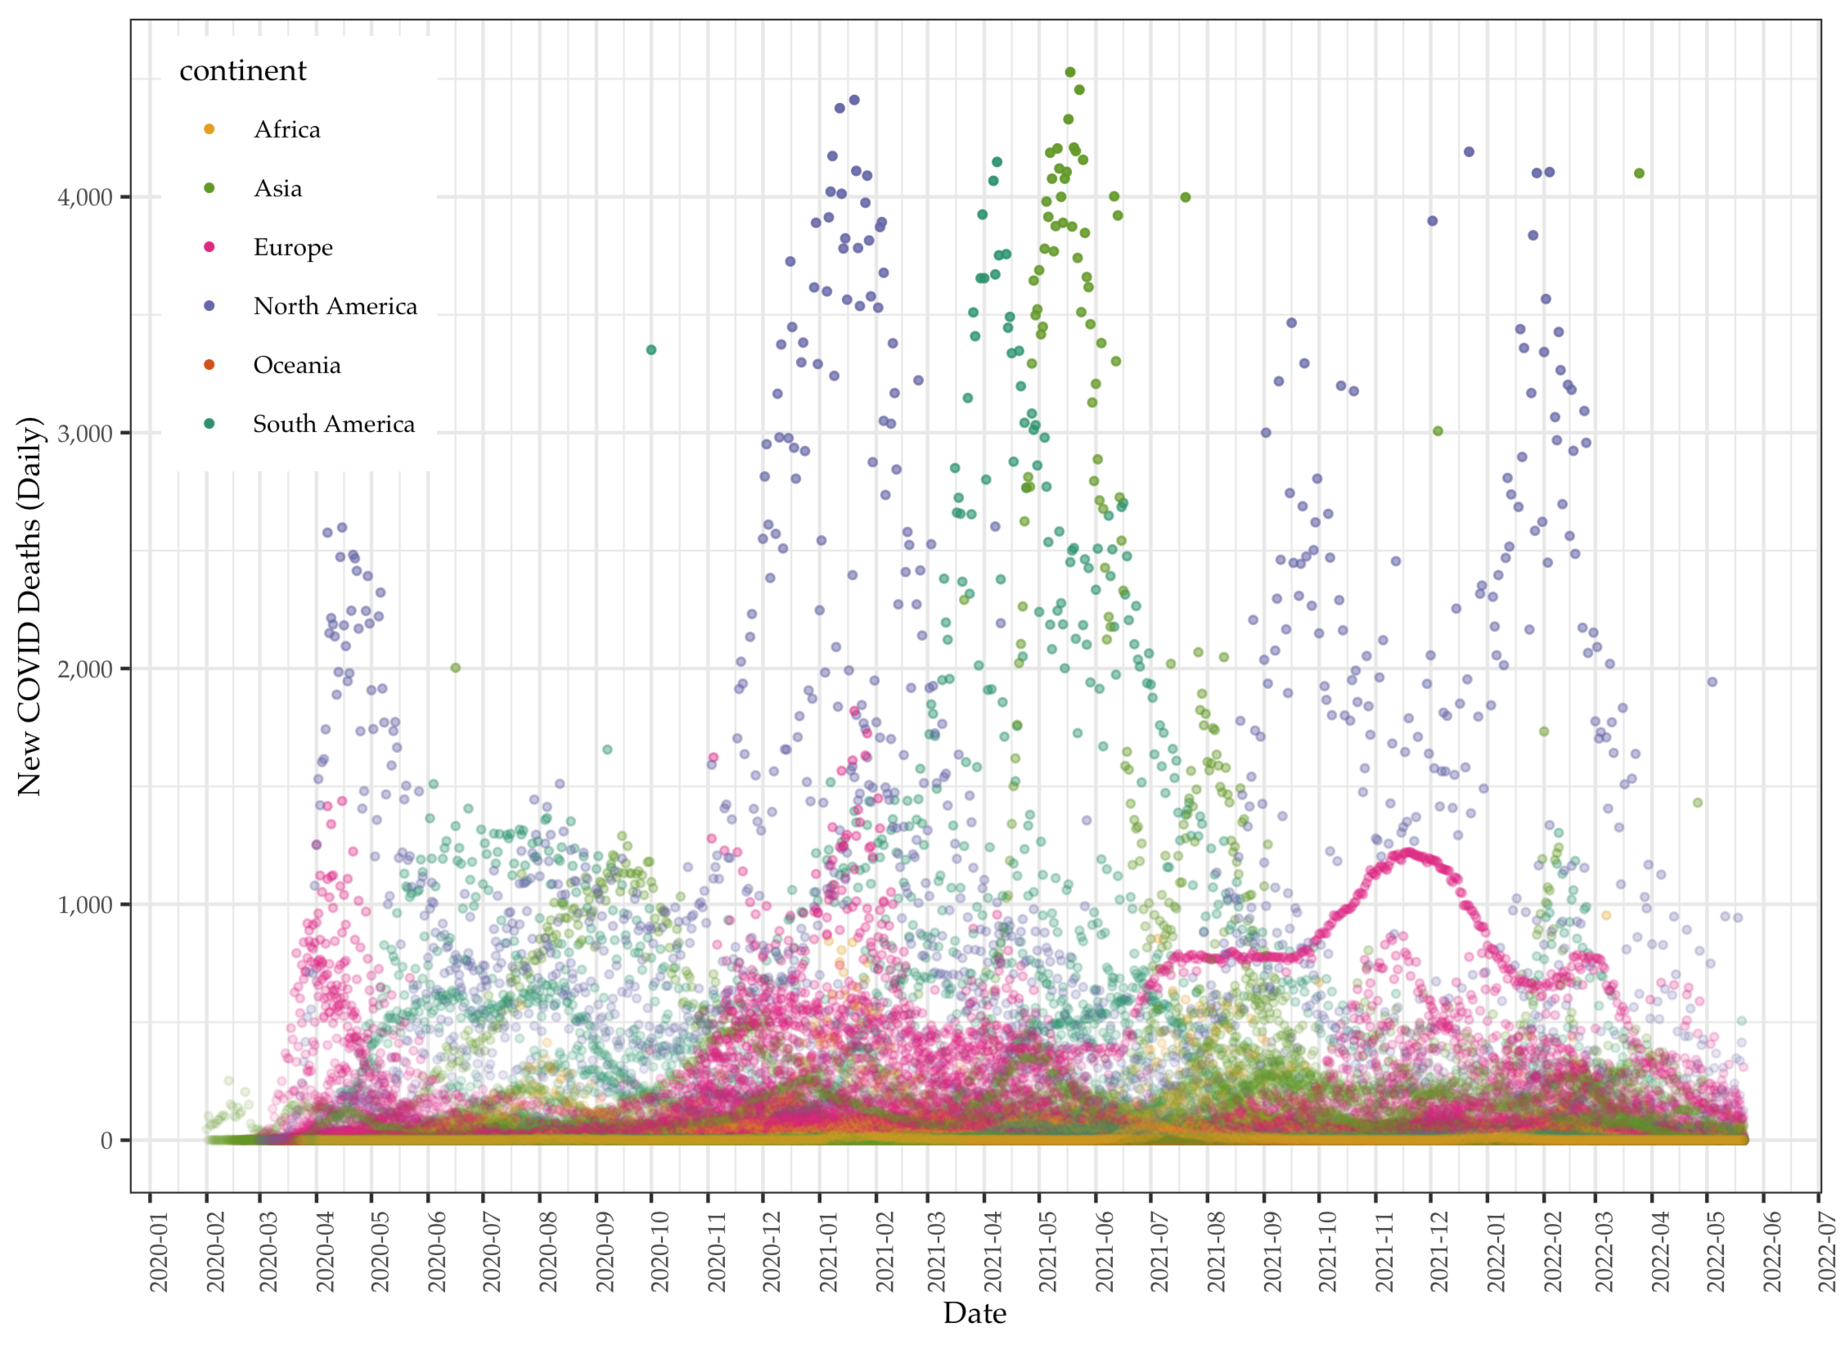
Illustration: Collecting COVID data
Data: Total cases per million
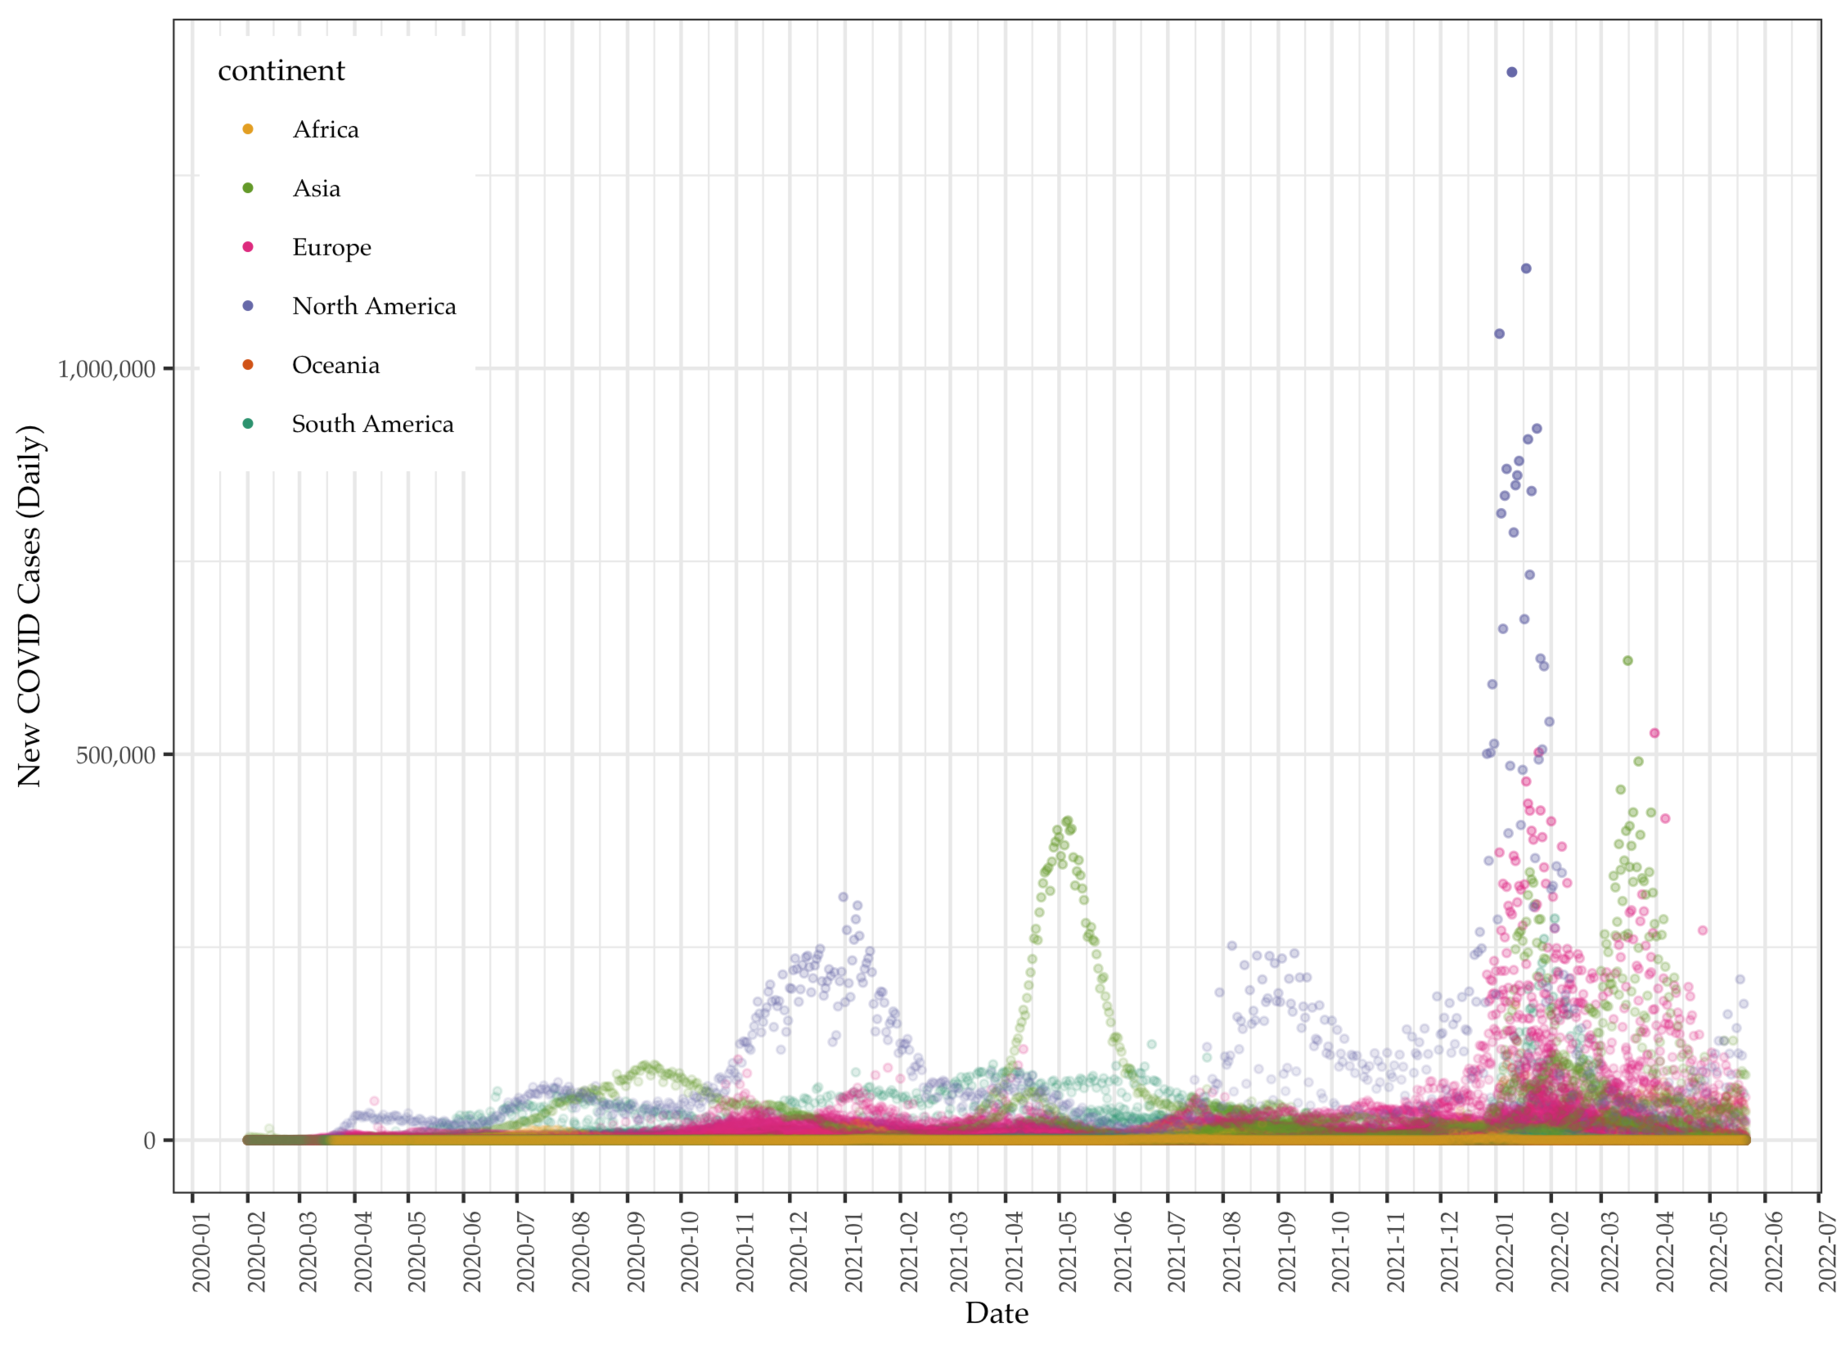
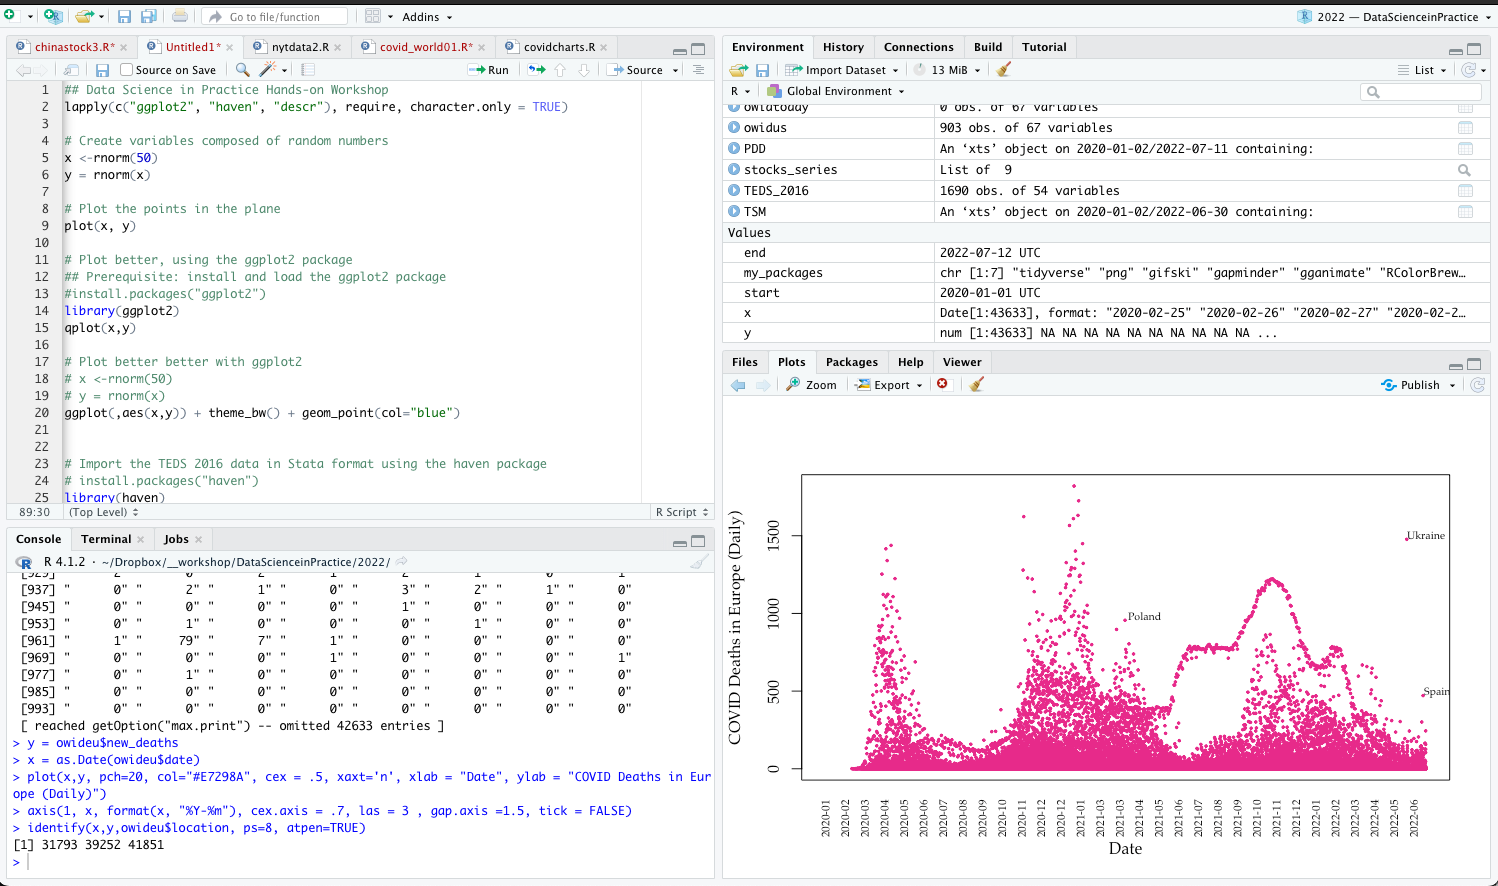
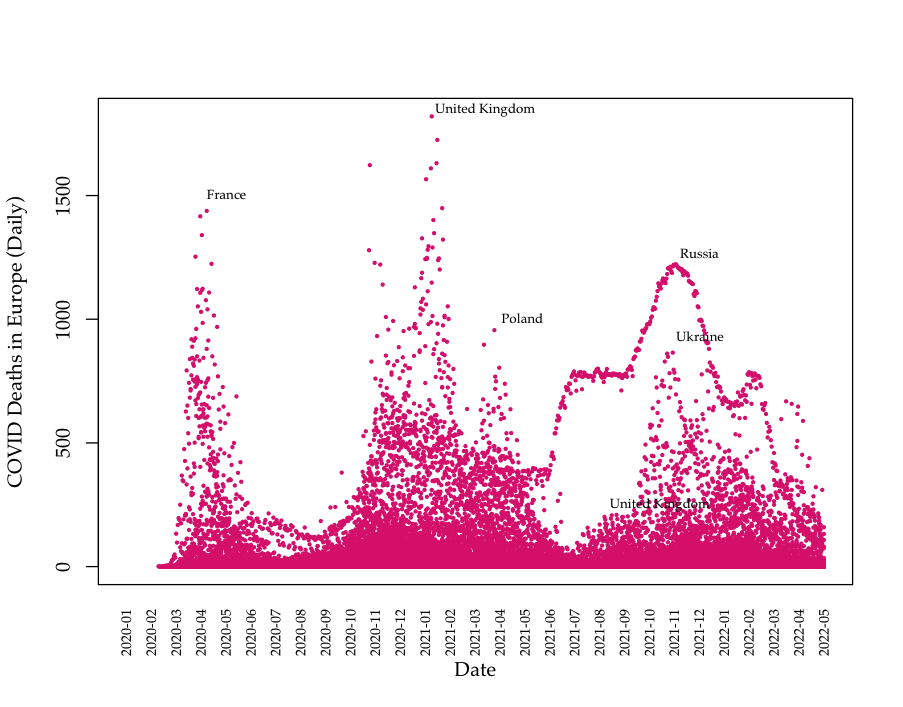
Data: Daily COVID deaths
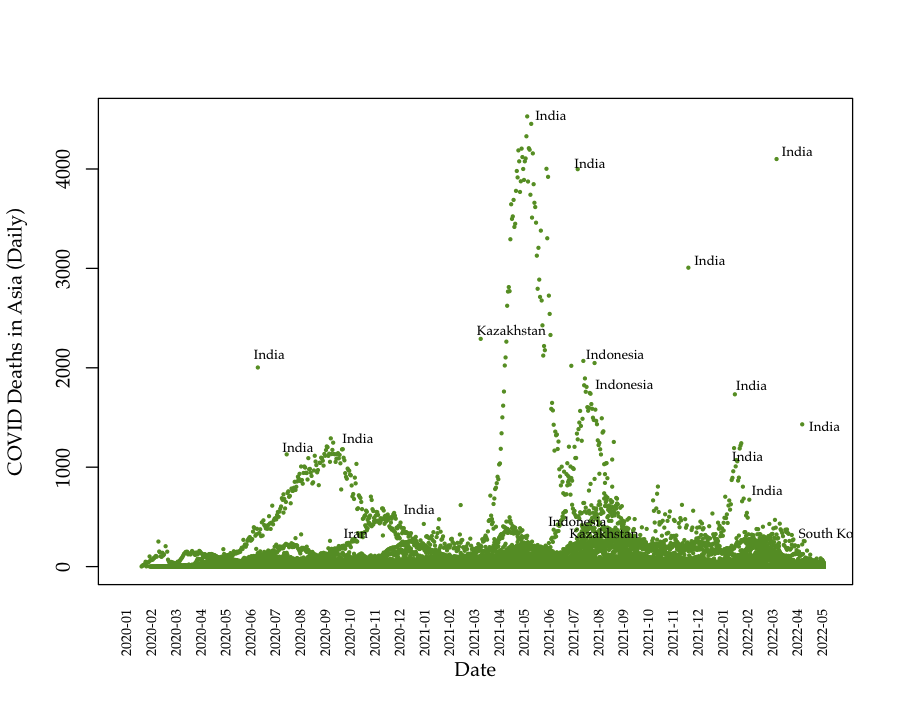
Data: Death data (Asia)
Data: Death data (Europe)
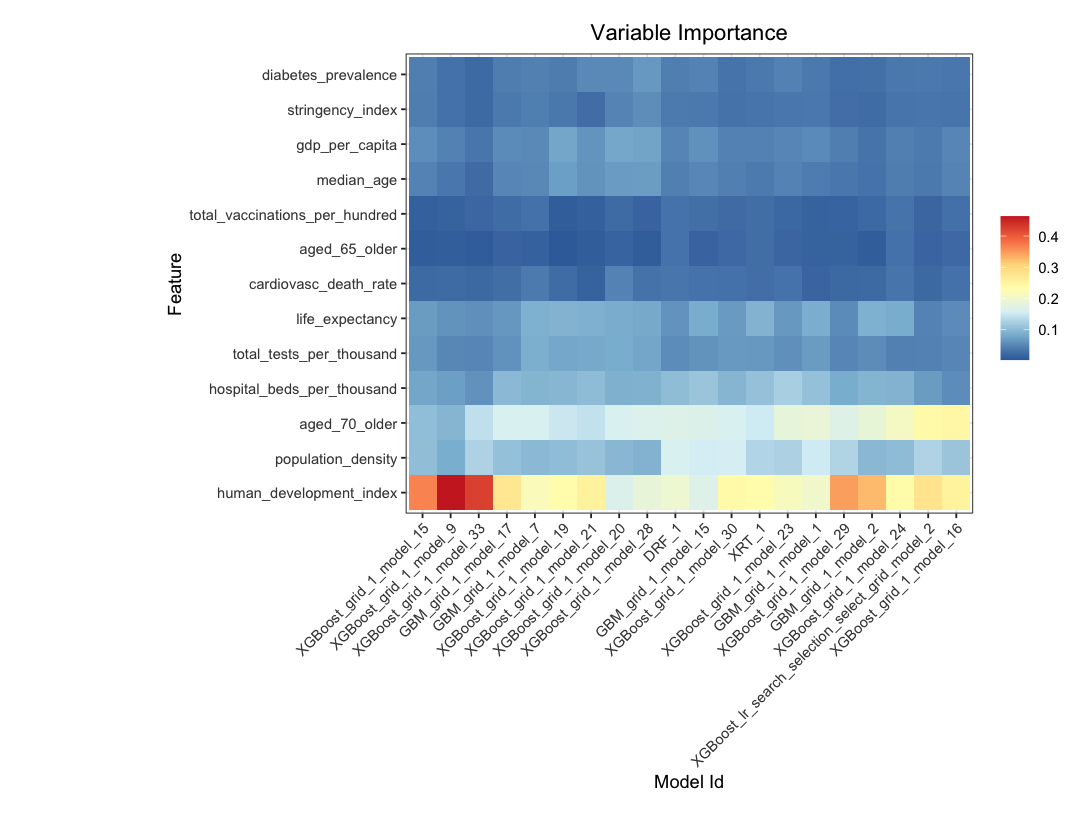
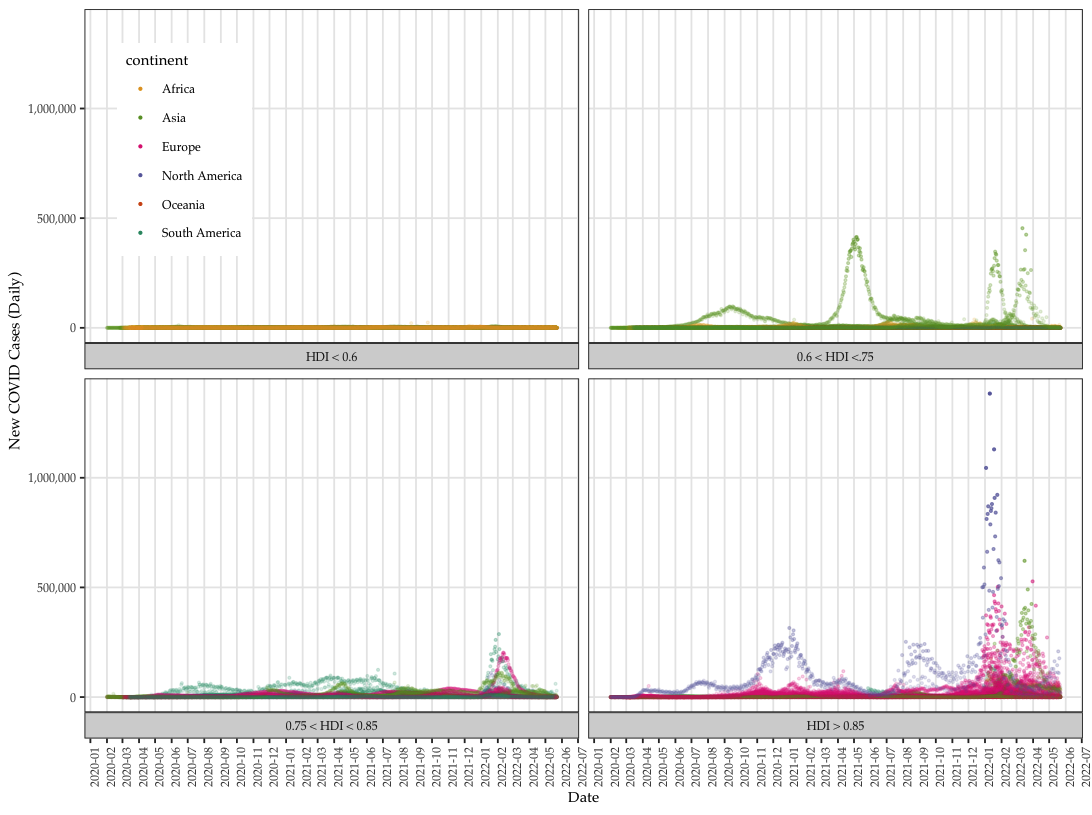
Data: COVID cases~predictors
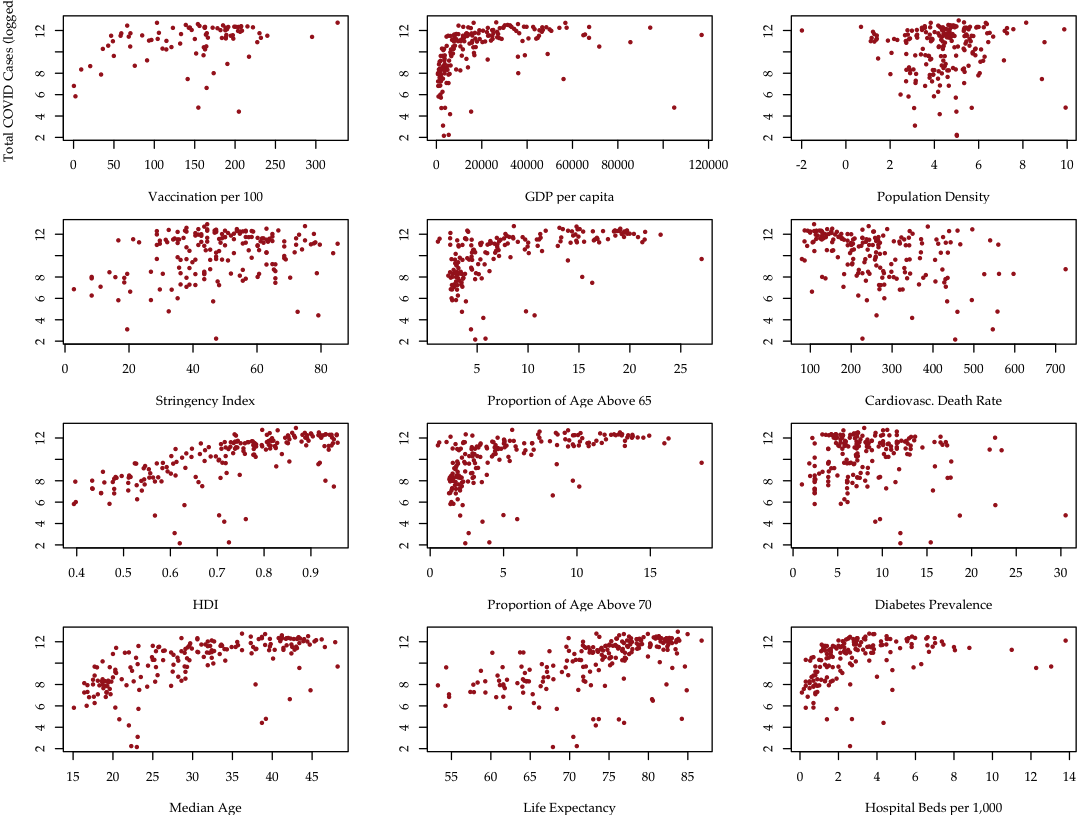
Data: COVID cases~predictors
Automated Machine Learning
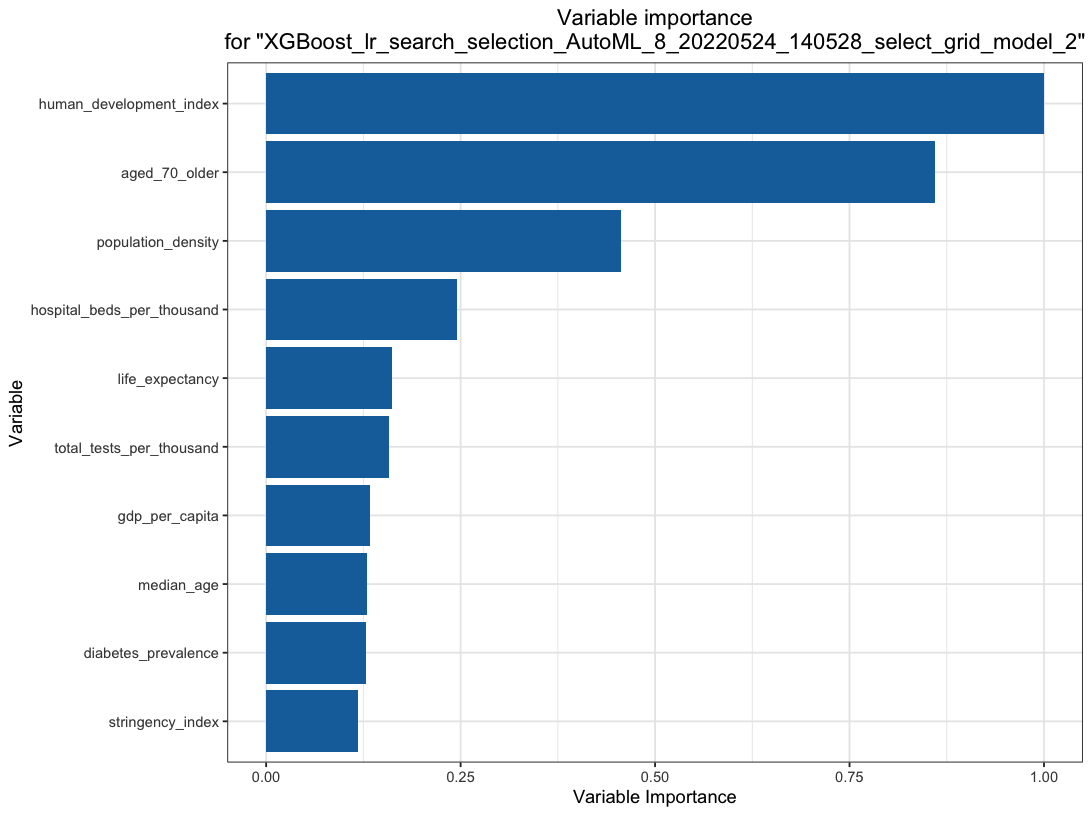
Automated Machine Learning
Automated Machine Learning
Assignment 2
-
Download the R program in class GitHub (under datascience/codes)
-
DPR_coviddata1.R
-
-
Can you download Taiwan and Germany COVID data in last three years?
-
Plot the data using the sample codes (use plot and ggplot2 functions)
Assignment 3
-
Download the R program in class GitHub (under datascience/codes)
-
DPR_caret01.R
-
-
Can you predict the chance of Tsai winning including additional variable "indep" (support for Taiwan's independence")?
-
What is the new accuracy? Better or worse?
Assignment 4 (optional for AP)
-
Download the R program in class GitHub (under codes)
-
DPR_tuber01.R
-
-
Can you download channel and video data from “中天新聞” and “關鍵時刻”?
-
Can you create WordClouds for selected video from each channel?
Illustration: Scraping YouTube data
This workshop demonstrates how to collect YouTube data using:
- API method (with Google developer account)
Illustration: Collecting YouTube data
This workshop demonstrates how to collect YouTube data using Google API:
Link to RStudio Cloud:
https://rstudio.cloud/project/4631380
- Need a GitHub and RStudio Account
Link to class GitHub:
Wordcloud using YouTube data
Wordcloud using YouTube data

Illustration: Scraping Twitter data (deprecated)
This workshop demonstrates how to collect Twitter data using:
- API method (with Twitter developer account)
- Non-API method (using Python-based twint)
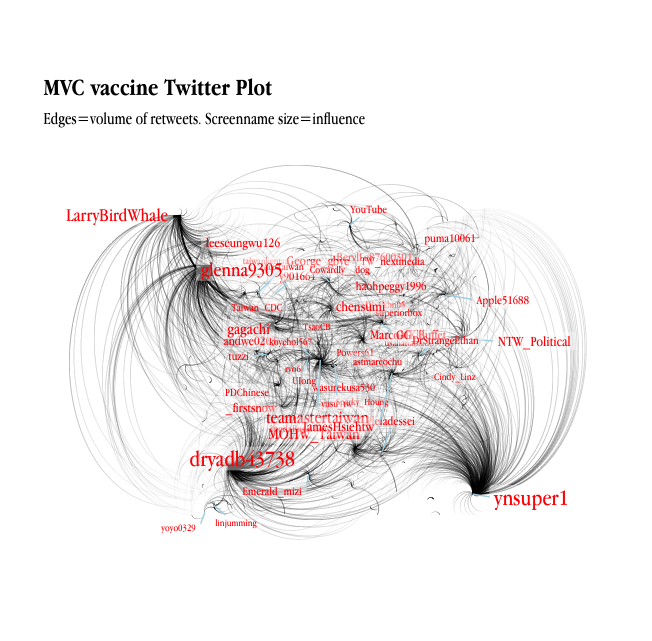
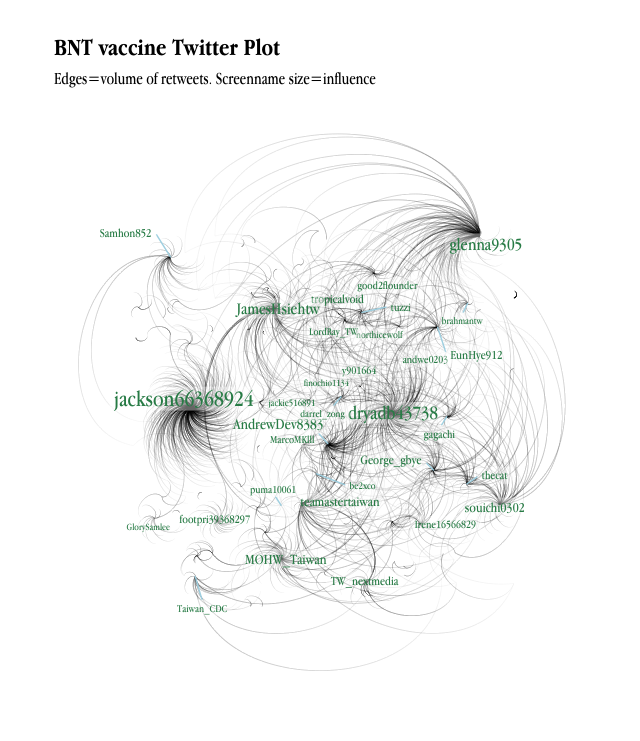
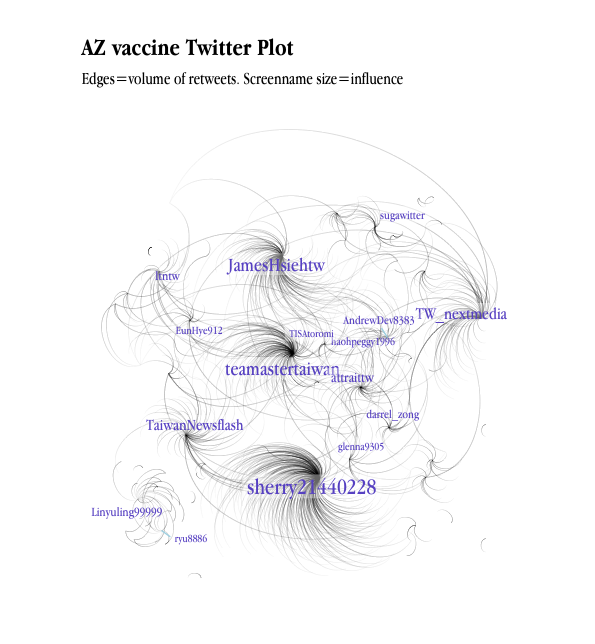
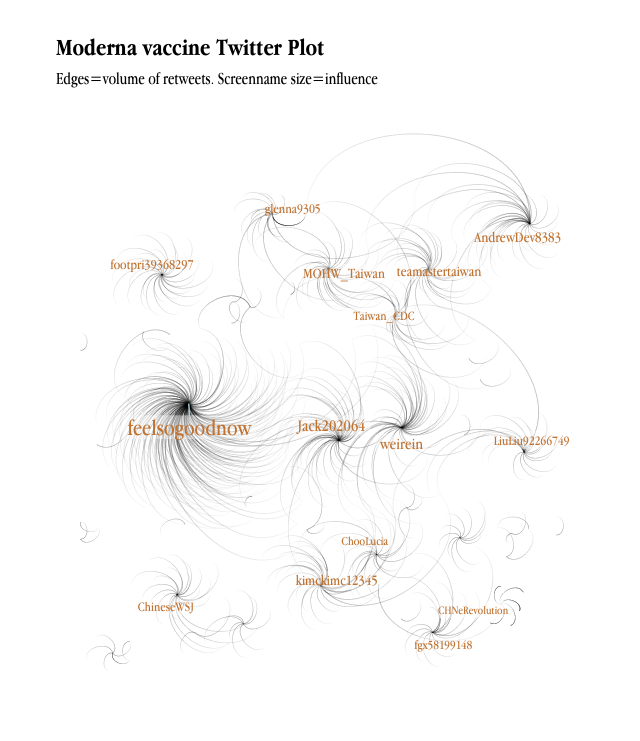
Analytics using Twitter data
Analytics using Twitter data
Ask me anything!