Large Science Models:
A General Framework for Generative Modeling of Microbiome-Metabolome systems
Ishanu Chattopadhyay, PhD
Assistant Professor of Biomedical Informatics & Computer Science
University of Kentucky




first wave
rule-based systems
second wave
Big Data / ML / Deep Learning
recognize patterns, make predictions, might improve over time, but struggle on tasks not trained for
third wave
contextual reasoning, generelizable models, stepping towards true intelligence


- Control Systems
- Screening for complex diseases
- Digital Twins in biology & medicine
- Modeling of human behavior
- Large Science Models
- Robotics
- Self-organization of sensor networks
- data smashing
- inverse Gillespie
PhD
Postdoc
ZeDLAB



Mechanical Engineering MS, PhD
Mathematics MA
Computer Sc
Medicine

Career Trajectory
ZeDLAB

Biomedical Informatics
Collaborators
Gary Hunninghake, Pulmonary C, Harvard


Robert Gibbons, Bio-statistics

Peter Smith, Pediatrics

Michael Msall Pediatrics

Fernando Martinez, Pulmonary Critical Care, Weill Cornell

James Mastrianni, Neurology

James Evans, sociology

Erika Claud, Pediatrics

Andrew Limper Mayo Clinic
Department of Pediatrics
UChicago
Department of Neurology & The Memory Center
UChicago
Department of Psychiatry
UChicago
Pulmonary Critical Care, Weill Cornell
Department of Anesthesia and Critical Care
UChicago
Center for Health Statistics
UChicago
Pulmonary Critical Care, Harvard Medical School
Department of Psychiatry
UIC
Demon Network, Exeter, Alan Turing Institute, UK
Dalhousie University, Canada
Pritzker School of Molecular ENgineering
Social Science
UChicago
Collaborations



D3M (I2O)
PAI (DSO)
PREEMPT (BTO)
YFA (DSO)
NIA
~3.5M USD in 5 years
Pre-UK Funding
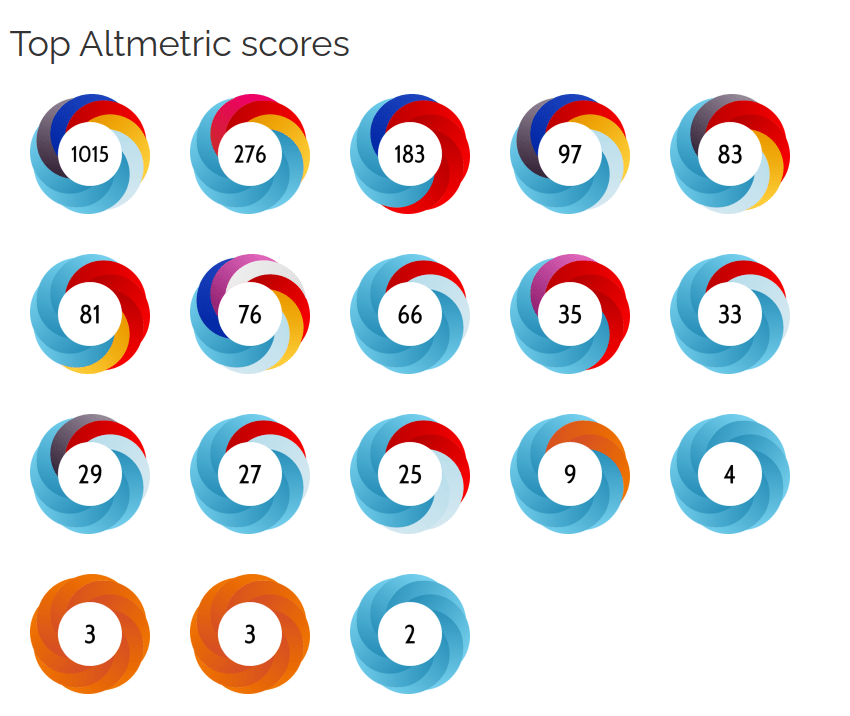
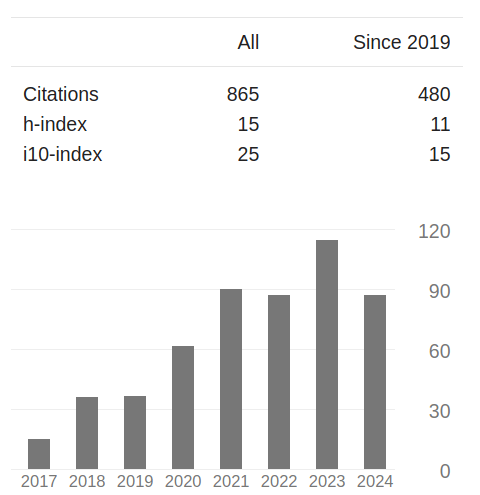
Publications
&
Impact
Nature Medicine
Nature Human Behavior
Nature Commun-ication
Science Advances
(3)
PNAS
JAMA
JAHA
JACC
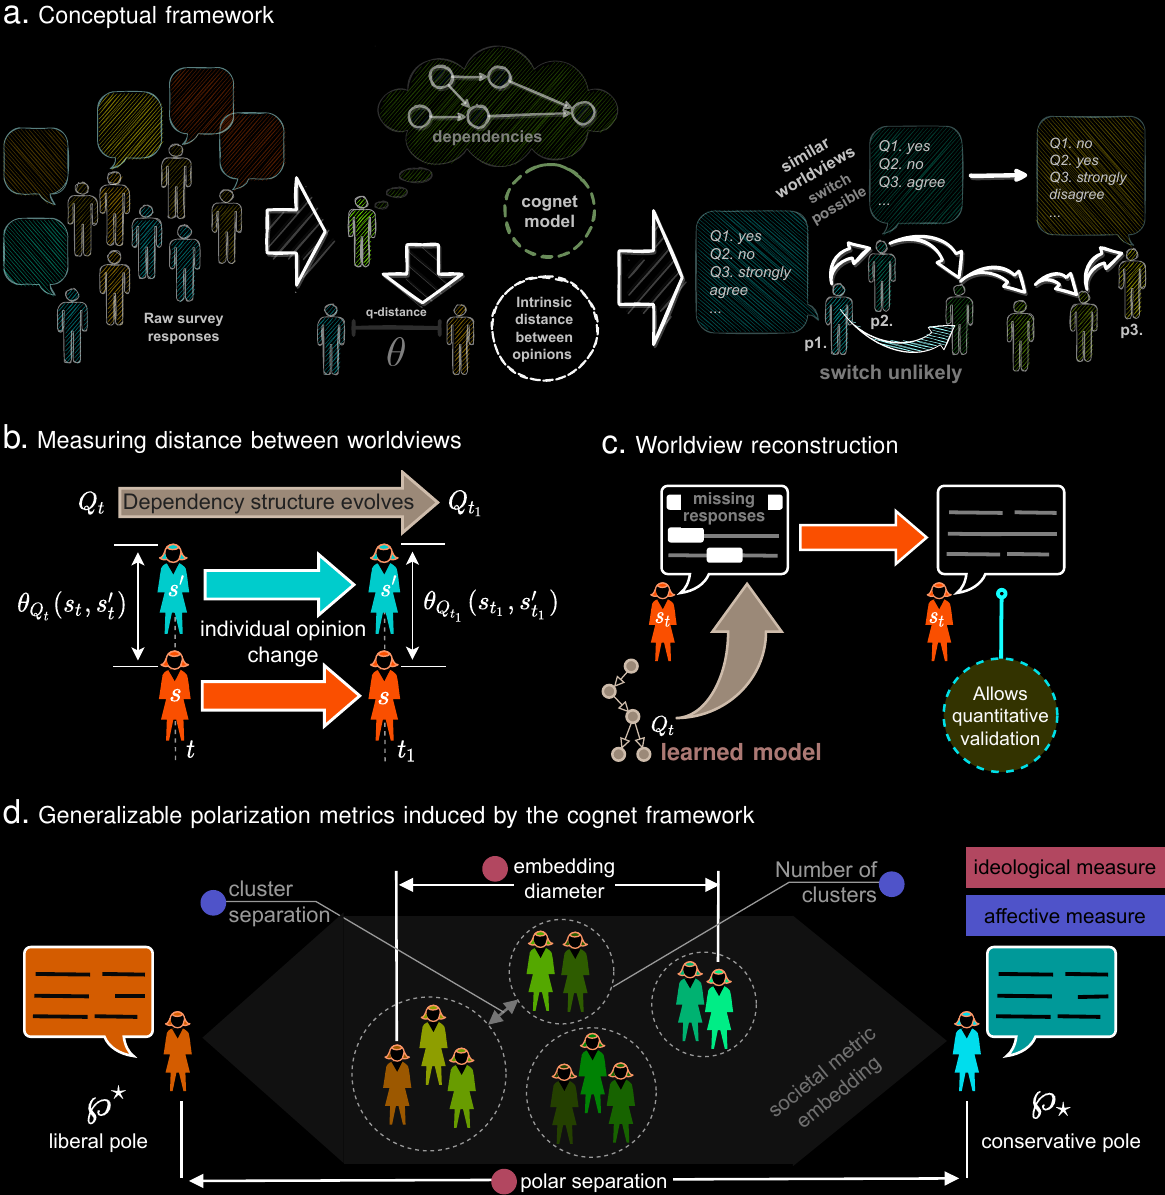
Modeling & predicting complex social interactions
Point-of-care screening for complex diseases
Ai
Electronic Healthcare Record
IPF
ASD
ADRD

Research Thrusts
General framework for inferring digital twins in biology and medicine

- Universal point-of-care screening via AI-driven pattern recognition
- No new tests or blood-work
- Uses routine data (EHR) already in patient file
- No specific data demands
- Generalizable in future to other targets beyond PF, ILAs

CKD
ILD
ZeBRA

ICD
Enable early diagnosis
Target PF/IPF or ILDs broadly
Seamless background integration with Epic workflows
Primary care
*Onishchenko, Dmytro, Robert J. Marlowe, Che G. Ngufor, Louis J. Faust, Andrew H. Limper, Gary M. Hunninghake, Fernando J. Martinez, and Ishanu Chattopadhyay. "Screening for idiopathic pulmonary fibrosis using comorbidity signatures in electronic health records." Nature Medicine 28, no. 10 (2022): 2107-2116.
Raising Flags before patient or their doctor notice symptoms
downstream care modulation
model published, retrospectively validated*
TimestampedDiagnostic procedural codes & prescriptions
SI/SA

Rx
Px
ZeBRA: Method for Individualized Future-Risk State Inference and Patient-Journey Phenotyping From Routine Longitudinal Health Data

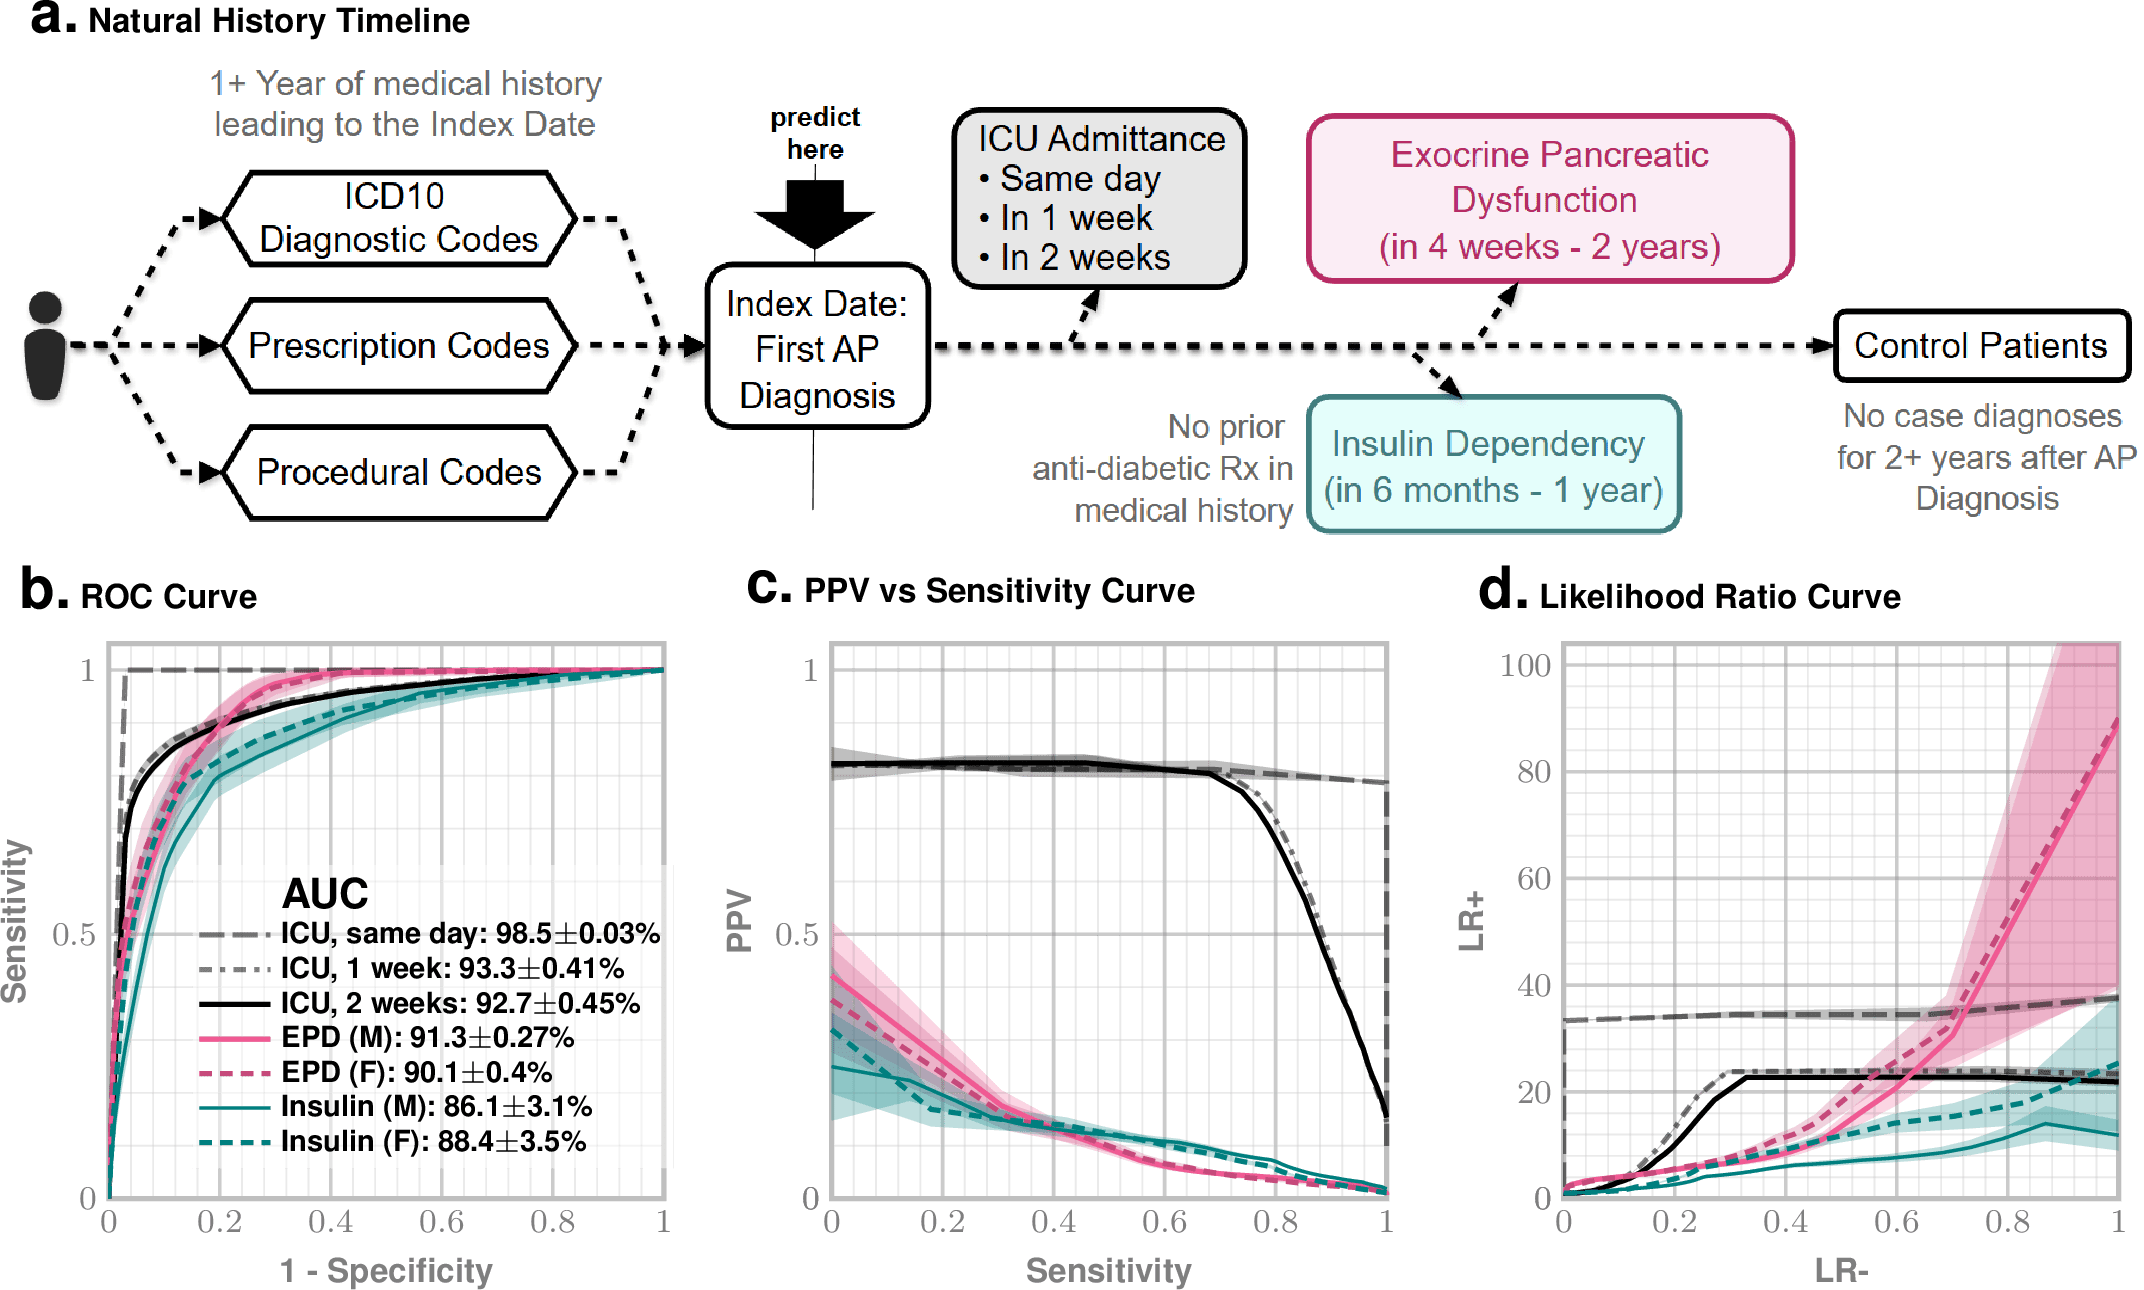
AI-driven Test-Free Prediction of ICU Admission, Insulin Dependence, and Exocrine Dysfunction after Acute Pancreatitis

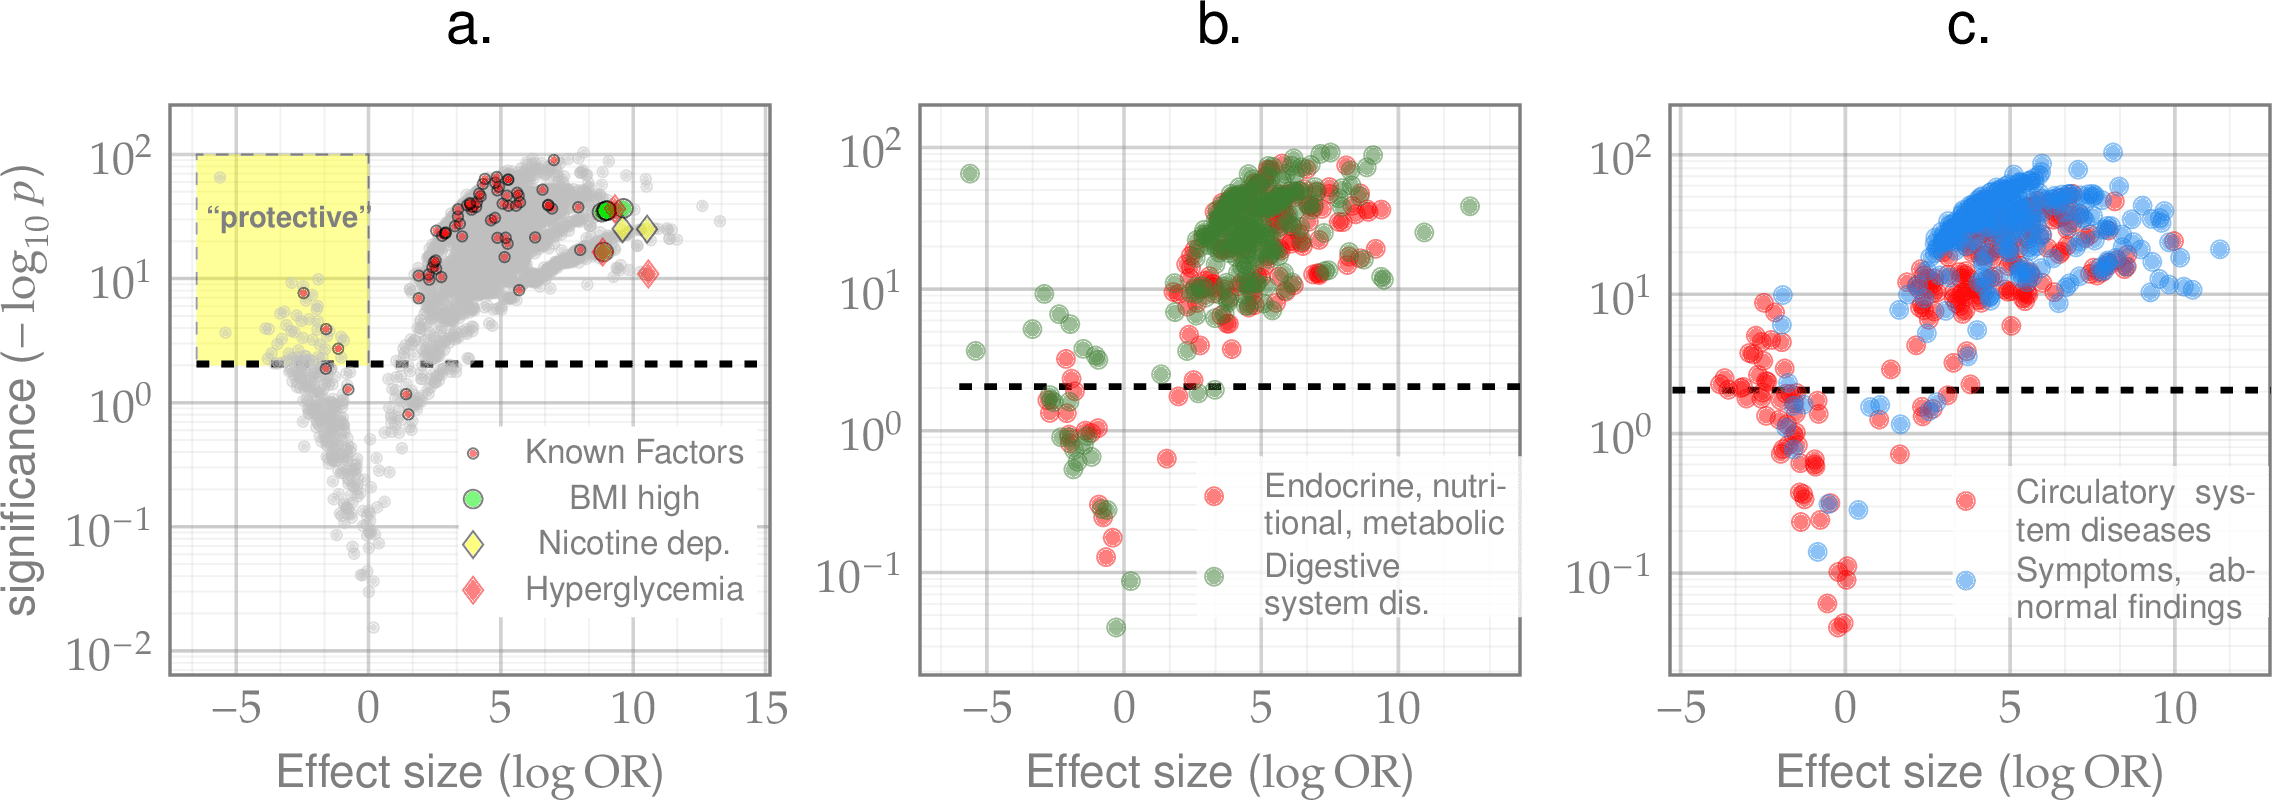
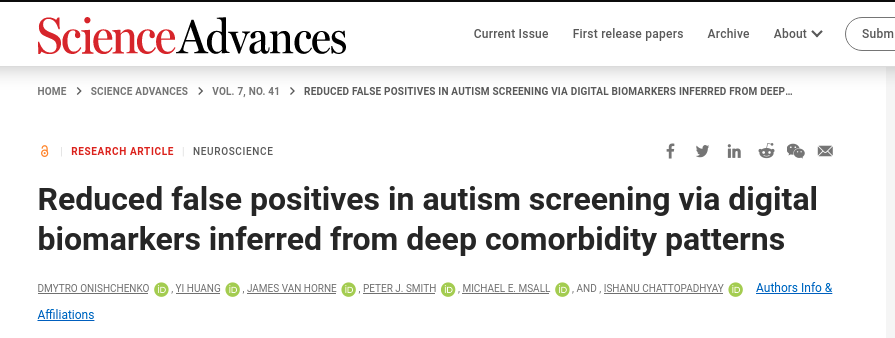

ZeBRA Publications
AI-driven Test-Free Prediction of ICU Admission, Insulin Dependence, and Exocrine Dysfunction after Acute Pancreatitis






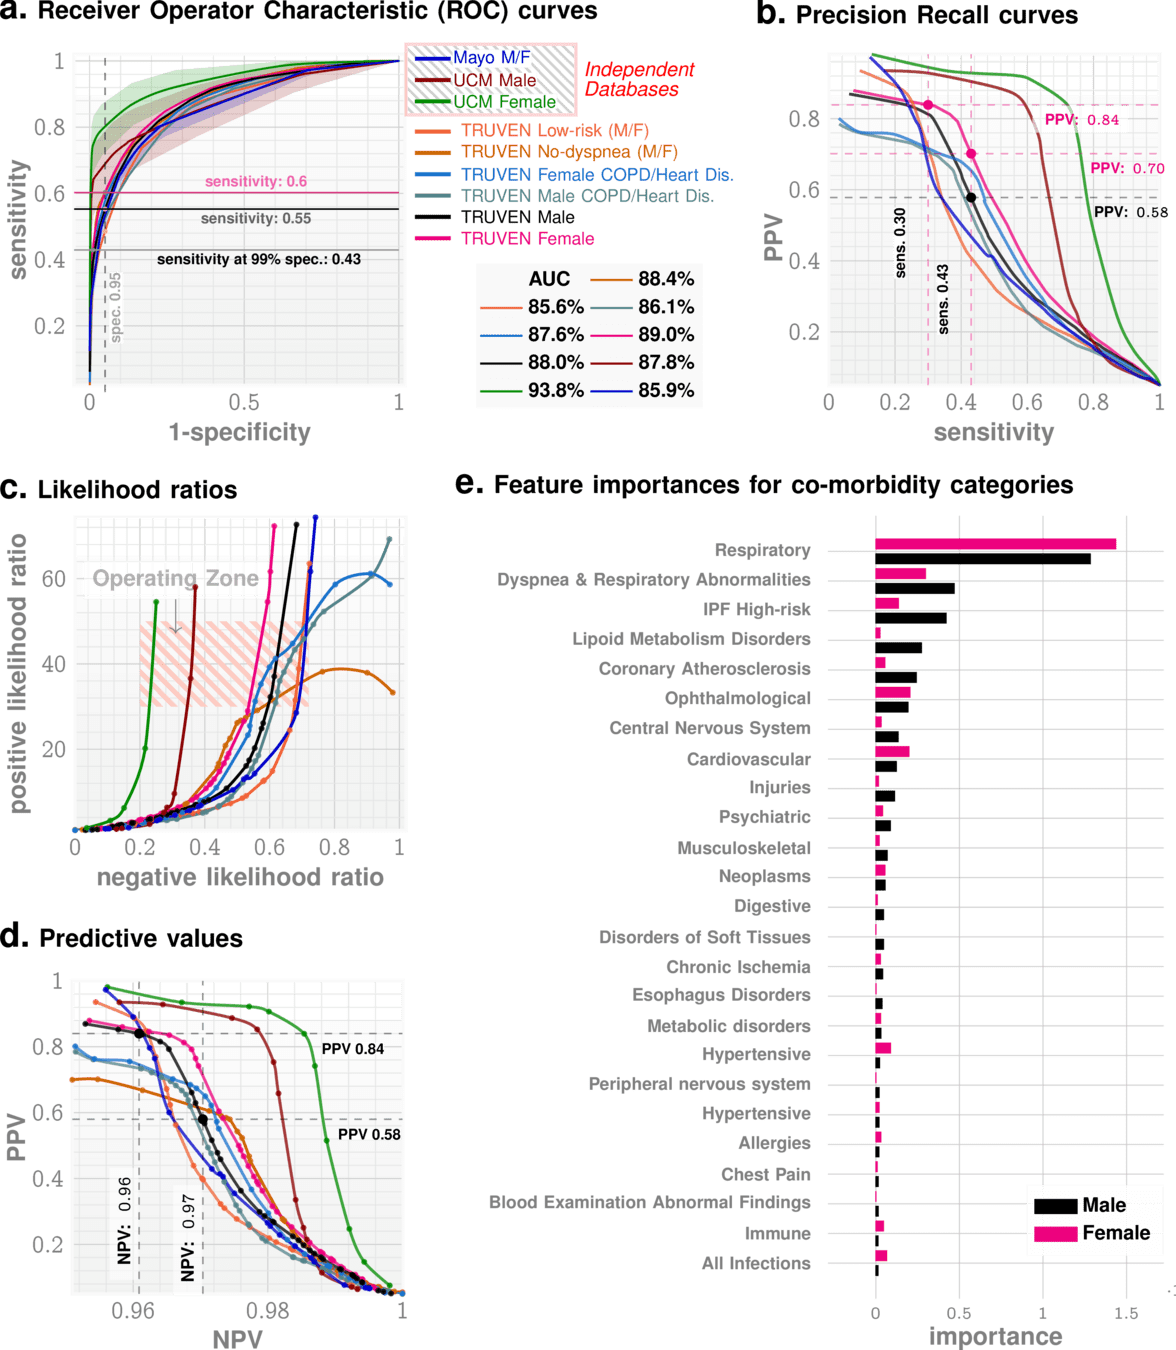
Predictive Performance (PF)*
High AUC across high and low risk sub-cohorts
Highlights:
- 1 yr out AUC ~88%
- Positive Likelihood ration ~40
*Onishchenko, D., Marlowe, R.J., Ngufor, C.G. et al. Screening for idiopathic pulmonary fibrosis using comorbidity signatures in electronic health records. Nat Med 28, 2107–2116 (2022). https://doi.org/10.1038/s41591-022-02010-y
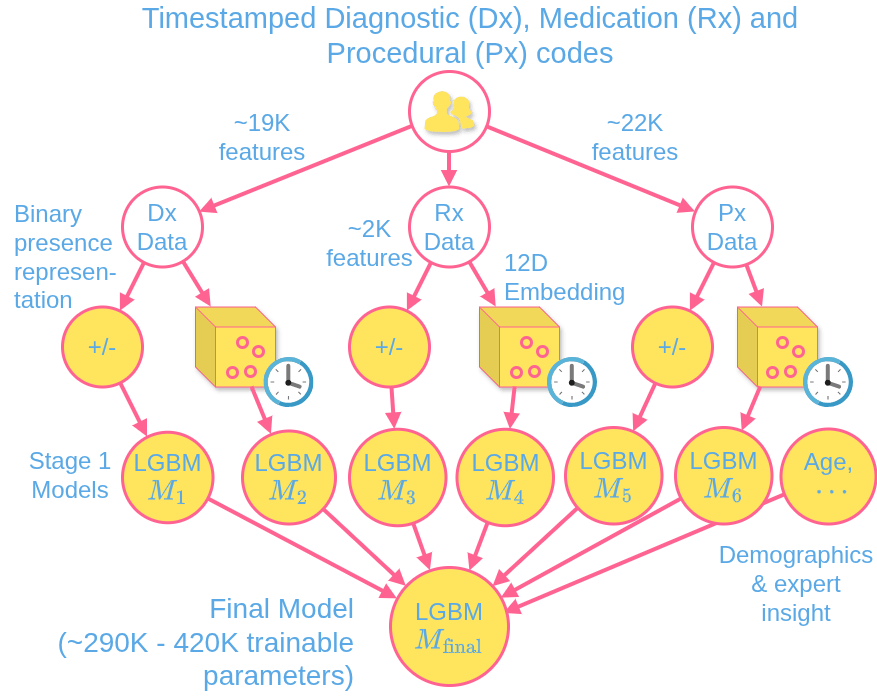
Model
Interstitial Lung Disease (ILD)
US prevalence: 1 in 500 (higher by 1.5X-2X in KY)
IPF prevalence: 10-25% of ILD
Age group: 50-85 years old
Observation window:
1+ years of records
Prediction window: 1 year
Used dataset size:
Case: 25.4k, Control: 15.1M
Performance (95% Specificity):
Males:
AUC 82.2% (82.0%, 82.5%)
Sensitivity 39.7% (39.3%, 40.1%)
Positive LR: 7.81 (7.85, 8.01)
Negative LR: 0.64 (0.64, 0.63)
Females:
AUC 82.1% (81.8%, 82.3%)
Sensitivity 39.1% (38.7%, 39.5%)
Positive LR: 7.77 (7.74, 7.90)
Negative LR: 0.64 (0.65, 0.64)
Current validation results (MarketScan)
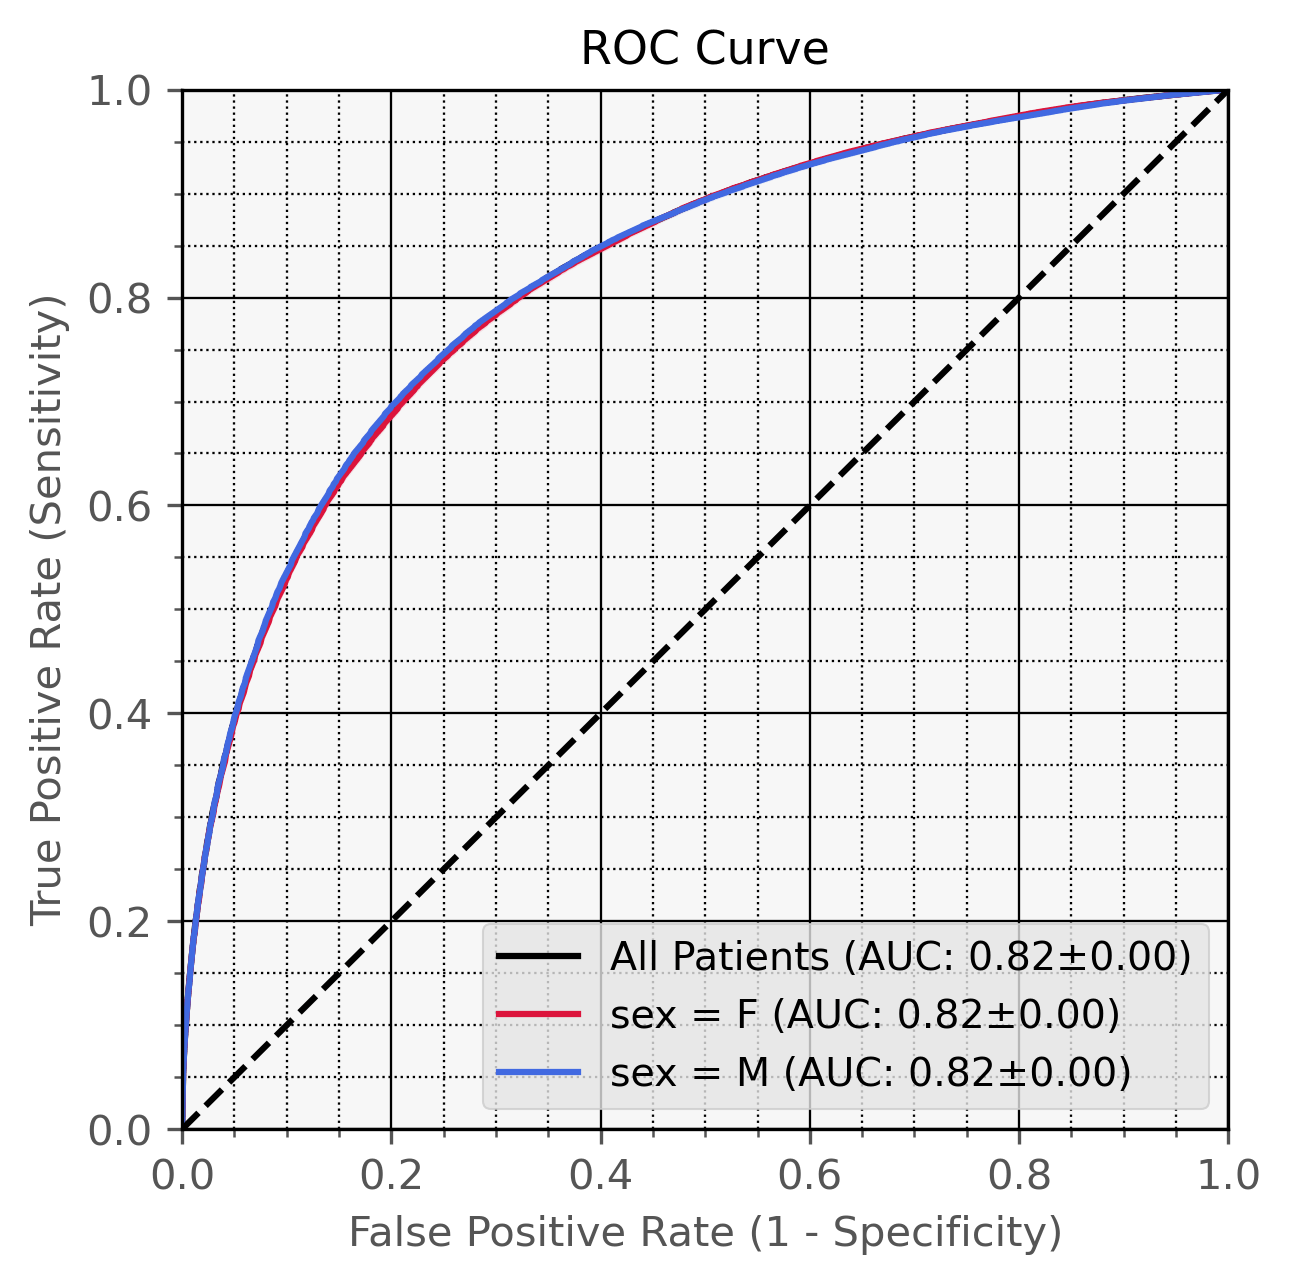
ILD
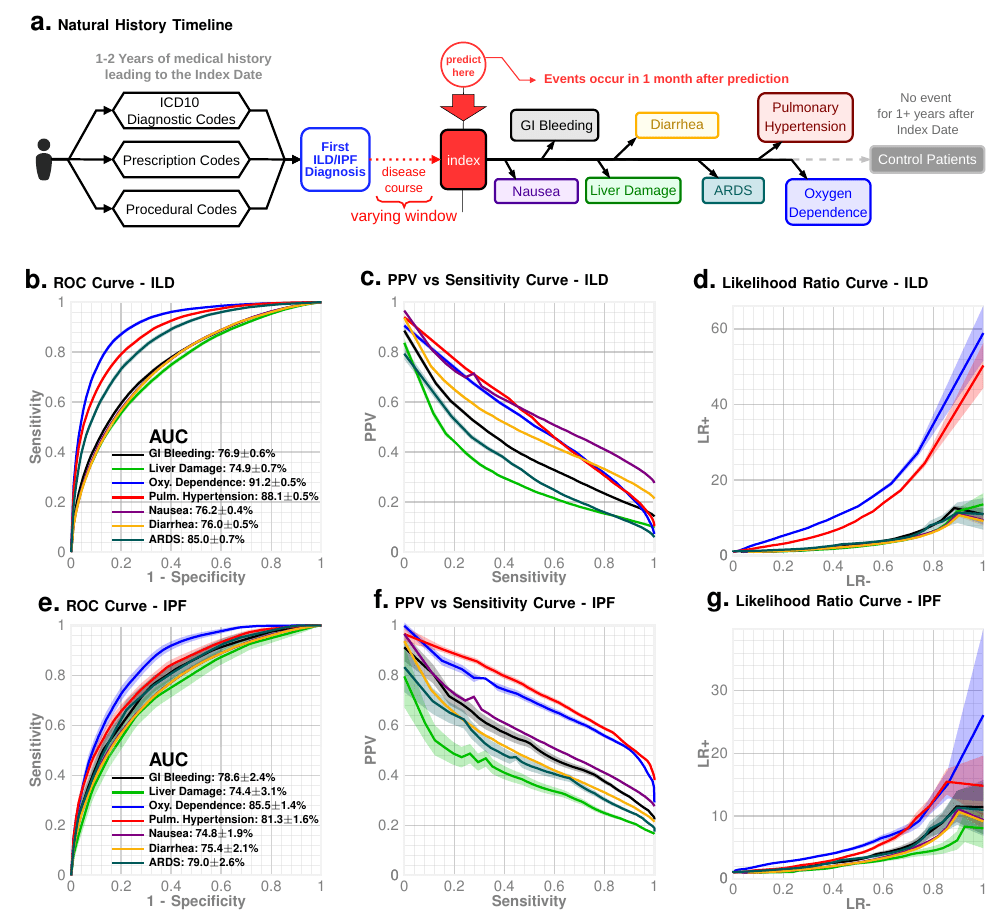
Natural history of ILD progression: Predicting key events in patient journey
High AUCs.
High PPV: 1-2 false positive for every true flag
Interstitial Lung Disease (ILD)
US prevalence: 1 in 500
| 95% specificity/39% sensitivity | 99% specificity/17% sensitivity | 99.5% specificity/12.5% sensitivity | |
|---|---|---|---|
| Additional ILD diagnoses from ZeBRA | 546 | 238 | 175 |
| Total ILD diagnoses per year with ZeBRA | 746 | 438 | 375 |
| Additional transplant-eligible patients with ZeBRA | 164 | 71 | 53 |
| Expected False Positives | 29,930 | 5,986 | 2,993 |
| Net annual contribution margin* | $46,613,500 | $12,706,700 | $7,703,350 |
|---|
Case Study: University of Kentucky Heath-care (UKHC)
Patient population: 600K unique patients per year
Current ILD diagnoses: 200 per year
* diagnostic workup margin (CT+PFT): $950, lunng transplant contribution margin: $120,000, incremental program operating cost: -$1.5M
| Target | AUC |
|---|---|
| Frailty / Physical Debility | 96.2% |
| Alzheimer's Disease and Related Dementia (ADRD) | 93.4% |
| Chronic Fatigue Syndrome / ME | 93.2% |
| Acute Pancreatitis: ICU Visit | 92.3% |
| Chronic Pancreatitis: Exocrine Pancreatic Insufficiency | 92.1% |
| Idiopathic Pulmonary Fibrosis (IPF) | 91.6% |
| Sarcopenia | 91.0% |
| Parkinson's Disease | 87.9% |
| Dementia / Degenerative Neurologic Disease | 87.8% |
| Acute Pancreatitis: Insulin Dependence | 87.2% |
| Suicide Attempts / Suicidal Ideations (Males 50--75) | 86.0% |
| Chronic Inflammation | 85.9% |
| Heart Failure with Preserved Ejection Fraction (HFpEF) | 84.9% |
| Suicide Attempts / Suicidal Ideations (Males 25--50) | 84.0% |
| Interstitial Lung Diseases (ILD) | 82.2% |
| Age-related Macular Degeneration | 82.1% |
| Autism Spectrum Disorder (ASD) | 81.8% |
| Chronic Kidney Disease (CKD) | 81.8% |
| Cerebral Infarction | 81.1% |
| Chronic Obstructive Pulmonary Disease (COPD) | 81.0% |
| Major Depressive Disorder | 80.5% |
| Myocardial Infarction / Cardiac Arrest post-arthroplasty | 80.1% |
| CKD Progression to Stage 4+ | 80.1% |
| Prostate Cancer | 80.0% |
| Osteoporosis | 79.5% |
| Post-Traumatic Stress Disorder (PTSD) | 78.1% |
| Hearing Loss | 72.7% |
| Osteoarthritis | 72.5% |
| Systemic Connective Tissue Disorders | 72.0% |
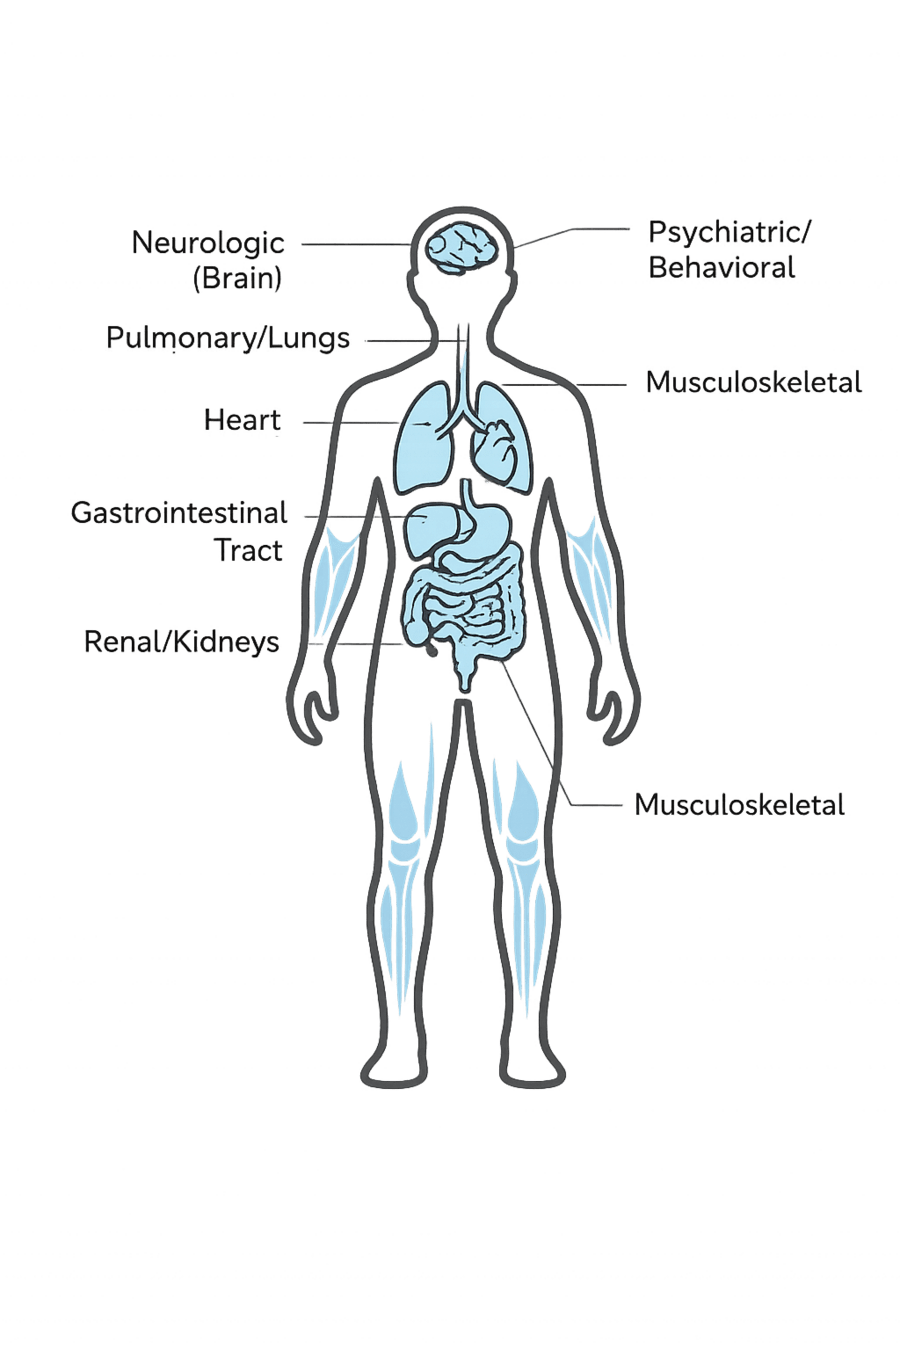
ZeBRA Model Family (expanding list)
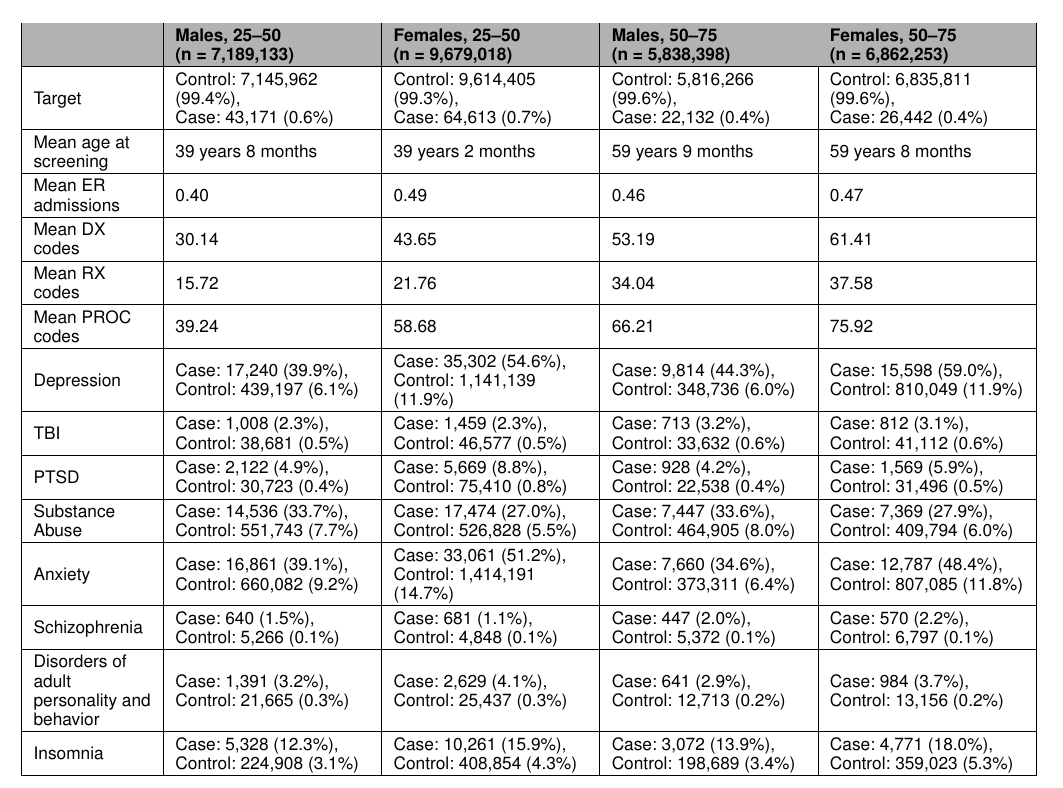
Suicidal Ideation and Self-harm Attemps: Estimating risk from routine EHR
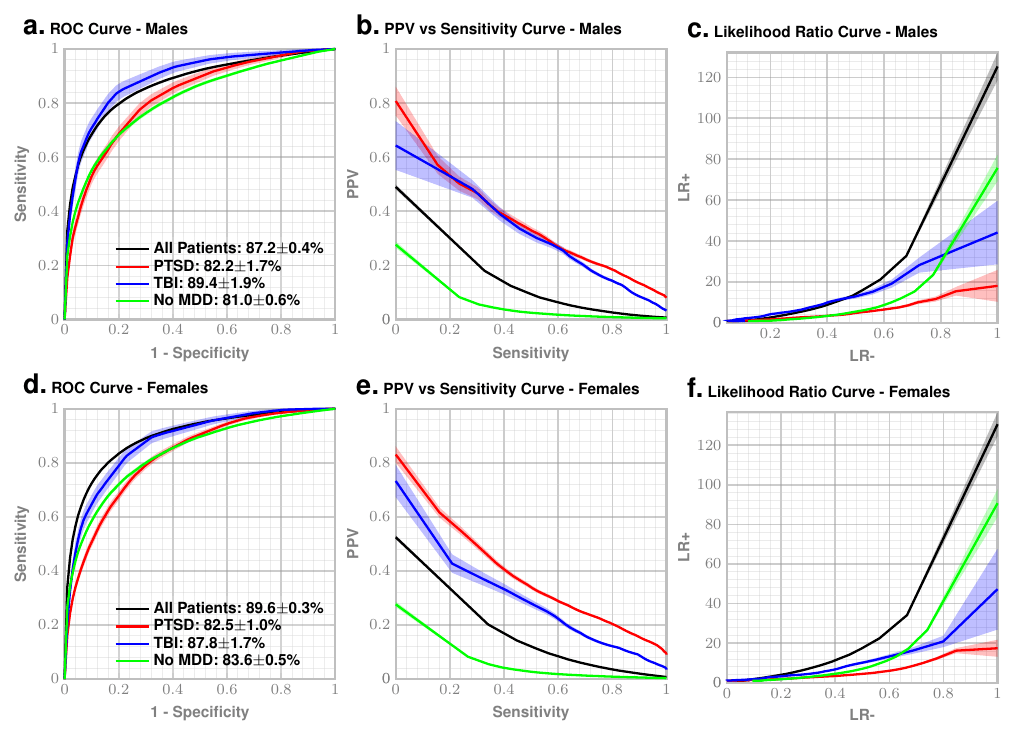
High AUCs.
High PPV: 1-2 false positive for every true flag
Suicidal Ideation and Self-harm Attemps: Estimating risk from routine EHR
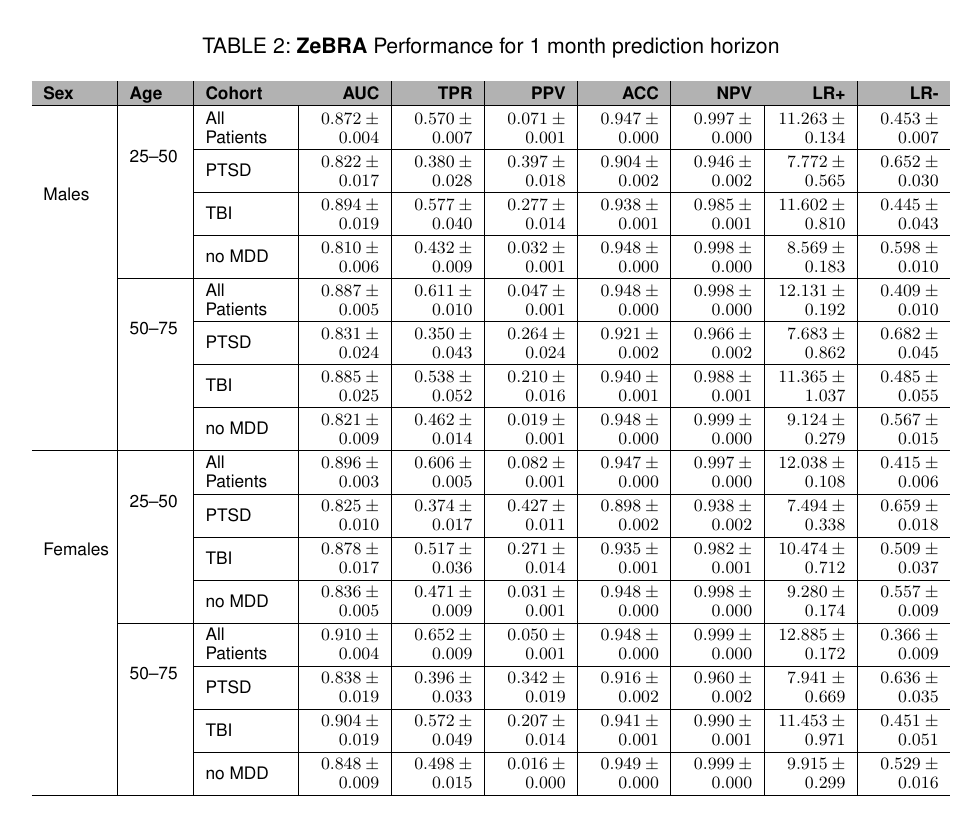
Suicidal Ideation and Self-harm Attemps: Estimating risk from routine EHR
High AUCs.
High PPV: 1-2 false positive for every true flag

~ 4yrs
current survival ~4yrs
~ 4yrs
current clinical DX
ZCoR screening



Onishchenko, D., Marlowe, R.J., Ngufor, C.G. et al. Screening for idiopathic pulmonary fibrosis using comorbidity signatures in electronic health records. Nat Med 28, 2107–2116 (2022). https://doi.org/10.1038/s41591-022-02010-y
n=~3M
AUC~90%
Likelihood ratio ~30
Alzheimer's Disease and Related Dementia*

* in press
>5 Million in US. >13 Million in next 10 years
Alzheimer's Disease and Related Dimentia
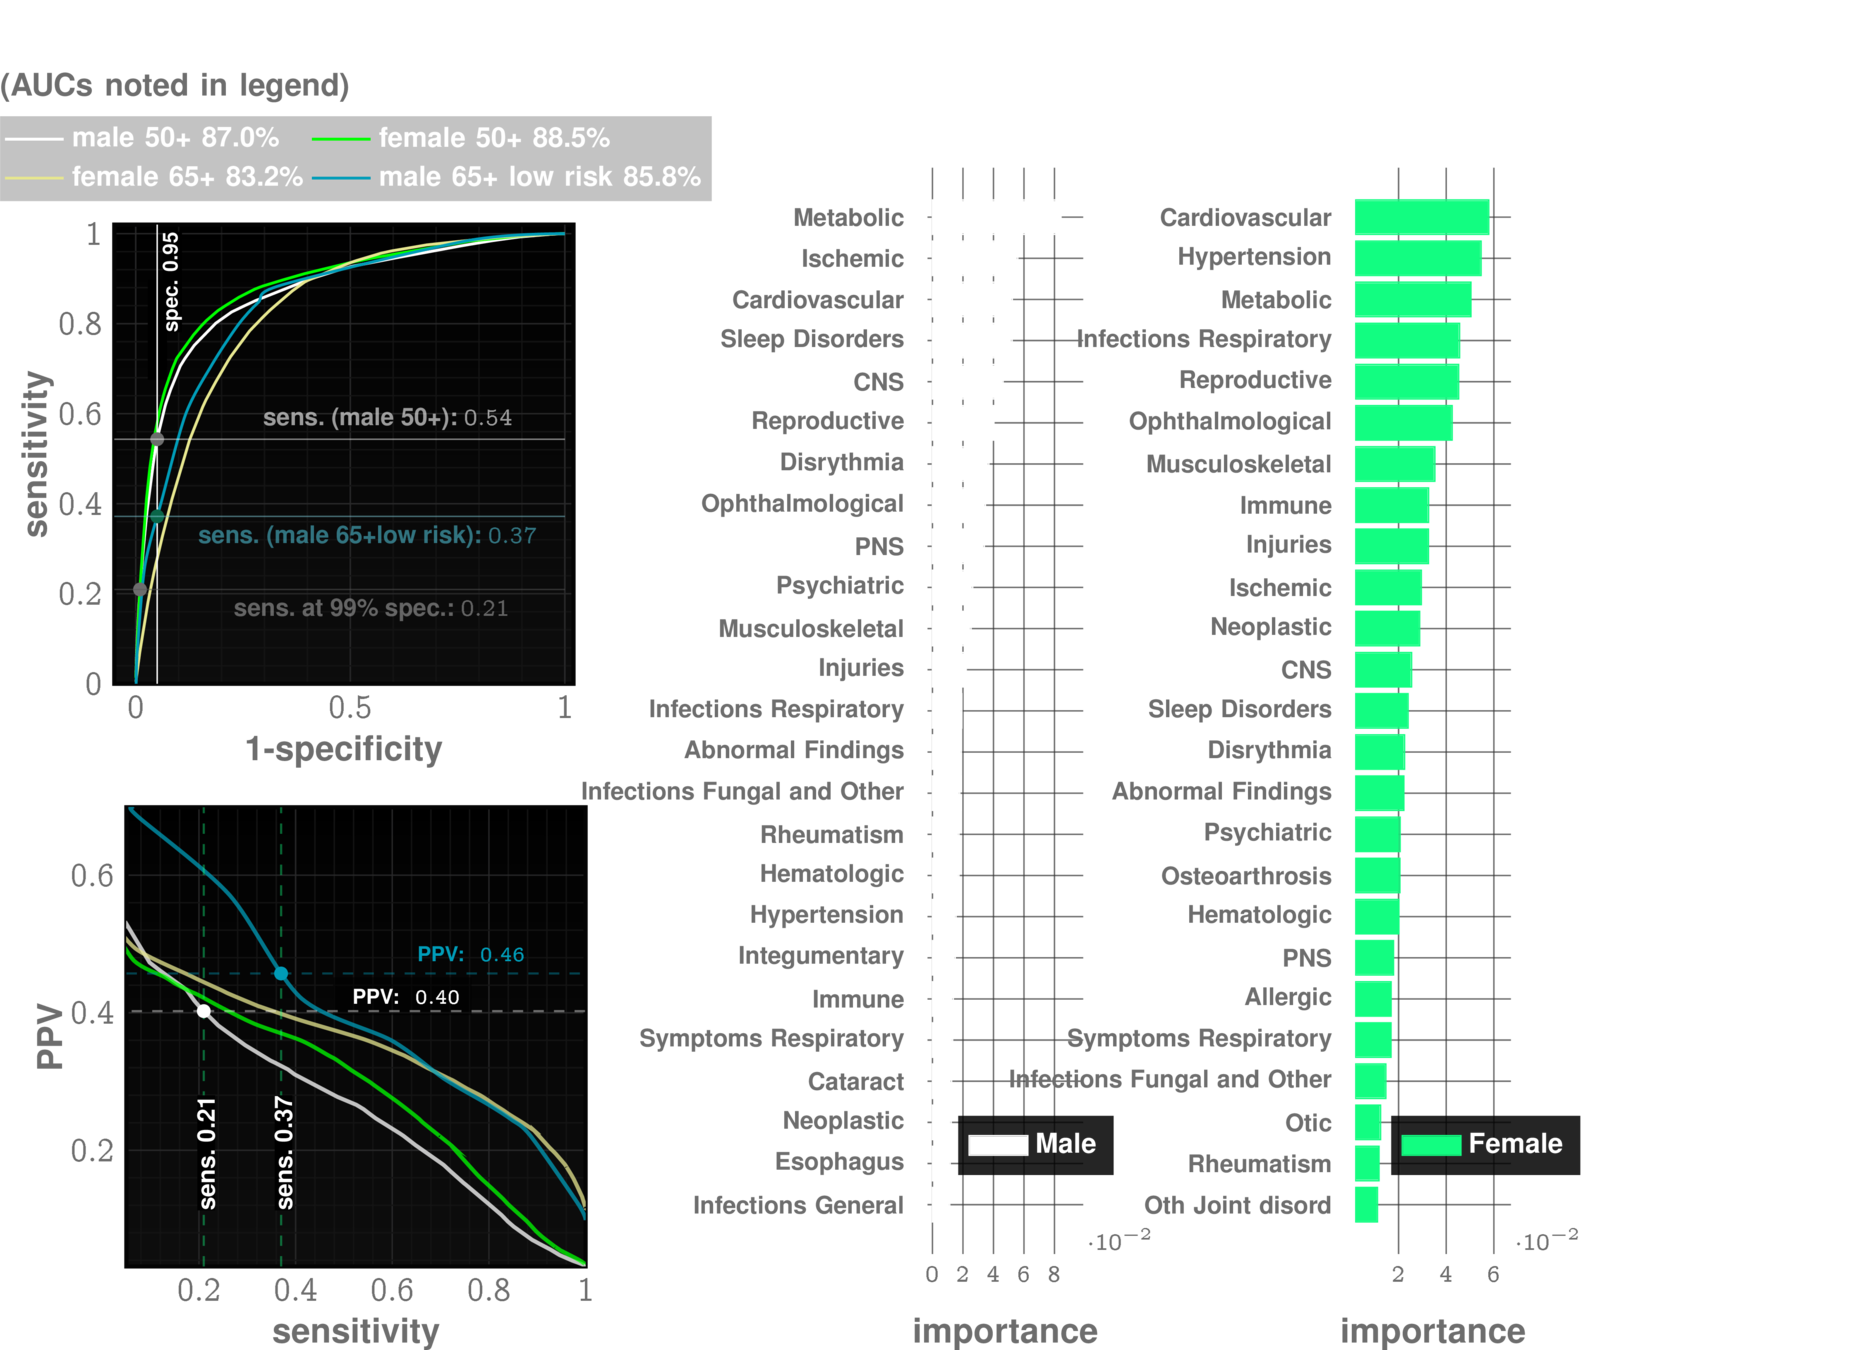
MOCA, Blood Tests
Current Practice:
state of art with EHR:
~67% AUC*
ZCoR: ~87%
Alzheimer's Disease and Related Dimentia
state of art with EHR:
~67% AUC*
ZCoR: ~87%
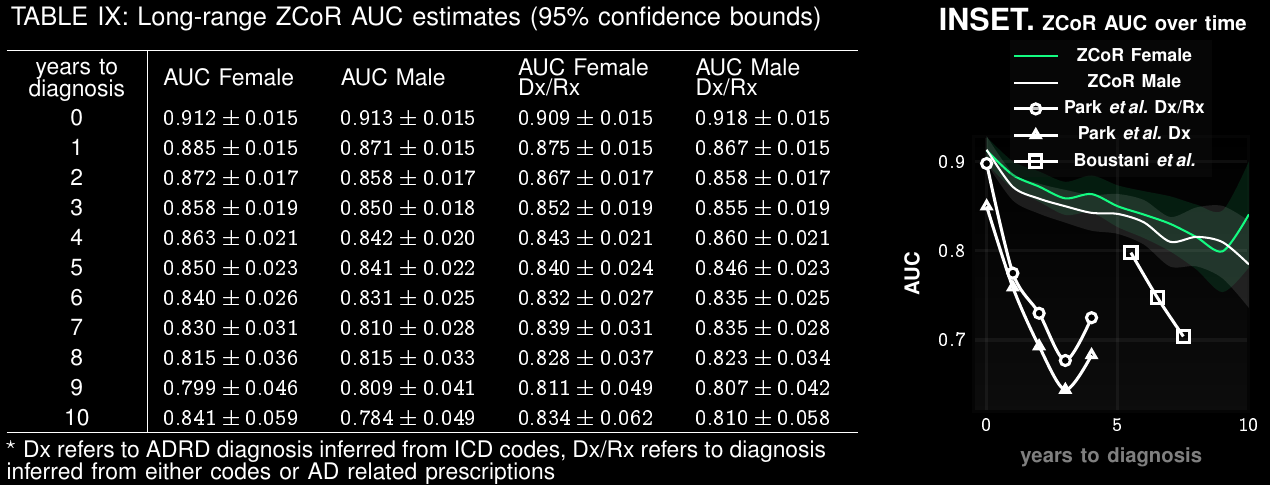
Preempting ADRD accurately upto a decade in future
Applicable To Screening for Mild Cognitive Impairment
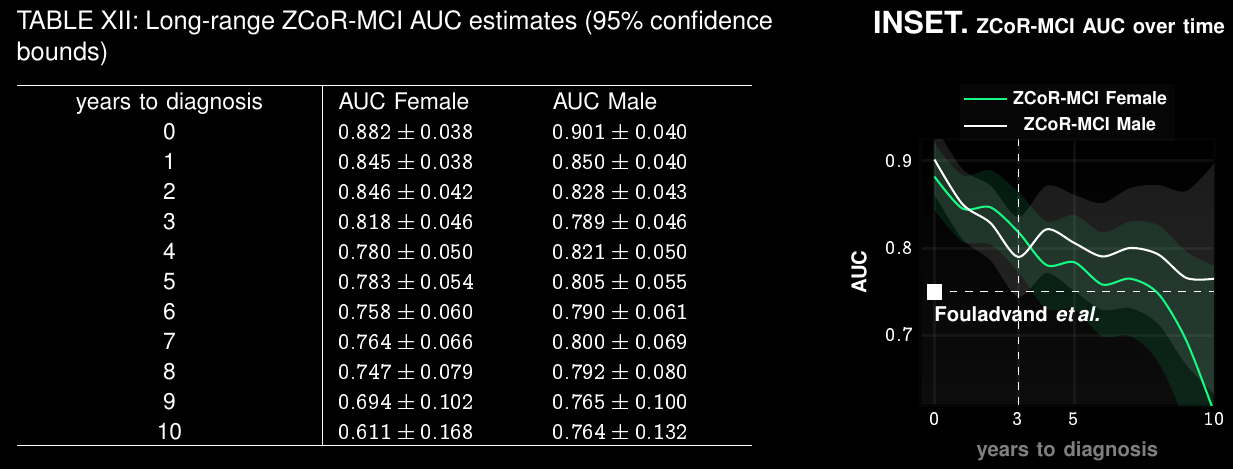
Clinical Trial Participant Selection
Current screen-failure rate: 80-90%
Estimated rate with ZCoR:
40%
Research Direction II
Digital Twins
General framework for inferring digital twins in biology and medicine
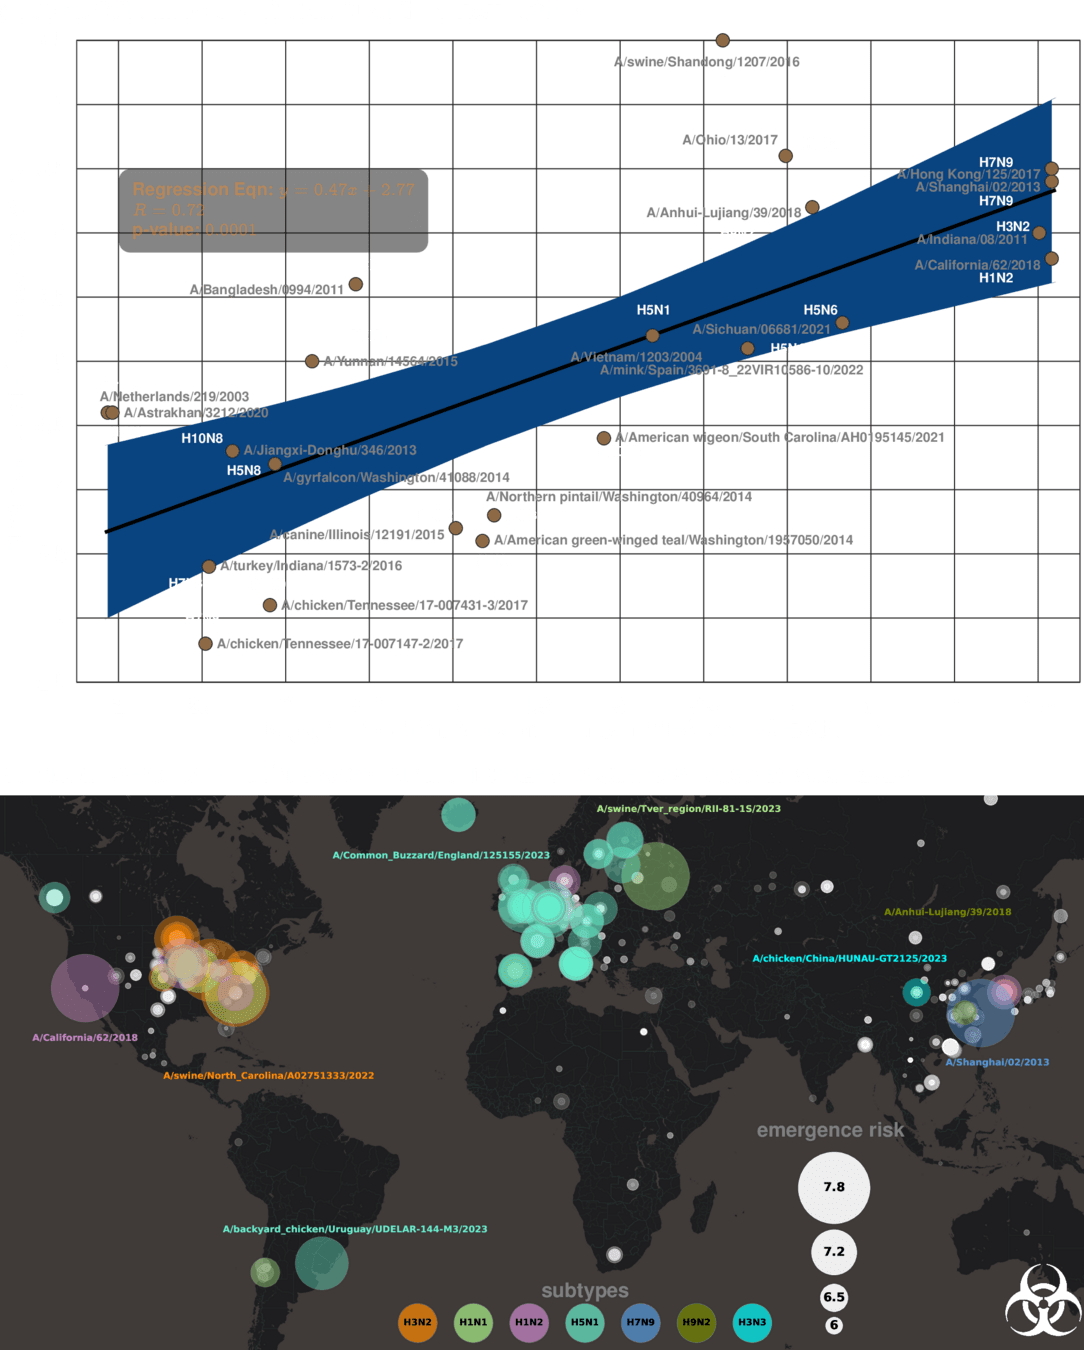
Stamping Out the Next Pandemic **Before** The First Human Infection
BioNorad
Digital Twins for complex systems
Darkome
teomims
opinion dynamics
algorithmic lie detector
Mental health diagnosis
viral emergence
microbiome
Digital Twins for complex systems
Darkome
teomims
opinion dynamics
algorithmic lie detector
Mental health diagnosis
viral emergence
microbiome
Phase 1
Phase 2

PREPARE: Pioneering Research for Early Prediction of Alzheimer's and Related Dementias EUREKA Challenge
Algorithm for early diagnosis
Find Data for early prediction
Phase 1
Phase 2

Second Prize 40,000 USD
Lets give them:
- 1M patients clinical data diagnosed with ADRD/AD 60-80 years
- 1M African-American patients from Chicagoland
- Open source - GNU public license
licensed patient data
digital twin
(generative AI)
teomims
(open cohort)
VeRITaAS
Can A Generative AI Tell if you Are Lying?
Vetting Response Integrity from
cross-Talk in Adversarial
Surveys
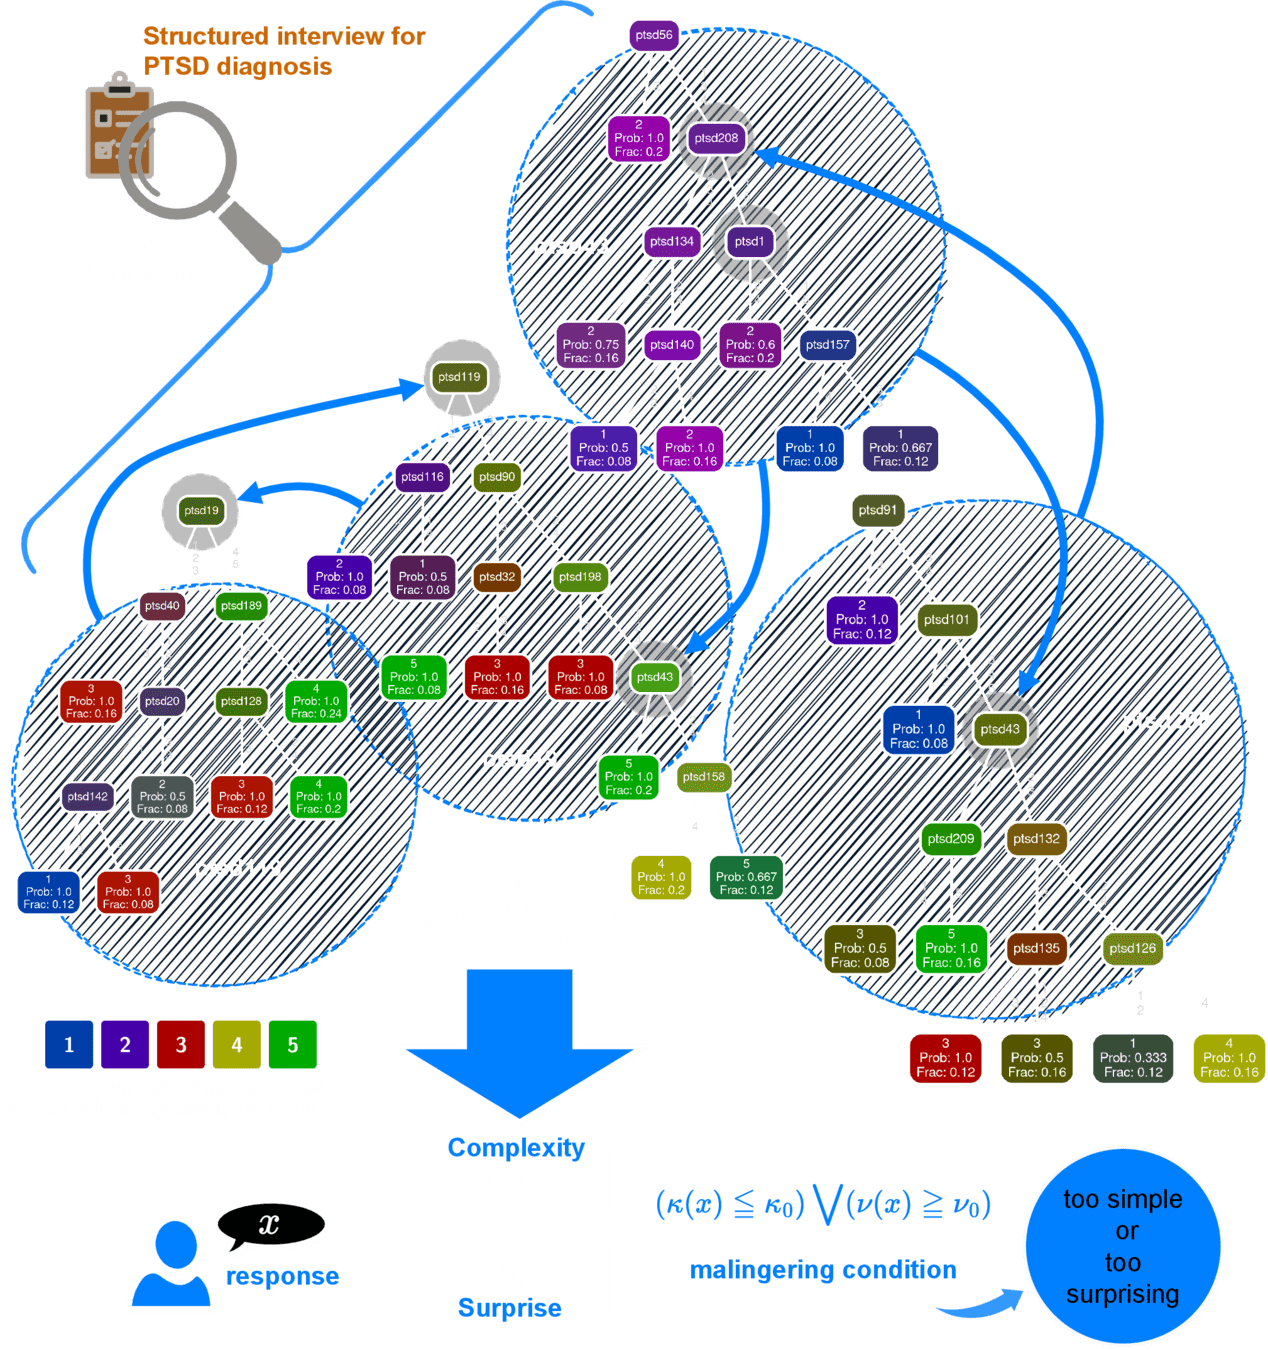
Q-Net
Hidden structure of cross-talk between responses to interview items
PTSD diagnostic interview
Number of possible responses
Minimum Performance (n=624)
Average Time: 3.5 min
No. of questions: 20
AUC > 0.95
PPV > 0.86
NPV > 0.92
At least 83.3% sensitivity at 94% specificity
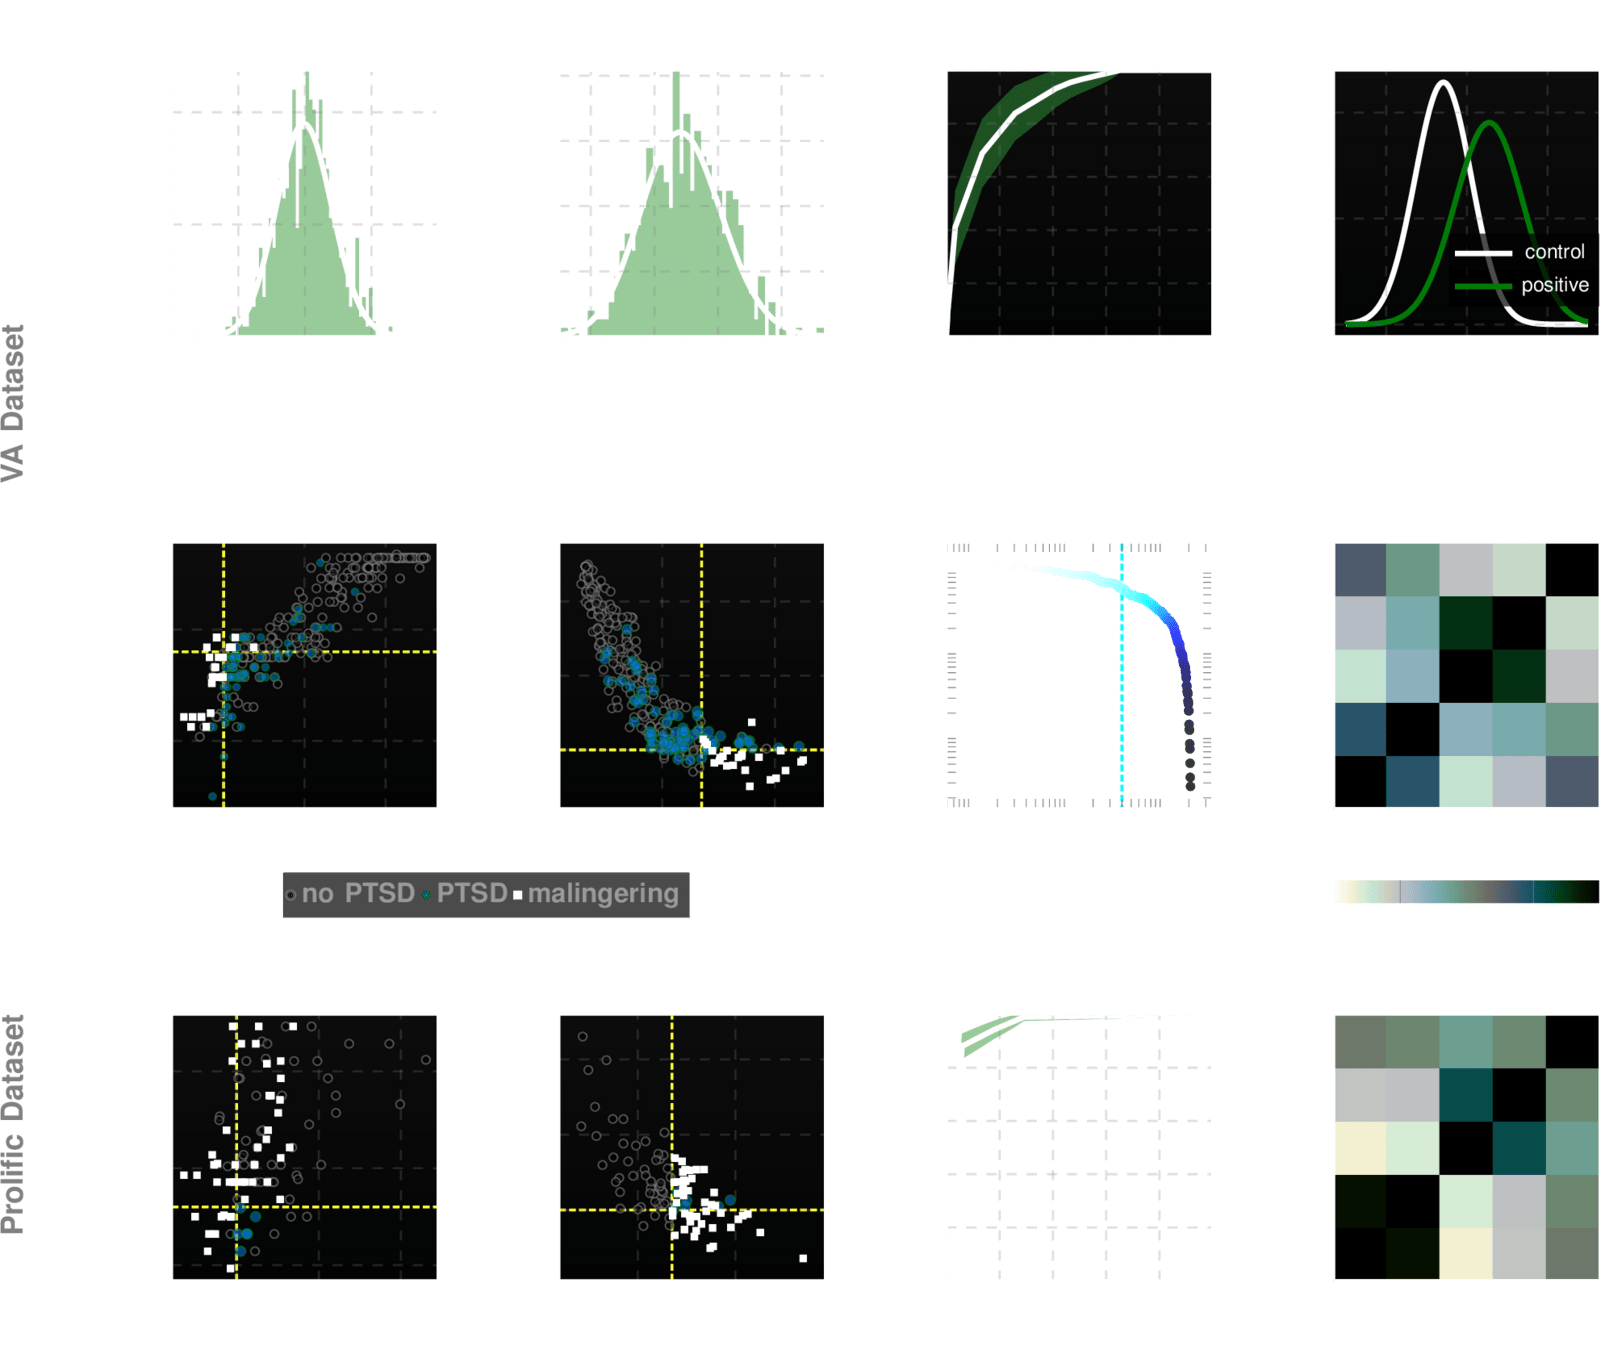
Minimum AUC = \(0.95 \pm 0.005\)
Cannot be coached, or memorized
Datasets for training & validation
1. VA (n=294)
2. Prolific (n=300)
3. Psychiatrists (n=30)
Beat the test!
200 participants in
US
100 participants in
UK
30 forensic psychiatrists
10
6
1
Can-You-Fake-PTSD Challenge Results
successful attempts
Future
Vision
- Universal screening for IPF, ADRD, autism, rare cancers
- Continuous monitoring of health
- Bio-NORAD
- Digital twins
Transform bio-surveillance
Democratize AI unleashing its power for social good
Transform early diagnosis
Transform modeling of complex systems
Impact on Popular Discourse on AI
Media Coverage
In
National Pop-culture Discourse
Interviews, Op-eds, and Forum Appearences
- Joe Rogan Podcast
- Walter Isaacson Interview
- Speaker on Pritzker Forum on Global Cities
- >150 News articles written on published papers

Rotaru, Victor, Yi Huang, Timmy Li, James Evans, and Ishanu Chattopadhyay. "Event-level prediction of urban crime reveals a signature of enforcement bias in US cities." Nature human behaviour 6, no. 8 (2022): 1056-1068.
"test-free" screening?
- Autism
- Idiopathic Pulmonary Fibrosis
- Alzheimer's Disease and related dementia
- Suicidality, PTSD
- Perioperative Cardiac Event
- Aggressive Melanoma
- Uterine Cancer
- Pancreatic Cancer


- non-existent biomarkers
- expensive, time-consuming diagnostic tests
- Lack of Universal Screening at the point of care

- Early diagnosis is difficult, late or missed diagnosis costs lives
We lack Universal Screening
for most diseases
Prognosis at Point-of-Diagnosis
- Optimizing Management
Patient Journey
- Continuous Risk Monitoring
Early Diagnosis
- Universal Screening
- Cohort Selection
Reduce screen failure rates
Holistic health surveillance
Predict antifibrotics continuation
improve outcomes
1
2
3
Interstitial Lung Disease / Pulmonary Fibrosis
Rapid Universal Point-of-care Screening for ILD/IPF Using Comorbidity Signatures in Electronic Health Records
Flag patients before they (or doctors) suspect

Primary Care
Pulmonologist
Zero-burden Co-morbid Risk Score (ZCoR)
Referral
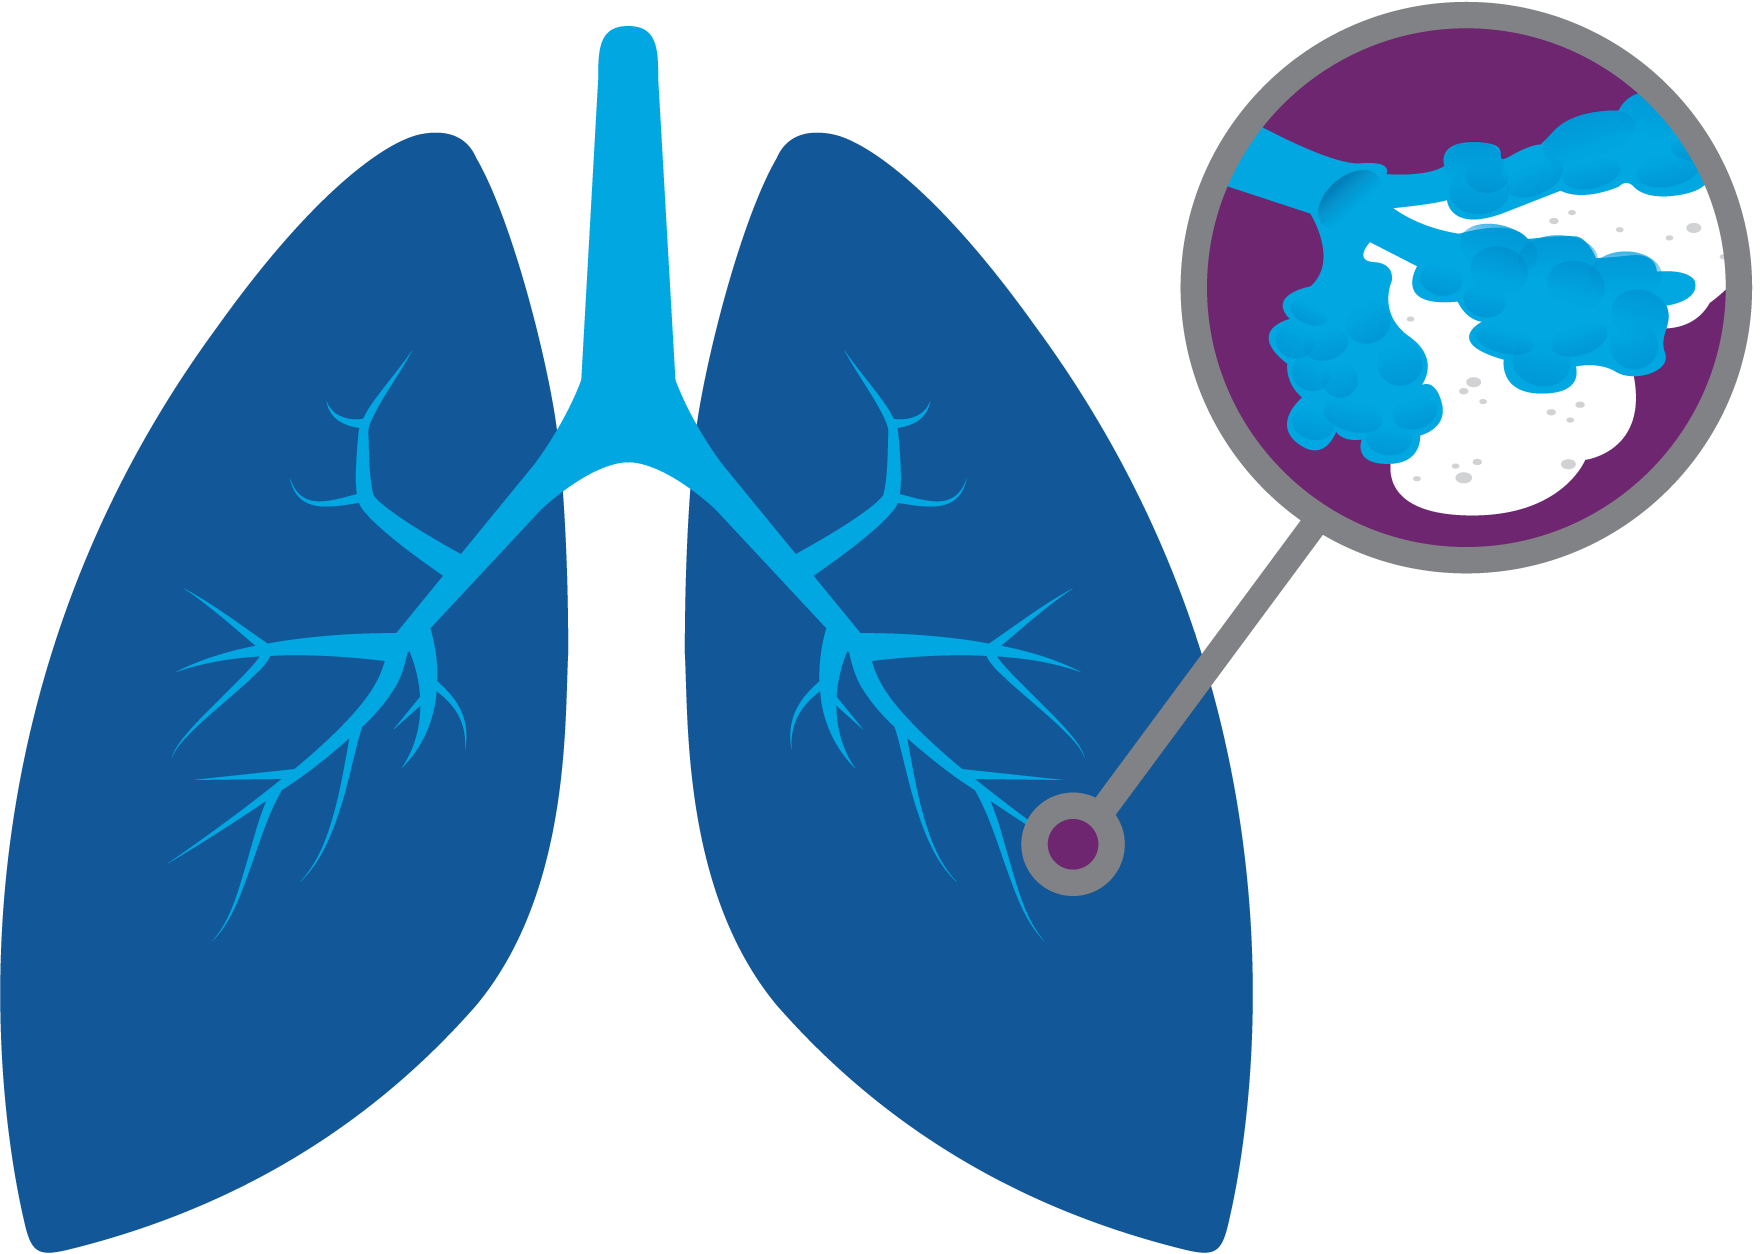



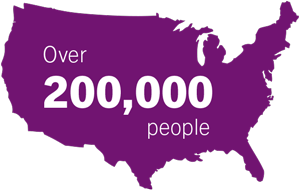
shortness of breath
dry cough
doctor can hear velcro crackles
Non-specific Symptoms
>50 years old
more men than women
IPF
Rare disease
~5 in 10,000
Post-Dx
Survival
~4 years

Cannot always be seen on CXR
At least one misdiagnosis
~55%
Two or more misdiagnosis
38%
Initially attributed to age related symptoms:
72%

PCP workflow demands
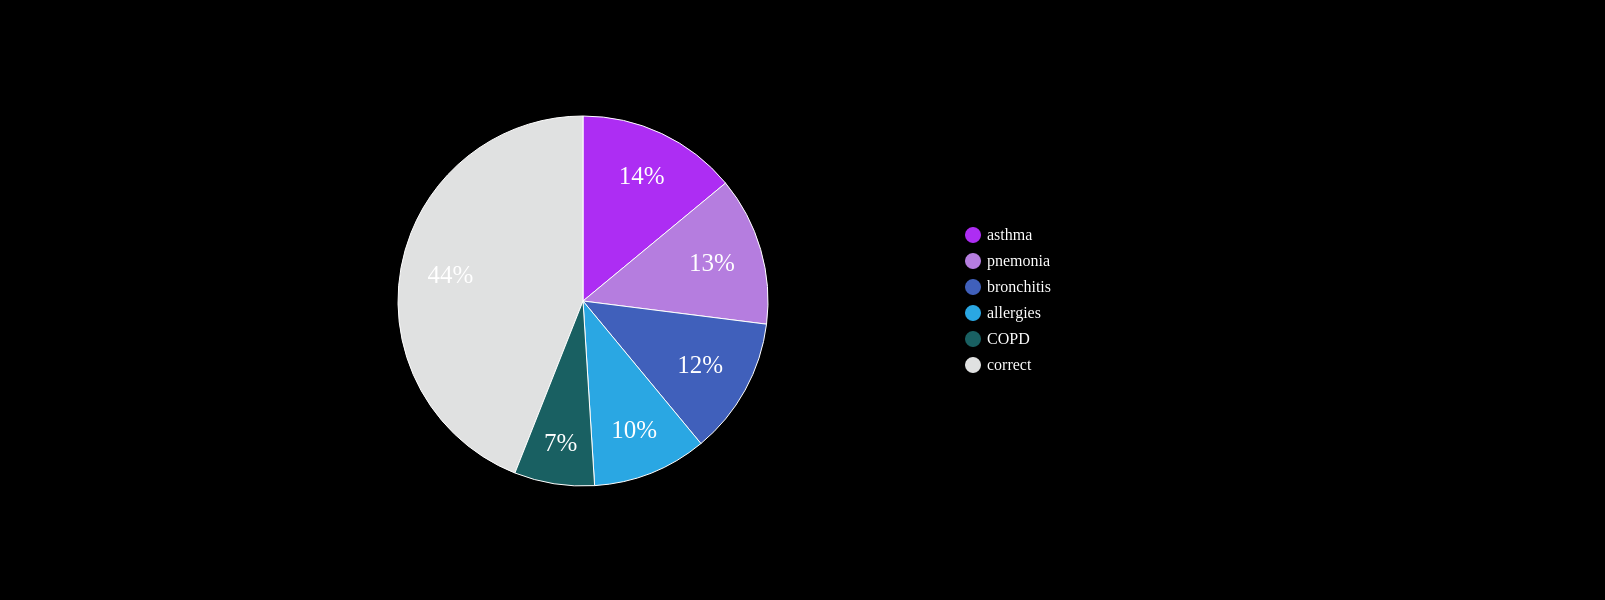
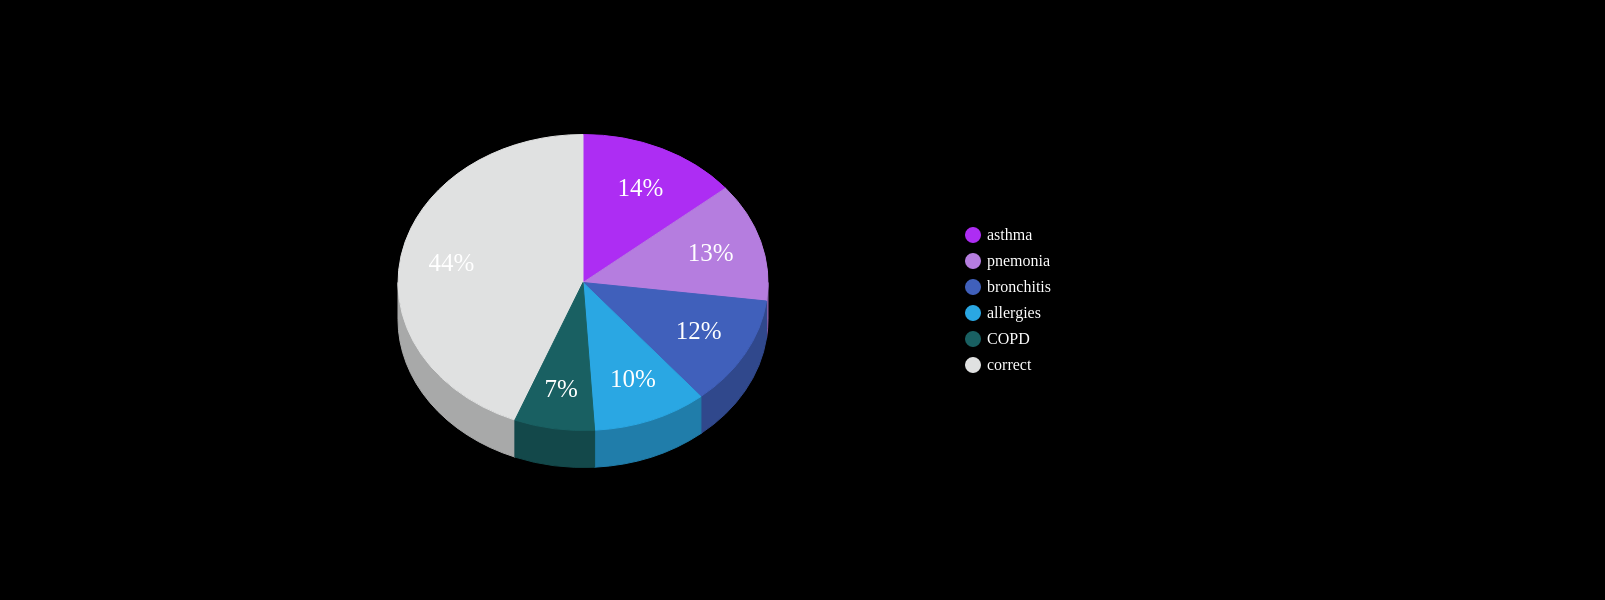
Known Co-morbidities of PF
Are there more? Subtle footprints in the medical history that are more heterogeneous?
~ 4yrs
current survival ~4yrs
~ 4yrs
current clinical DX
ZCoR screening
Onishchenko, D., Marlowe, R.J., Ngufor, C.G. et al. Screening for idiopathic pulmonary fibrosis using comorbidity signatures in electronic health records. Nat Med 28, 2107–2116 (2022). https://doi.org/10.1038/s41591-022-02010-y
n=~3M
AUC~90%
Likelihood ratio ~30
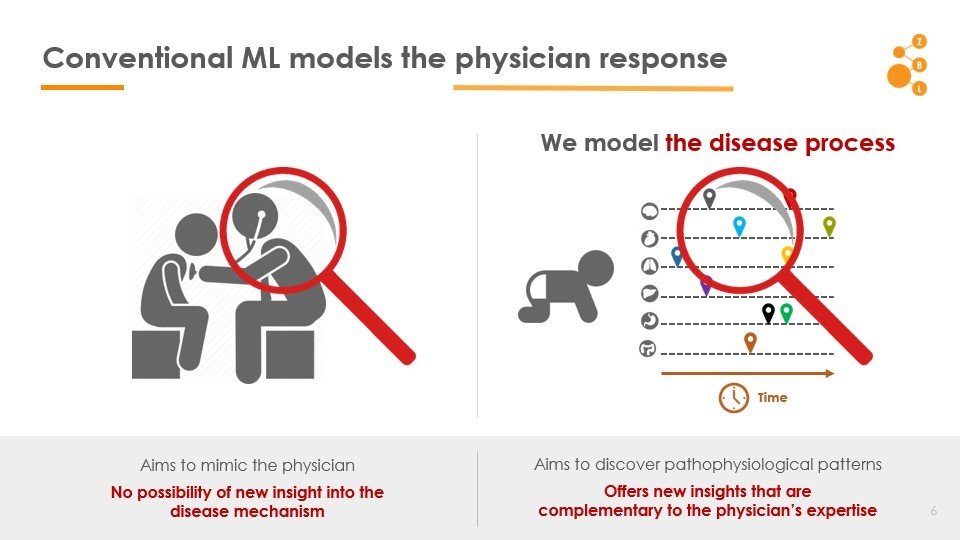
Conventional AI/ML attempts to model the physician
AI in IPF Research
- Co-morbidity patterns
- No data demands
- Use whatever data is already on patient file
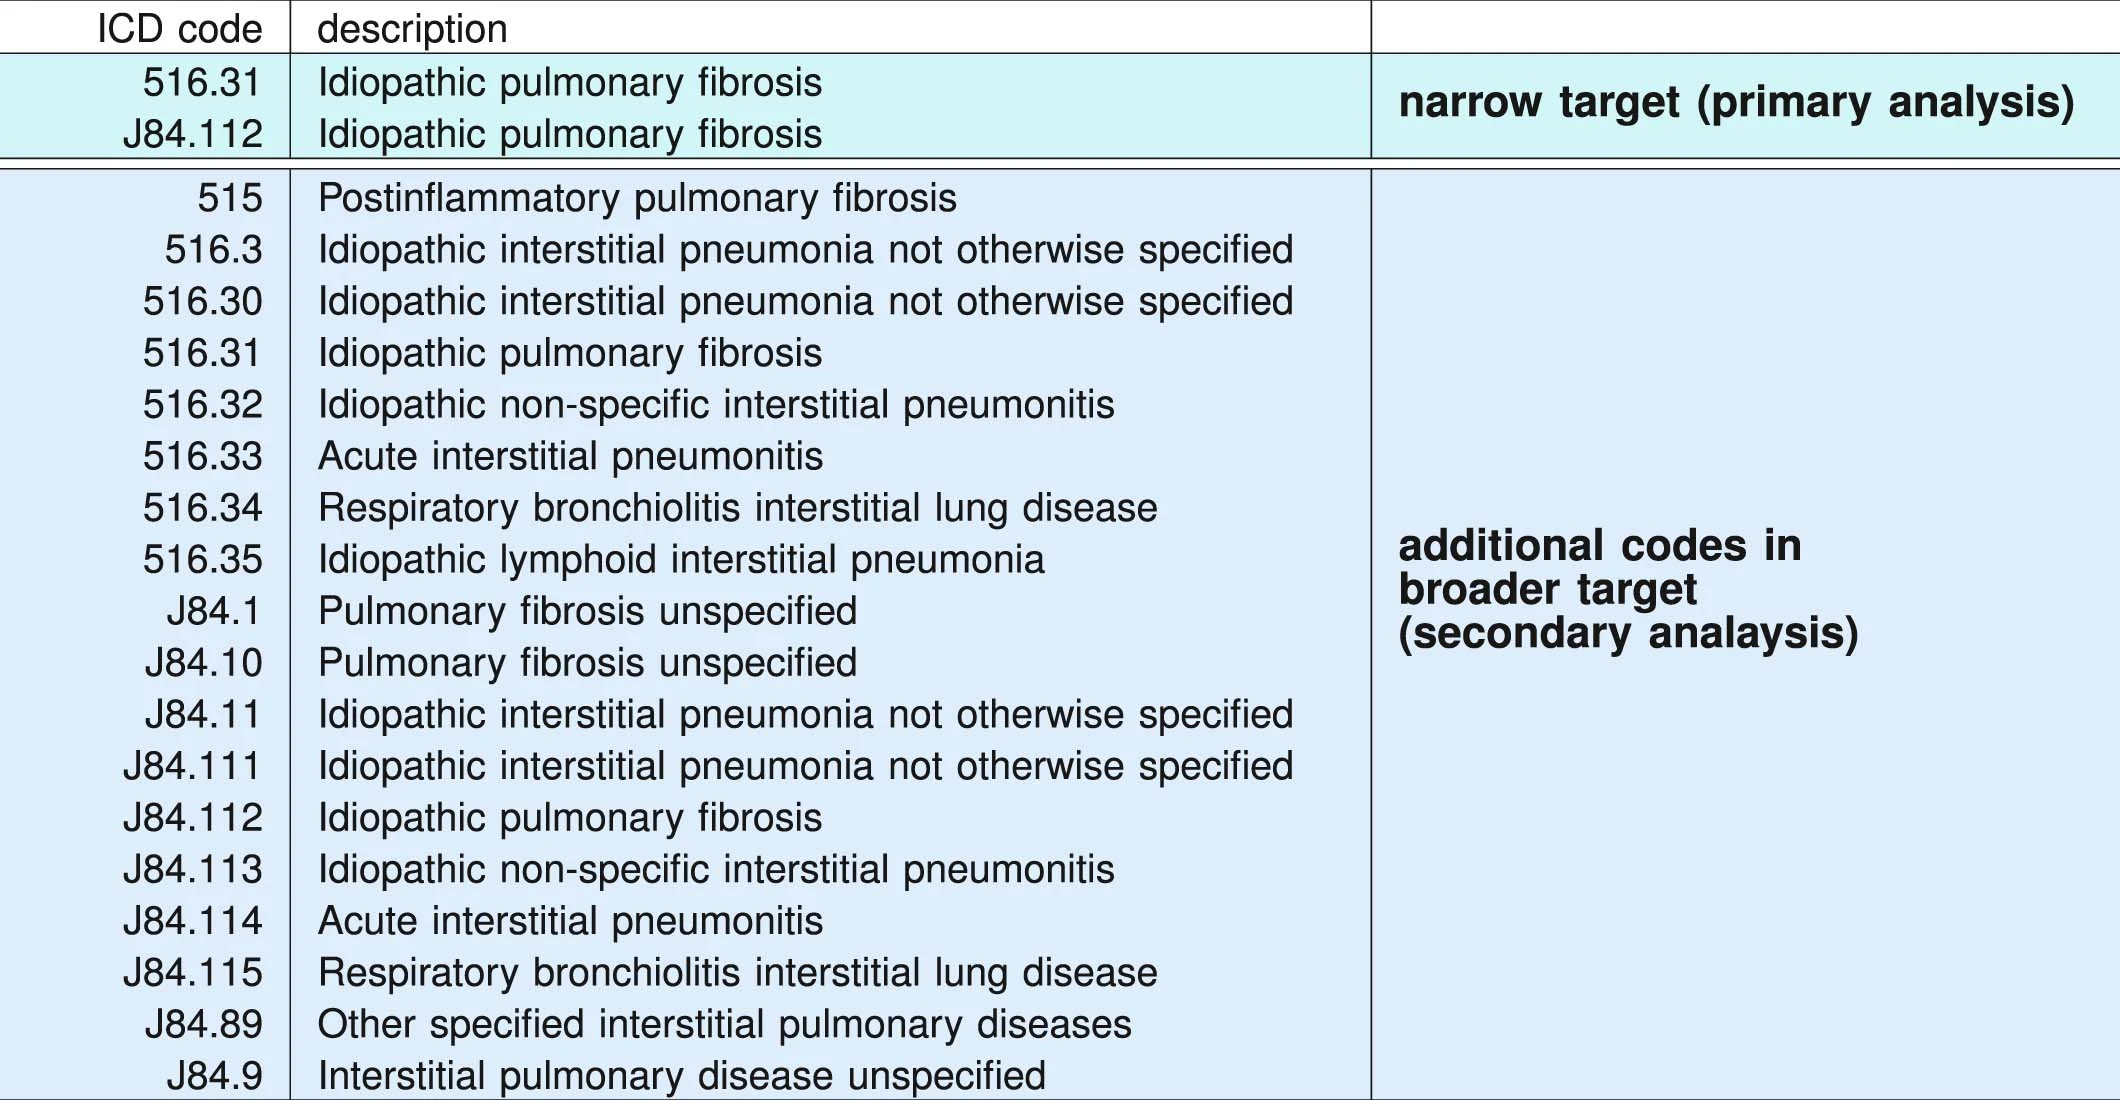
ICD administrative codes
IPF
ILD
target codes appear
Past medical history
No target codes appear
case
control
2yrs
2yrs
prediction
target codes appear
Past medical history
No target codes appear
case
control
2yrs
2yrs
IPF drugs prescribed
Signature of IPF diagnostic sequence
pirfenidone or nintedanib
- age > 50 years
- at least two IPF target codes identified at least 1 month apart
- chest CT procedure (ICD-9-CM 87.41 and Current Procedural Terminology, 4th Edition, codes 71250, 71260 and 71270) before the first diagnostic claim for IPF
- no claims for alternative ILD codes occurring on or after the first IPF claim
ICD Codes can be noisy
"cases" are not always true IPF
Truven MarketScan (IBM)
Commerical Claims & Encounters Database
2003-2018
>100M patients visible
>7B individual claims
>87K unique diagnostic codes
>7% Medicare data present
2,053,277 patients included in study

University of Chicago Medical Center
2012-2021
68,658 patients
Random sample from Optumlabs Data Warehouse courtsey Mayo Clinic
861,280 patients
2,983,215 patients
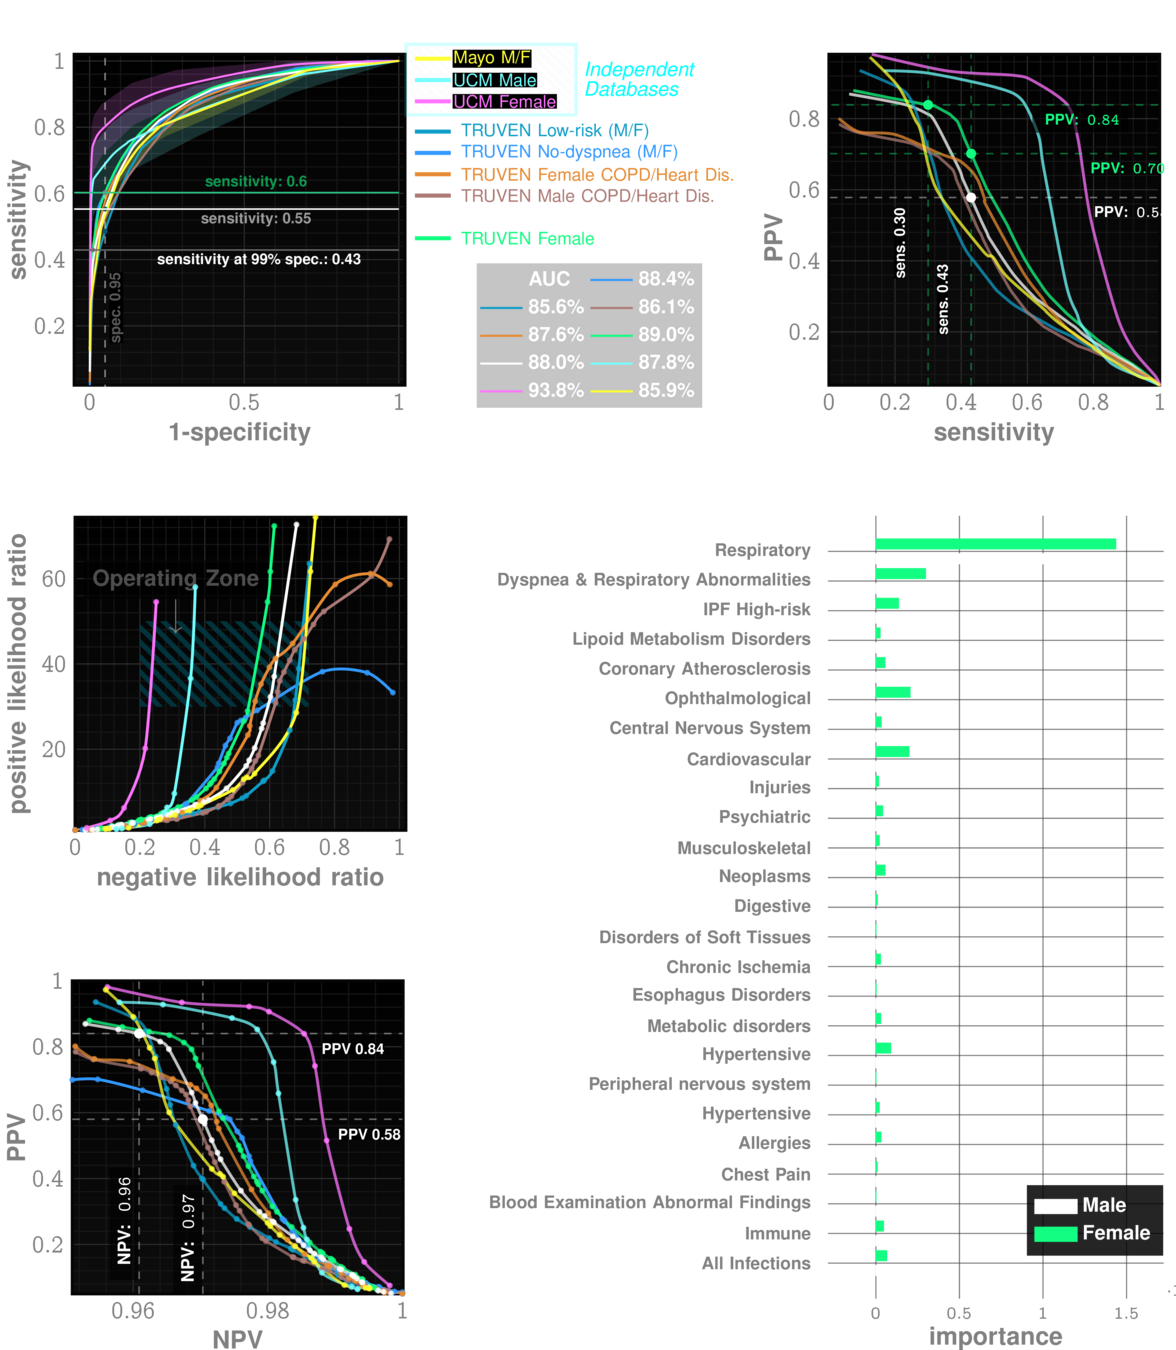
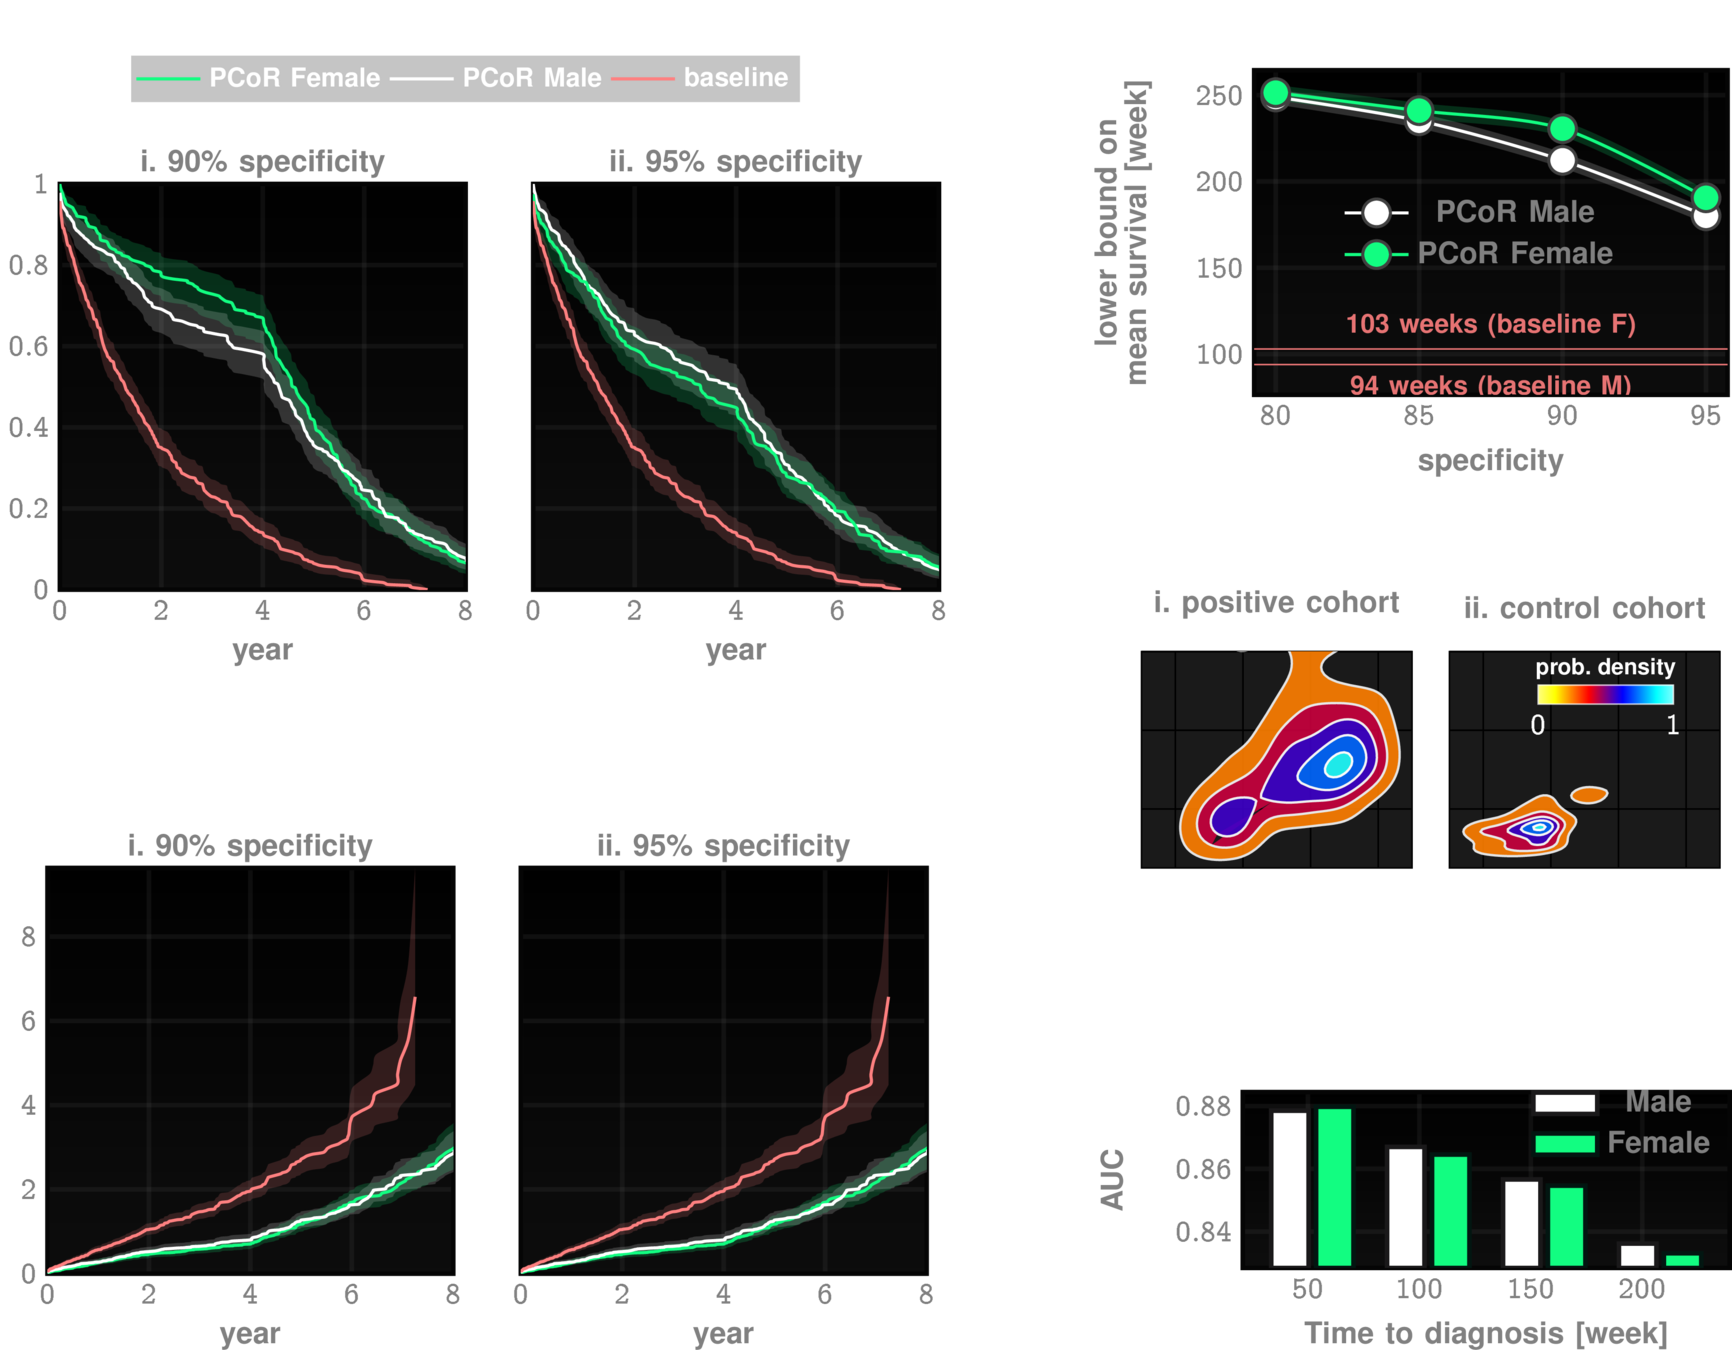
Data: Onishchenko etal. Nat. Medicine 2022
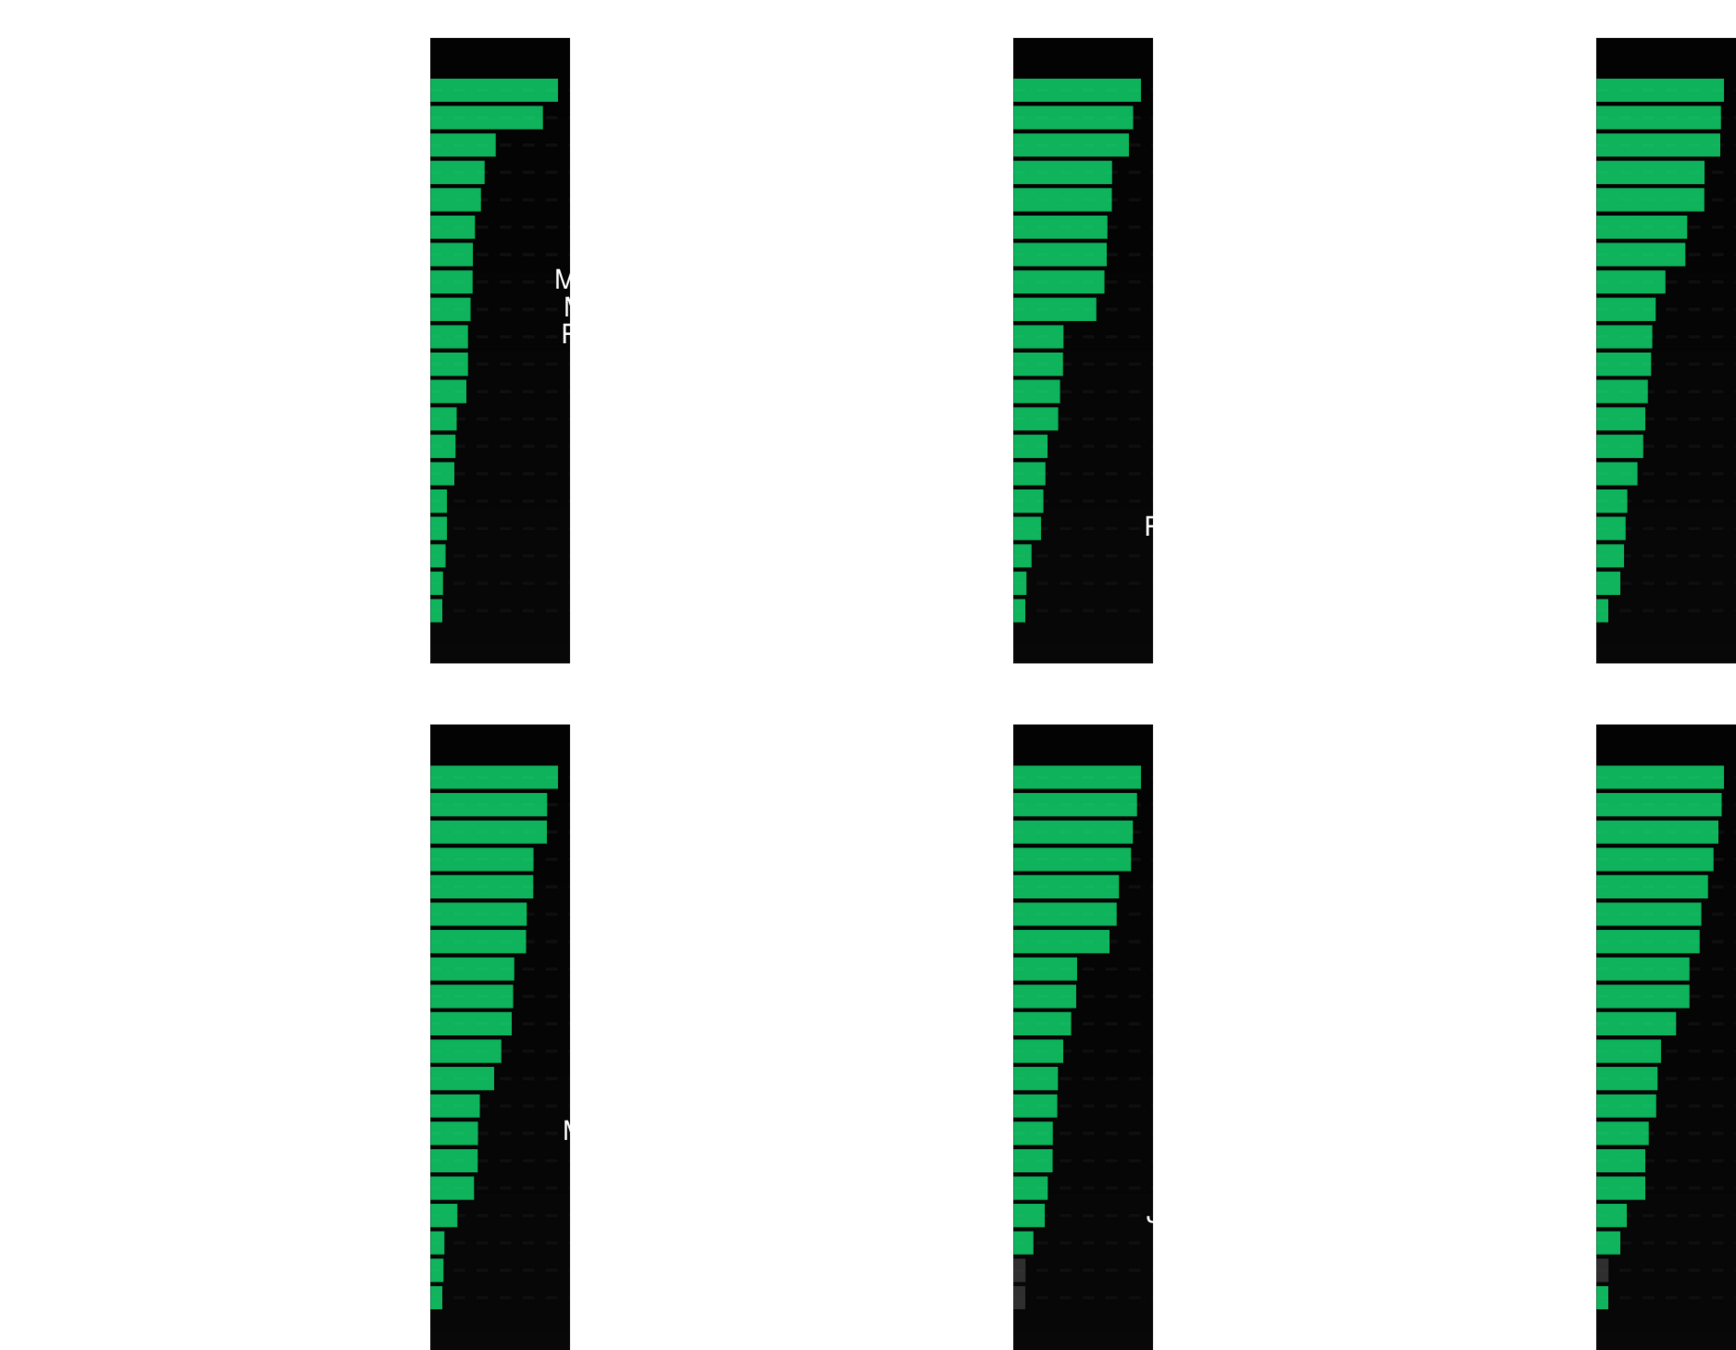
patient A
patient B
patient C
Beyond "risk factors" to personalized risk patterns
Clinical Trial Cohort Selection
Current screen failure rate ~50-60%
ZCoR boosted screen failure rate ~20%
cohort size: 2000
initial cohort size: 5000
initial cohort size with ZCoR: 2500
Cost per patient for confirmatory tests: ~7k USD
Savings: ~20M USD
Clinical Trial Cohort Selection
Current screen failure rate ~50-60%
ZCoR boosted screen failure rate ~20%
cohort size: 2000
initial cohort size: 5000
initial cohort size with ZCoR: 2500
Cost per patient for confirmatory tests: ~7k USD
Savings: ~20M USD
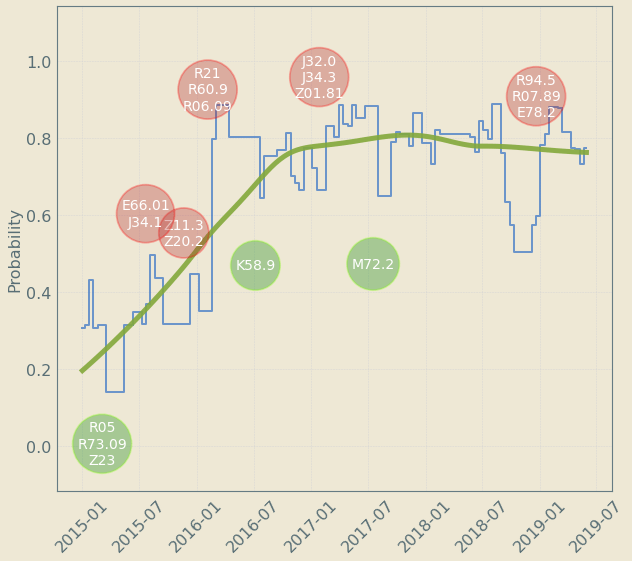
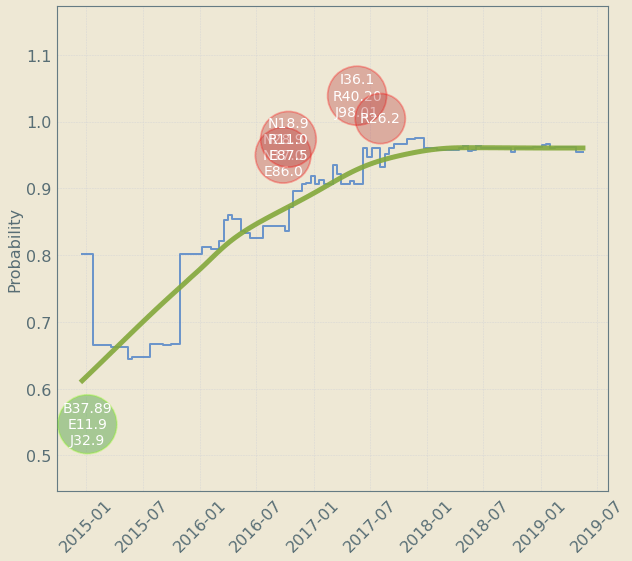
Upto 4 year "signal" resolution
decreases risk
increases risk
Patient Journey: Tracking Risk over time
Autism
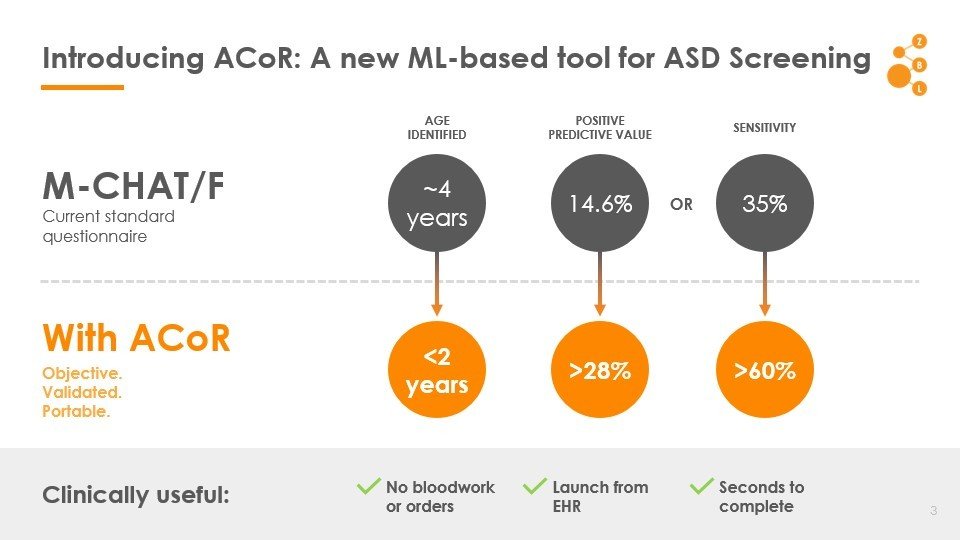
1 in 59
36
MCHAT/F
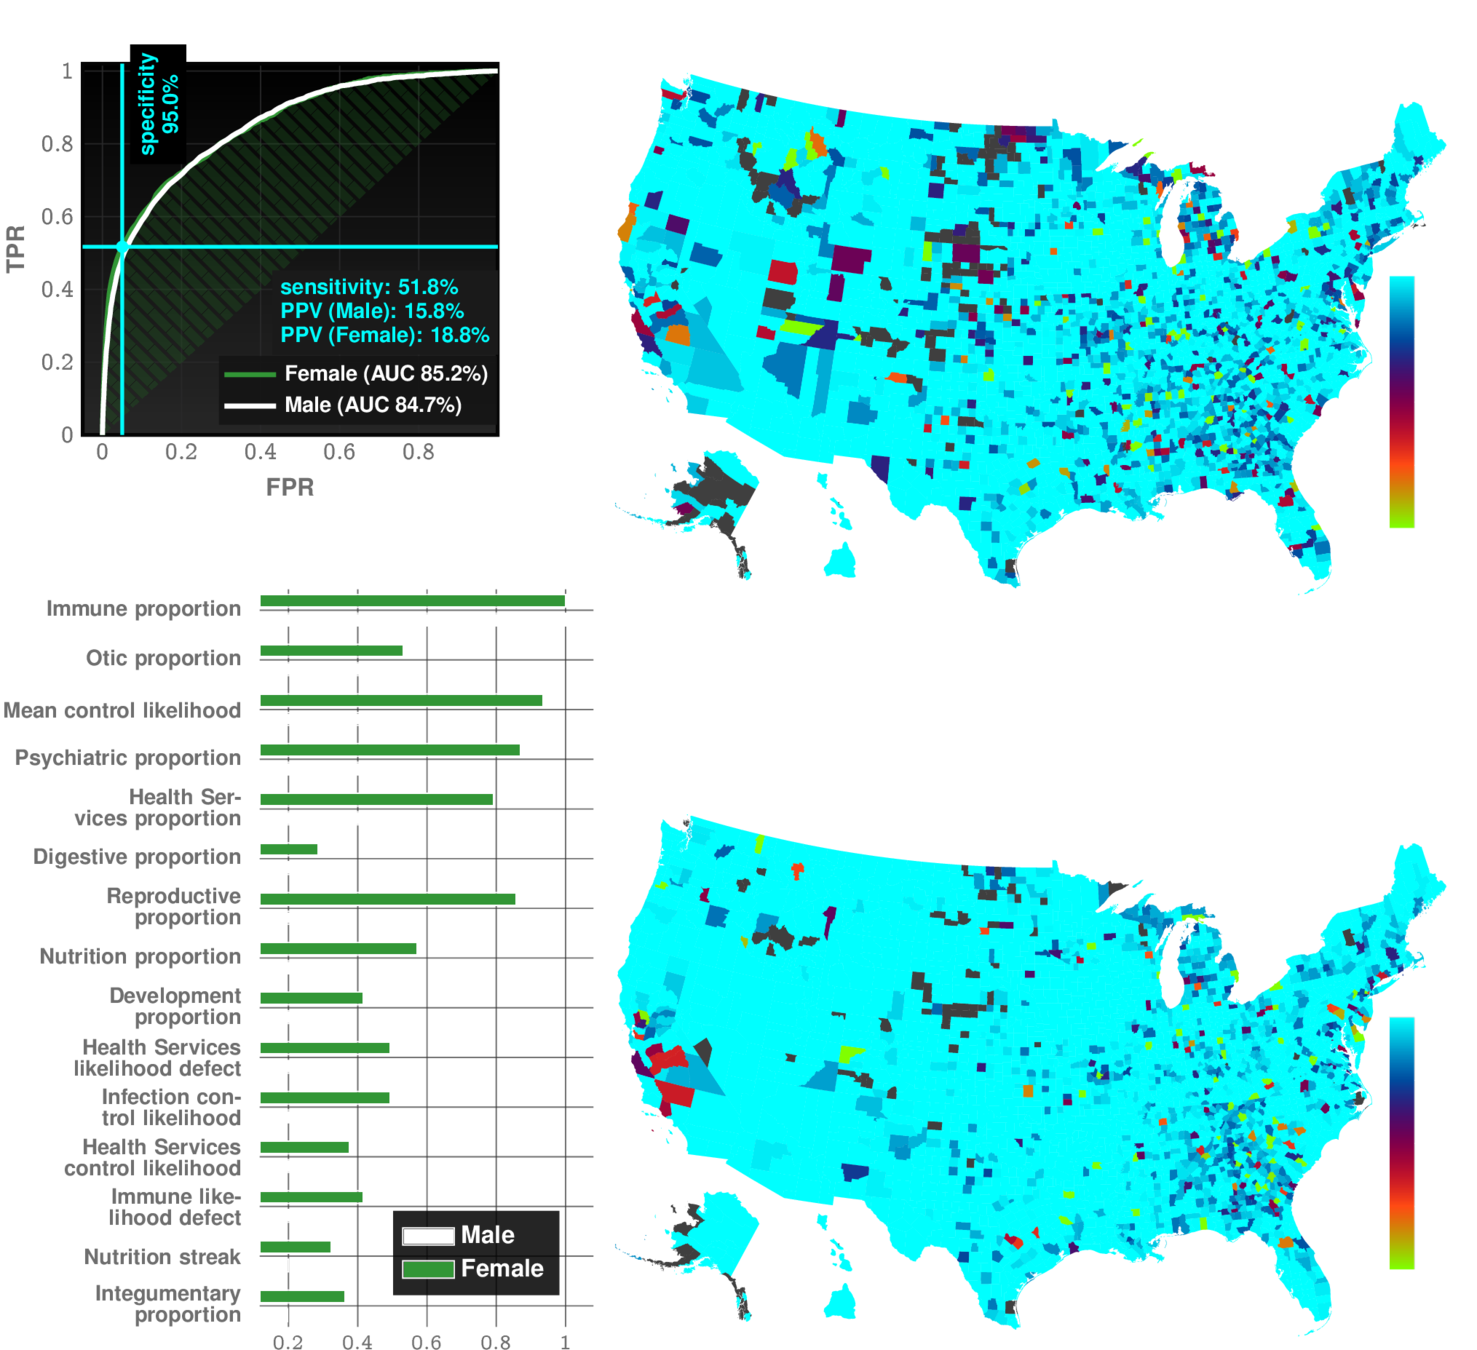
ZeD Lab: Predictive Screening from Comorbidity Footprints
CELL Reports
| ZCoR | Competition | |
|---|---|---|
| Autism | >83% | "obvious" |
| Alzheimer's Disease | ~90% | 60-70% |
| Idiopathic Pulmonary Fibrosis | ~90% | NA |
| MACE | ~80% | ~70% |
| Bipolar Disorder | ~85% | NA |
| CKD | ~85% | NA |
| Rare Cancers (Bladder, Uterus) | ~75-80% | Low |
| Suicidality (with CAT-SS) | 98% PPV | Low |
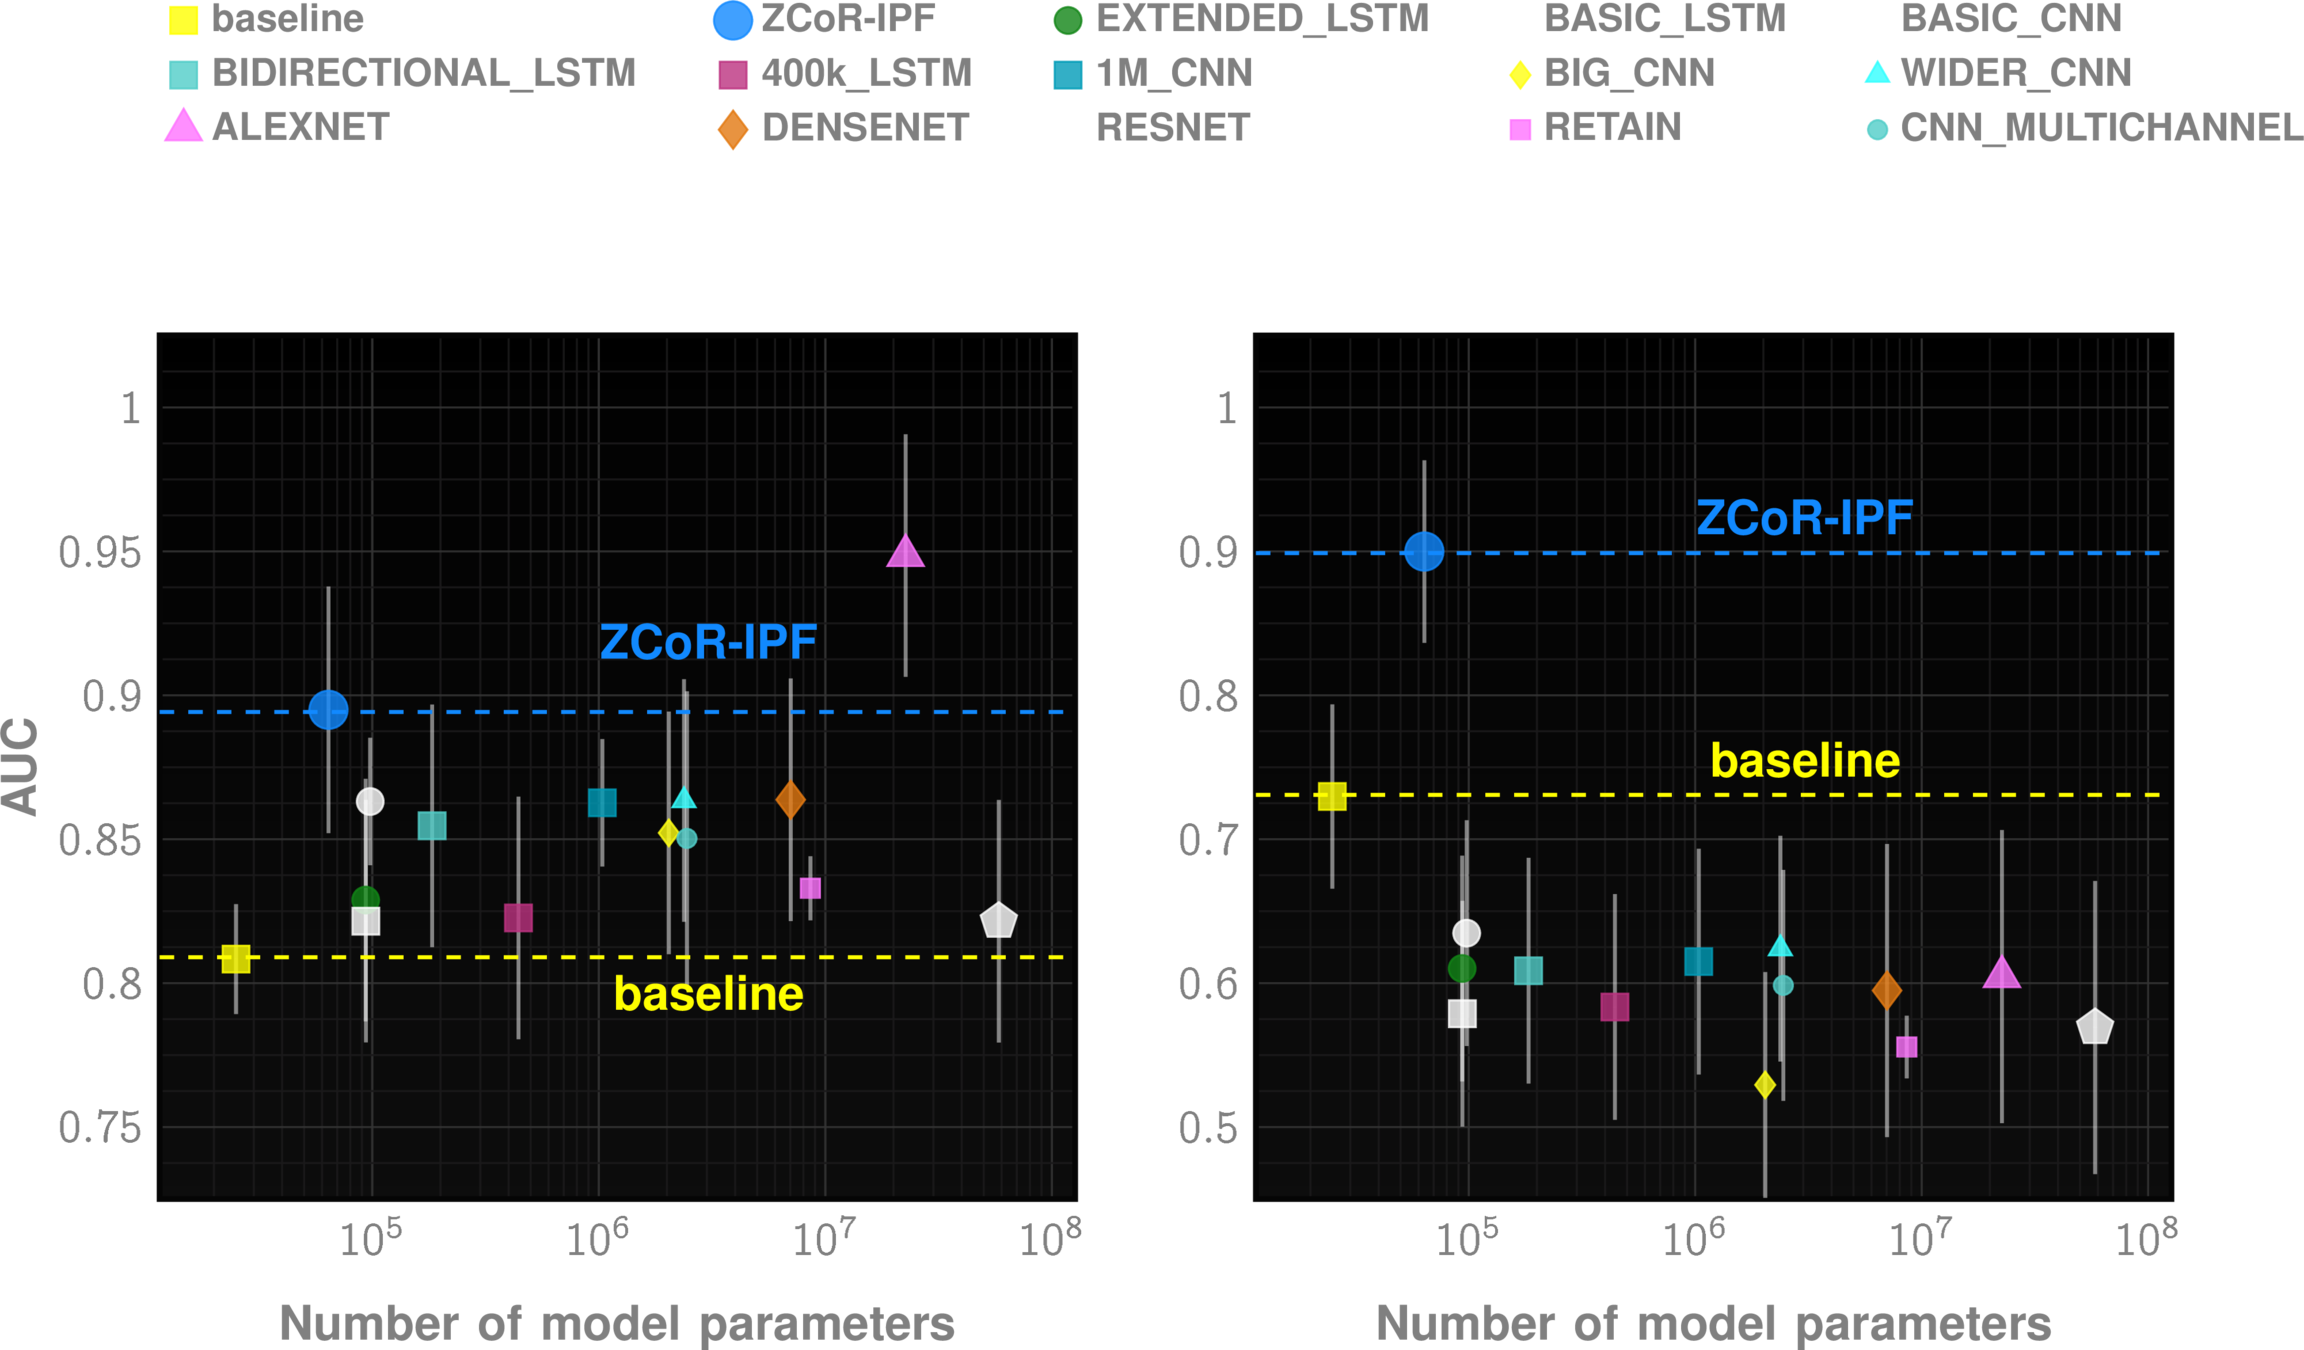
Off-the-shelf AI does not suffice
How?
Odds ratios combined via ML
1
Data
cases
control
odds ratios for all ICD codes
ML Model
odds-based risk estimator
minimize generalization error by constraining model capacity
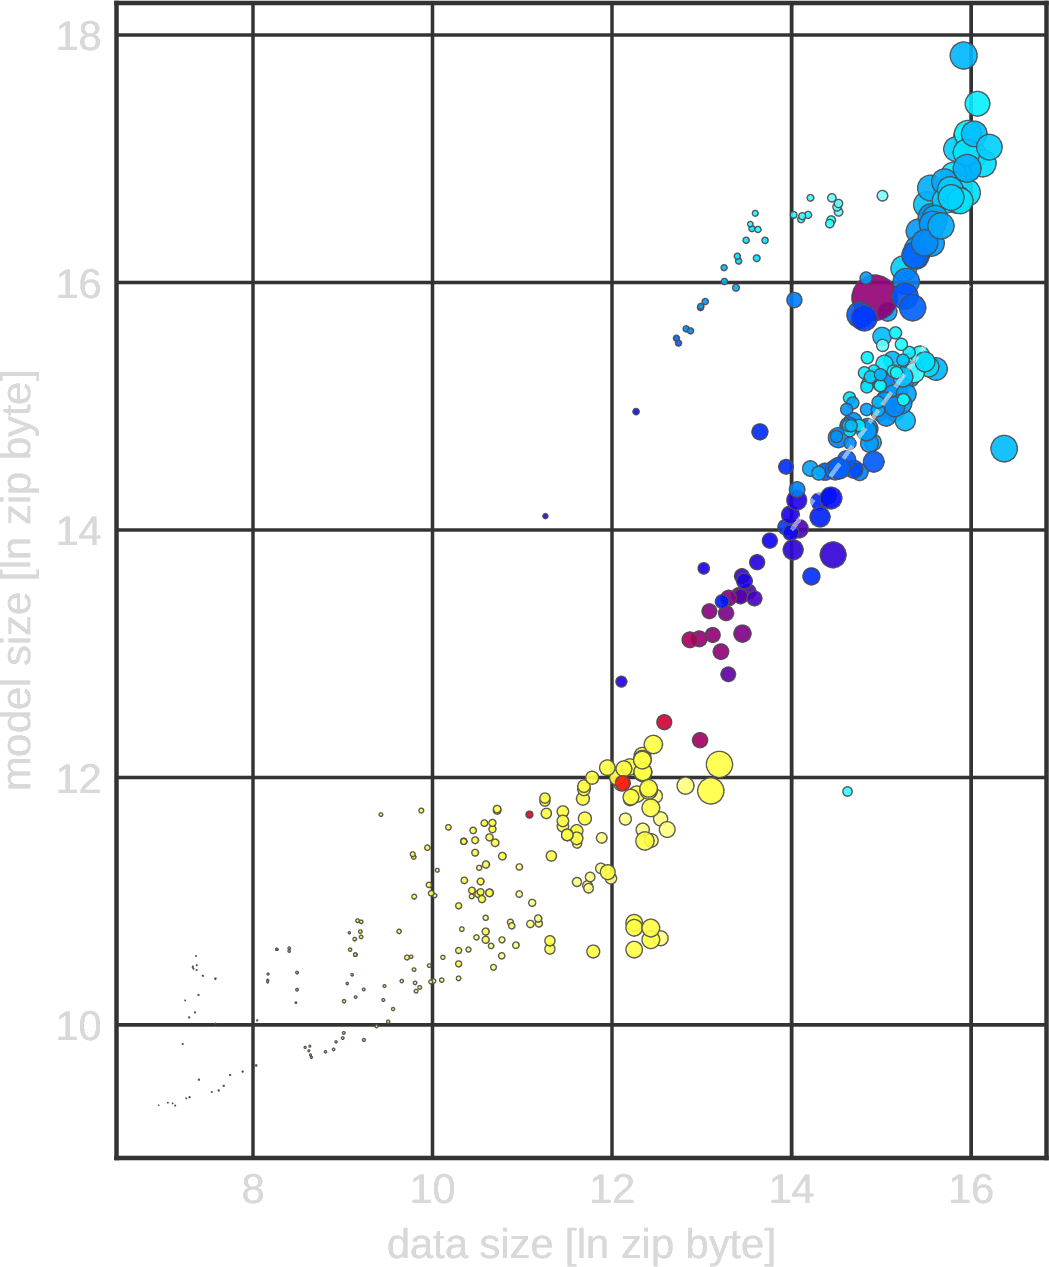
Conservation of complexity!
for digital twins
Research Direction II
Digital Twins
General framework for inferring digital twins in biology and medicine
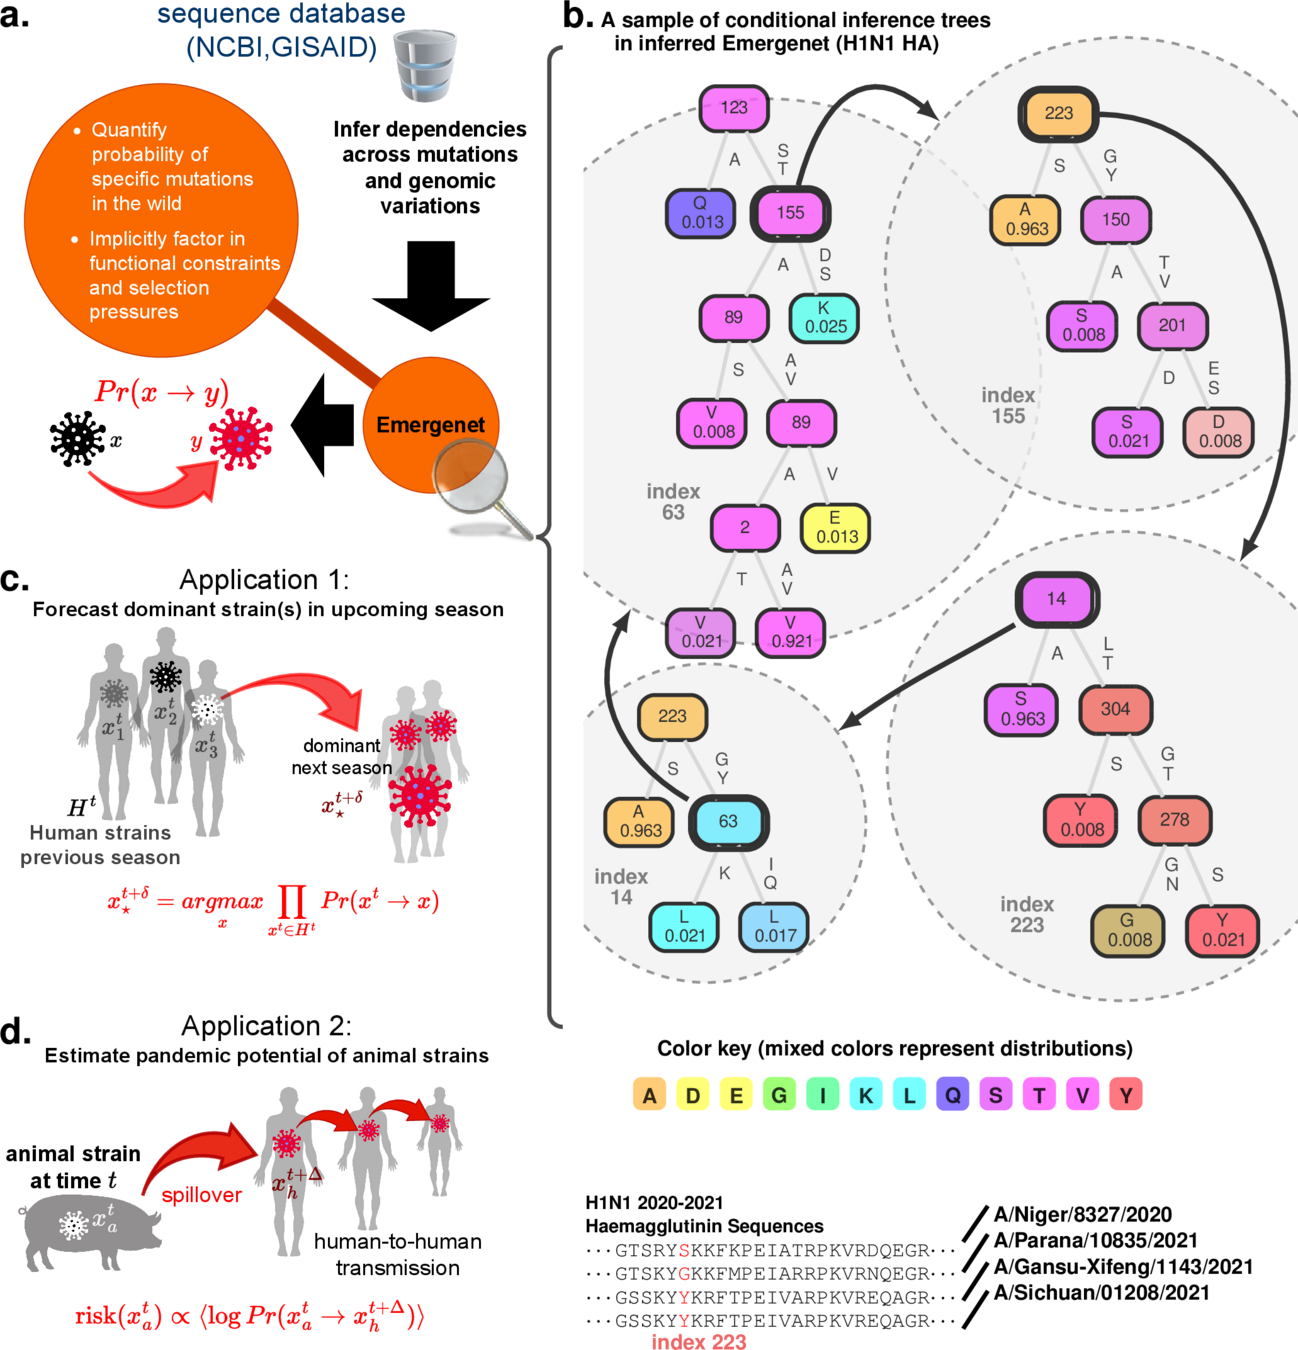
Chattopadhyay, Ishanu, Kevin Wu, Jin Li, and Aaron Esser-Kahn. "Emergenet: Fast Scalable Pandemic Risk Assessment of Influenza A Strains Circulating In Non-human Hosts." (2023). Under Review in Nature
PREEMPT
Predicting Future Mutations for Viral Genomes in the Wild
predict future emergence risk
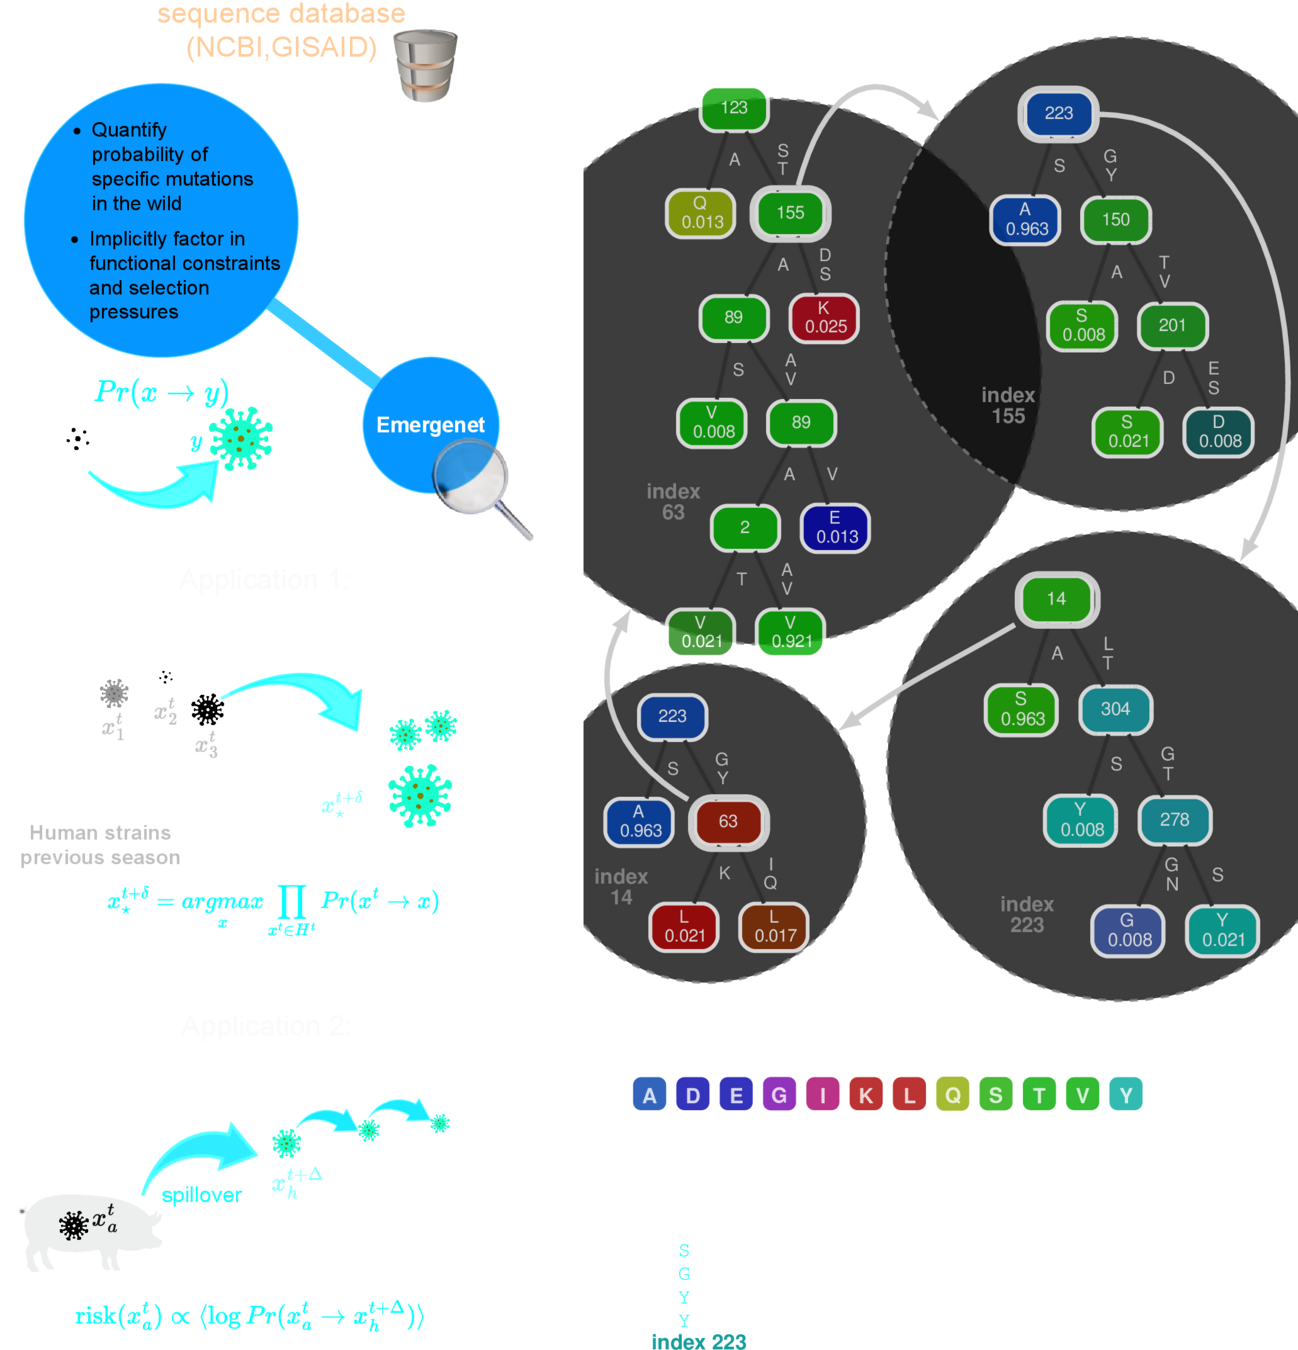
Q-Net
recursive forest
q-distance
a biologically informed, adaptive distance between strains
This distance is "special"
Smaller distances imply a quantitatively high probability of spontaneous jump
$$J \textrm{ is the Jensen-Shannon divergence }$$
Metric Structure
Tangent Bundle

geometry
dynamics
Influenza Risk Assessment Tool (IRAT) scoring for animal strains
slow (months), quasi-subjective, expensive
*https://www.cdc.gov/flu/pandemic-resources/monitoring/irat-virus-summaries.htm
24 scores in 14 years
~10,000 strains collected annually
CDC
Emergenet time: 1 second
Stamping Out the Next Pandemic **Before** The First Human Infection
BioNorad
THE PROBLEM
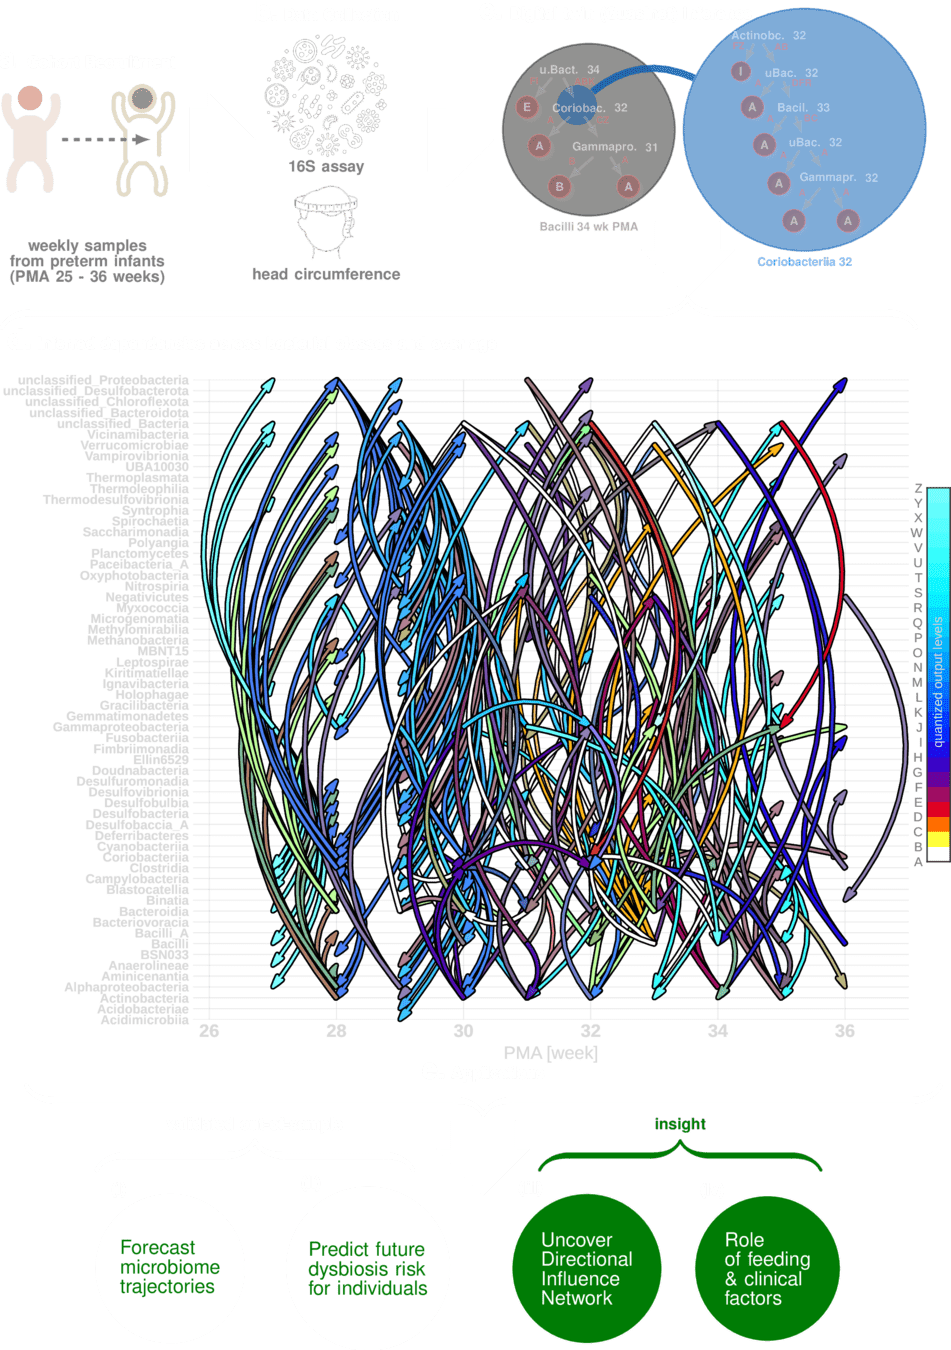
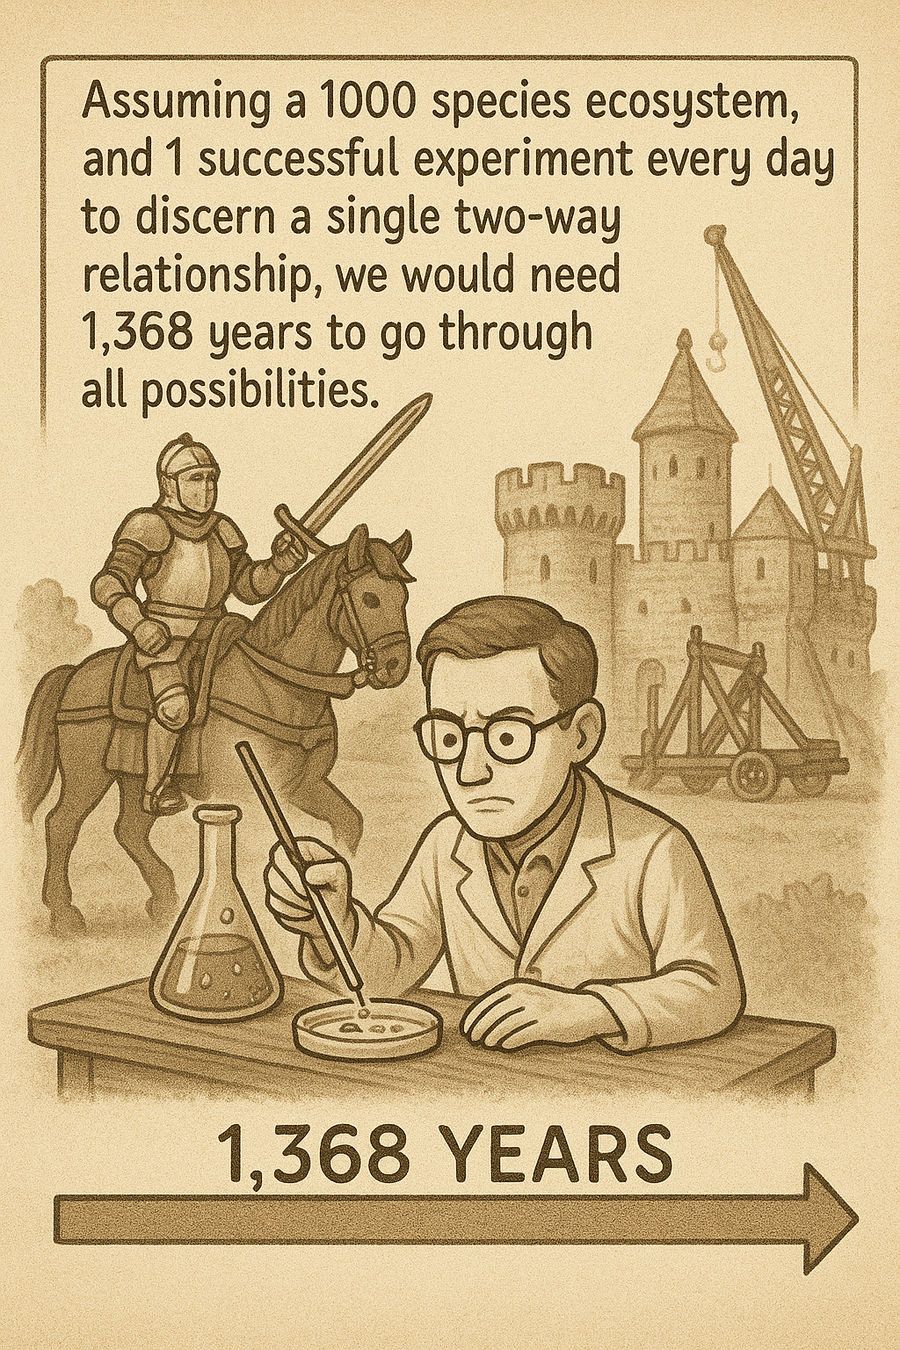
Assuming a 1000 species ecosystem, and 1 successful experiment every day to discern a single two-way relationship, we would need 1,368 years to go through all possibilities.
Digital Twin for the Maturing Human Microbiome
- Forecast microbiome maturation trajectories
- Predict neurodevelopmental deficits
Boston U
U Chicago
Two centers
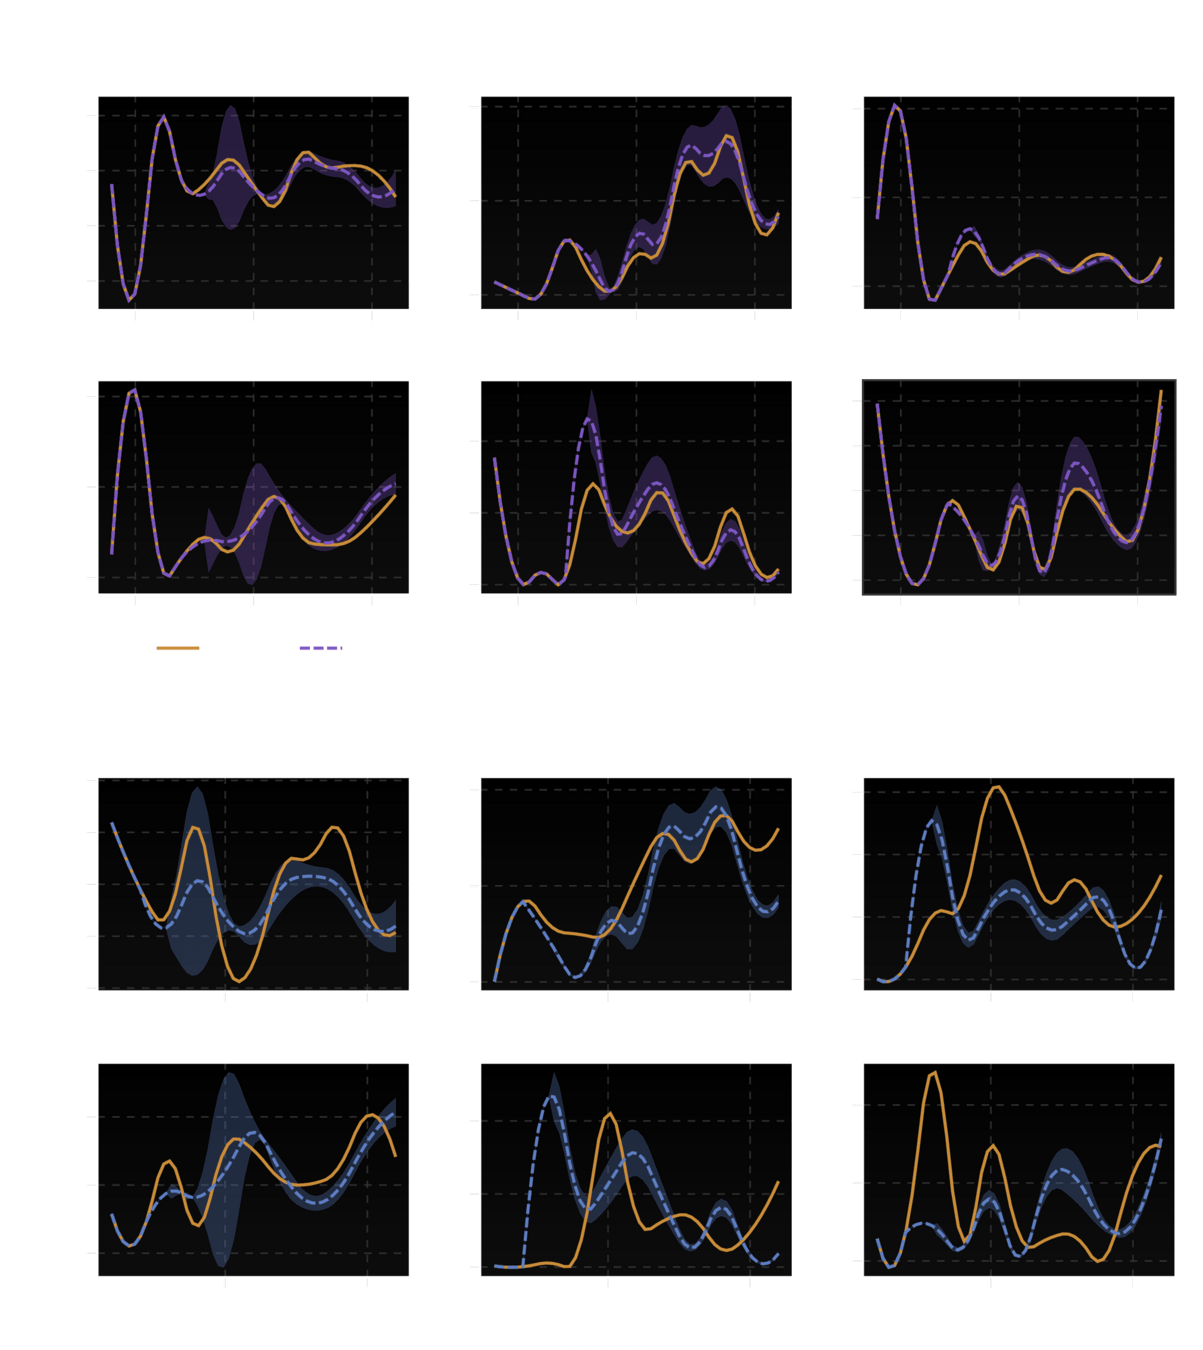
Ability to "fill in" missing data is equivalent to making trajectory forecasts
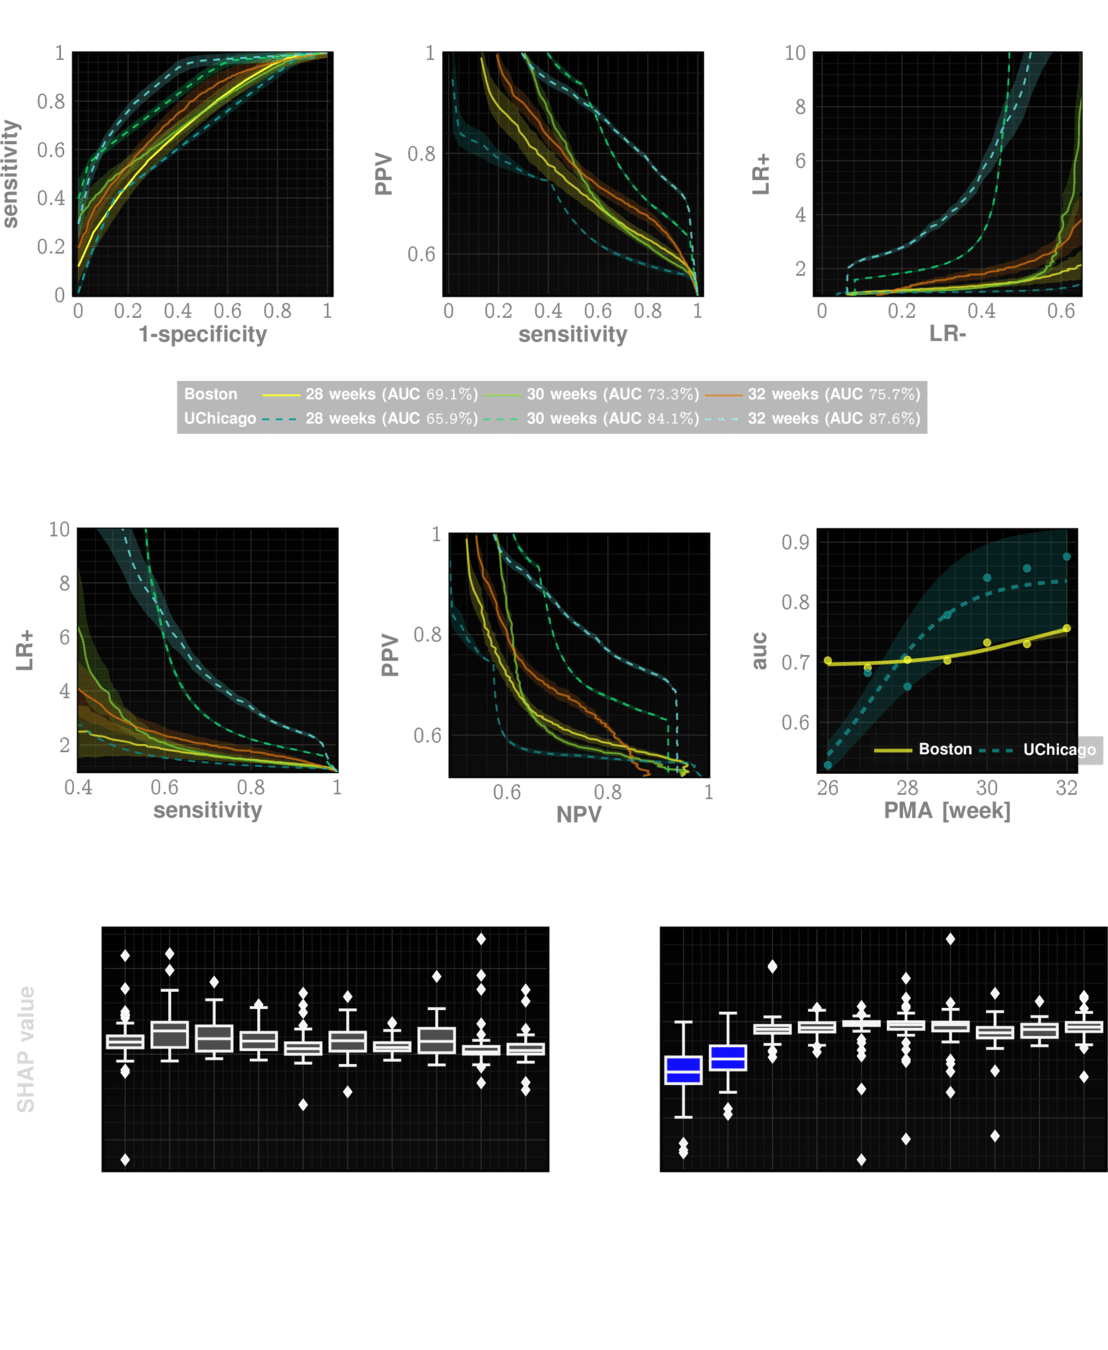
predicting neurodevelopmental deficits
forecasting ecosystem trajectories
Which entities are most predictive
of neurodevelopmental deficit
entity X timestamp
SHAP value
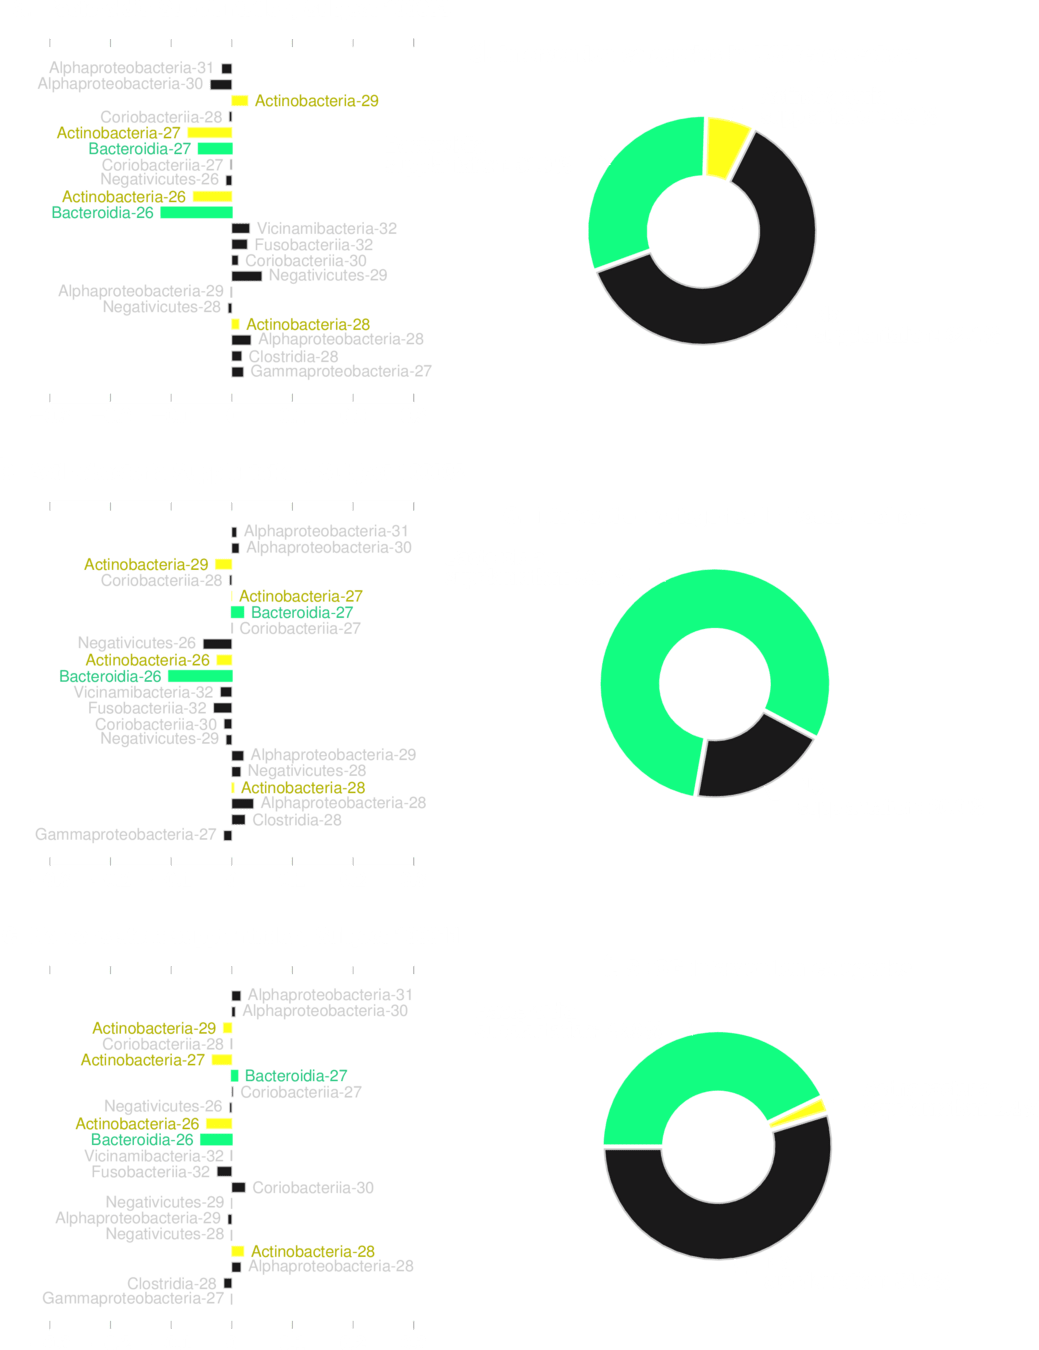
No transplantation is guaranteed to work reliably
Just add those microbes back to reduce risk?
No!
Bacterial transplantation must be personalized
Future task:
Explicit supplantation profiles that are tuned to individual ecosystems
No transplantation is guaranteed to work reliably
Just add those microbes back to reduce risk?
No!
Bacterial transplantation must be personalized
Future task:
Explicit supplantation profiles that are tuned to individual ecosystems
Phase 1
Phase 2
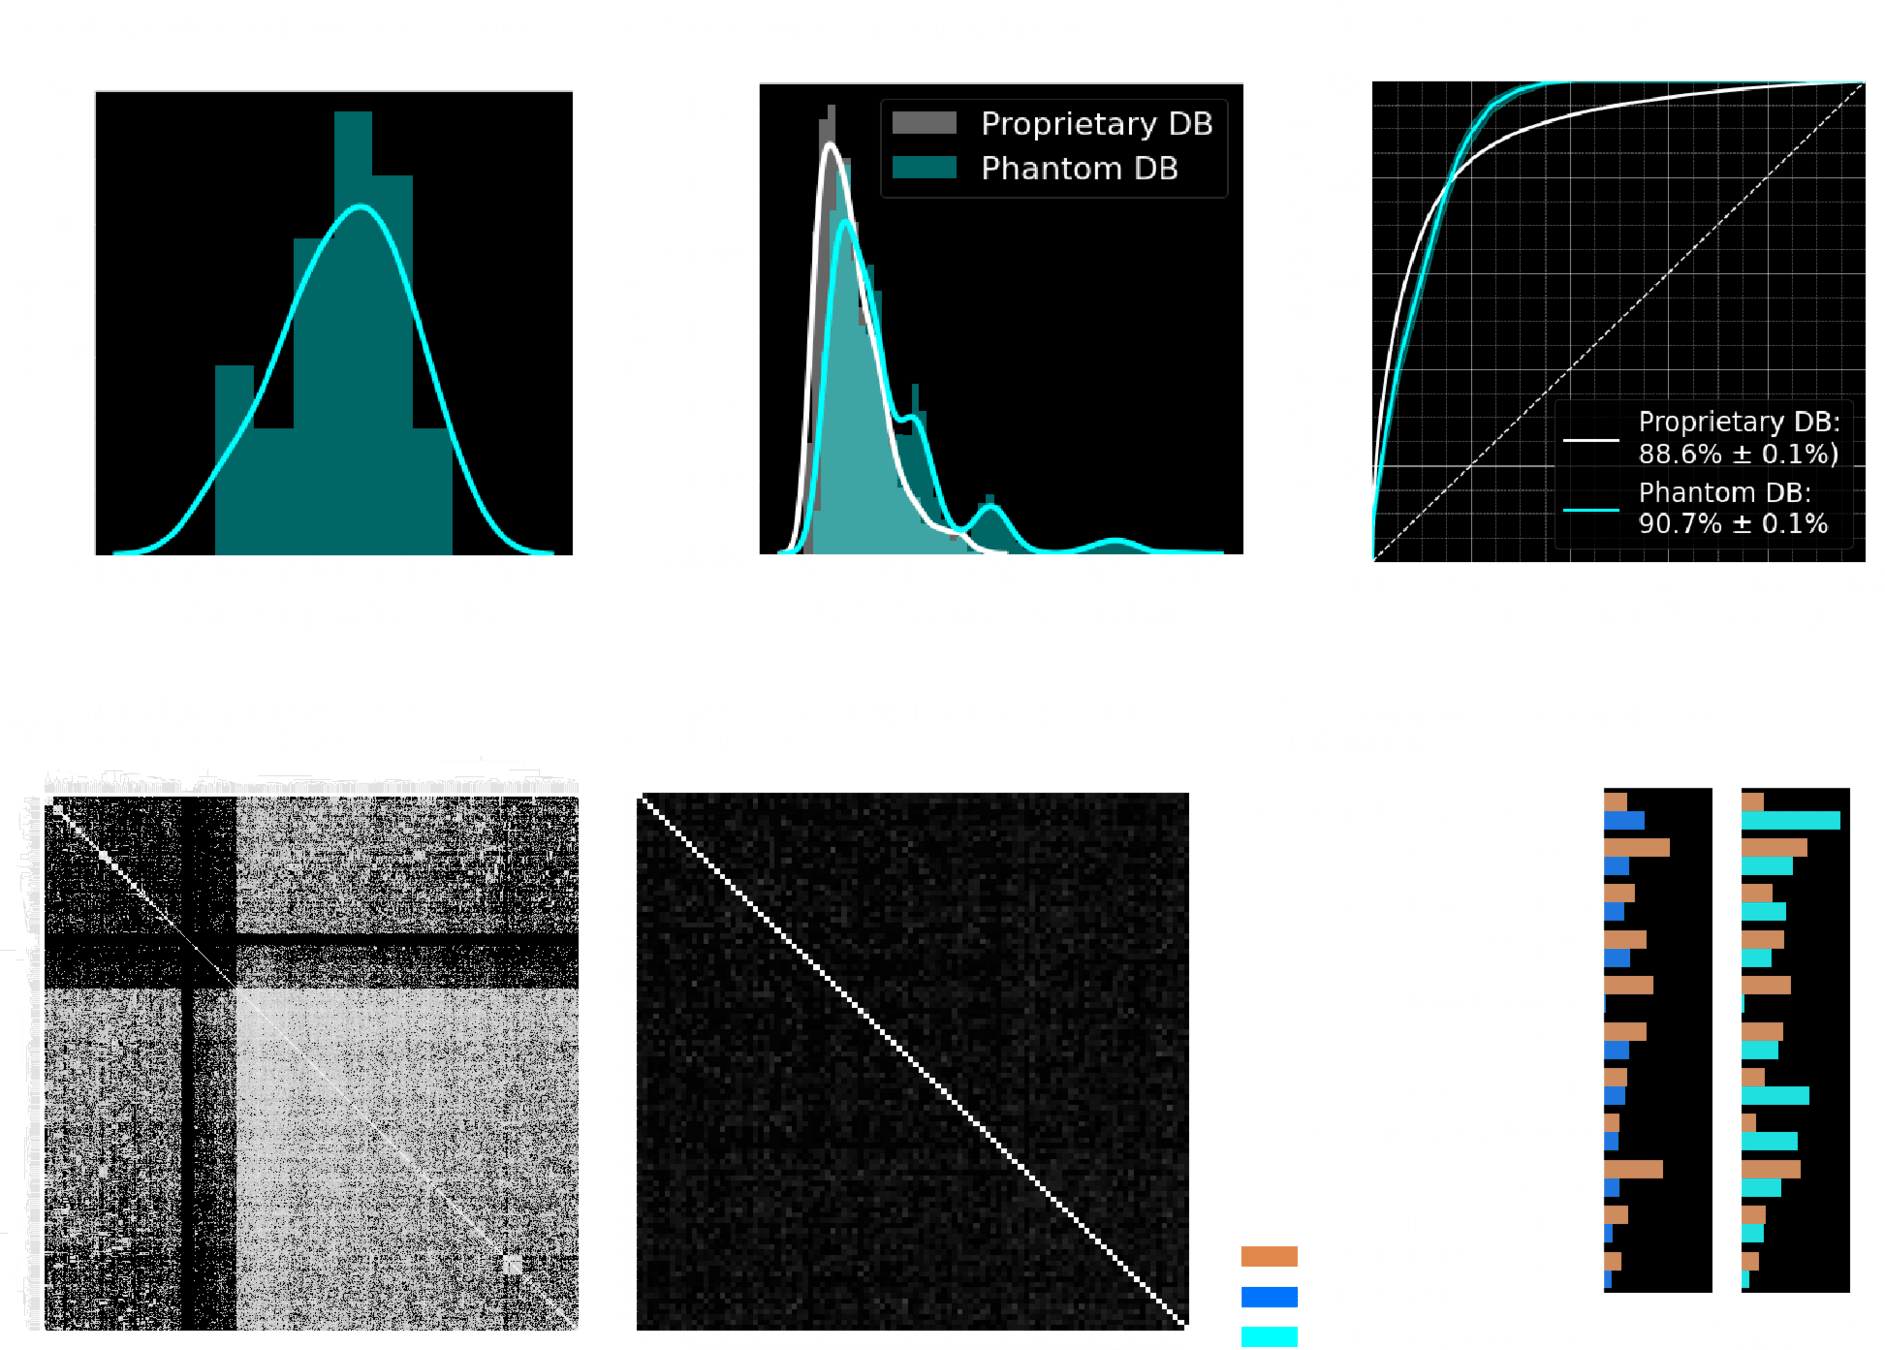
Uncorrelated, yet indistinguishable !!
What is a healthy Microbiome/ Metabolome?
Can gut microbiota pre-empt developmental deficits?
High Abundance Classes
Complex Interdependecies Exist over time and taxonomic strata
quantized output levels
Purely wet-lab investigations are insufficient to understand complex ecosystems
We need to scale up!
We need a digital twin
of the dataset
-
Learn from uncurated data
-
understand non-trvial cross-dependencies between entities, without prior knowledge
-
can explore valid perturbations of the overall system
-
can identify deviations from "normal" behavior
-
Can model out-of-box targeted and untargeted metabolites (or uncharacterized microbes)
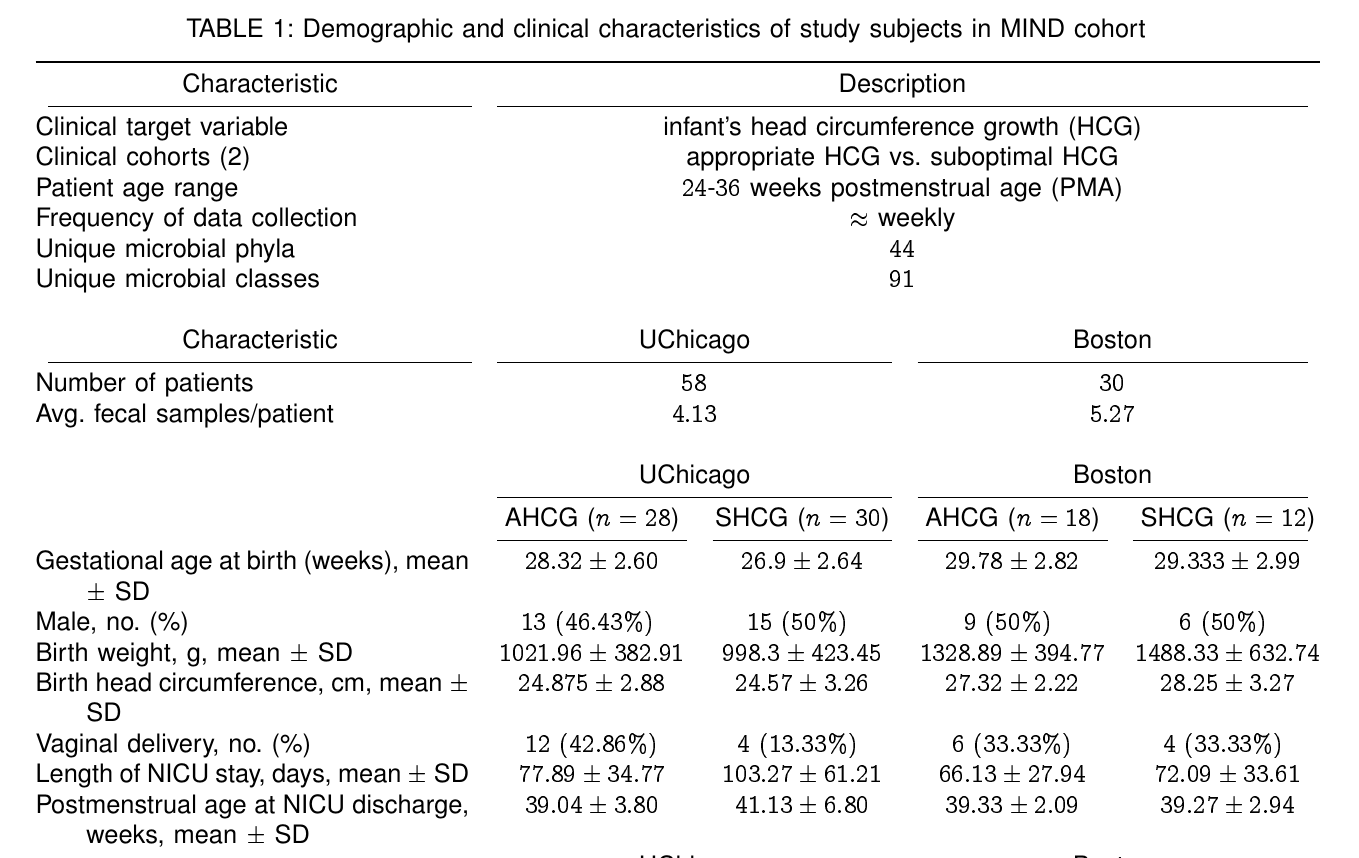
Can microbial assay from gut actionably
pre-empt developmental deficit?
Study Set-up
Predicting neurodevelopmental deficits
Forecasting ecosystem trajectories
Build classifiers
Ability to "fill in" missing data is equivalent to making trajectory forecasts
Forecast ecosystem fluctuations
Large Science Models
- Consider a large number (\(n\)) of coupled observables
- We dont know potential couplings a priori
- Compute all \(x_i \vert x_1,\cdots,x_{i-1},x_{i+1},\cdots, x_n\) conditionals
-
Estimate the joint distribution of all variables
Brook’s lemma*
*Brook, D. (1964). On the distinction between the conditional probability and the joint probability distribution. Journal of the Royal Statistical Society. Series B (Methodological), 26(2), 295–307.
perfect inference of these conditionals gives us a unique joint
The central problem of ML is computing joint distributions or estimates thereof
hard!
How Complex Are These Models?
Hundreds of thousands to 10s of millions of features
The Goal: Create a digital twin which can reveal valid perturbations
Completely uninformative state
Observed state
?
Risk
Geometric Interpretation
LSM-based Risk
- Infer LSM for typical development
- Infer LSM for disease trajectories
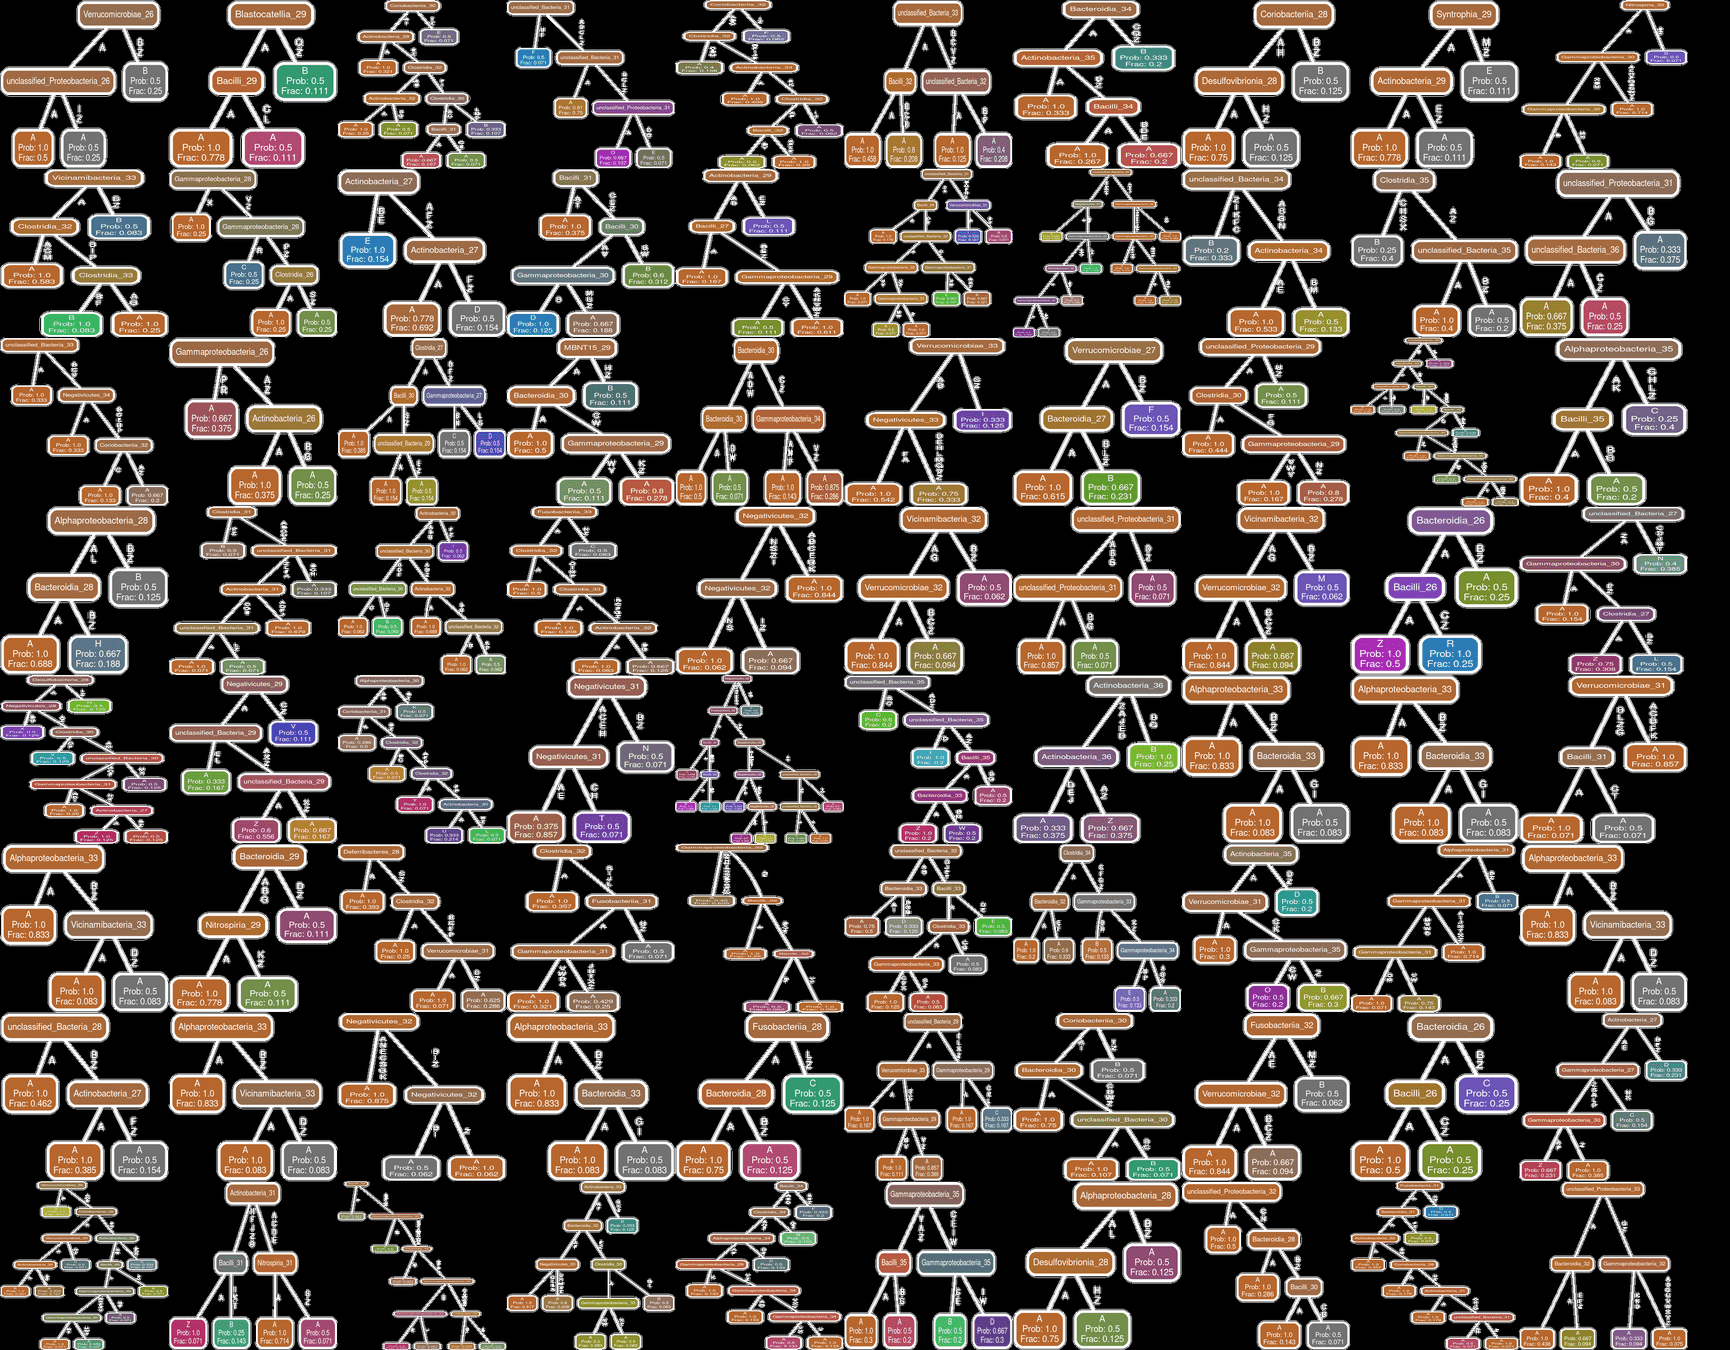
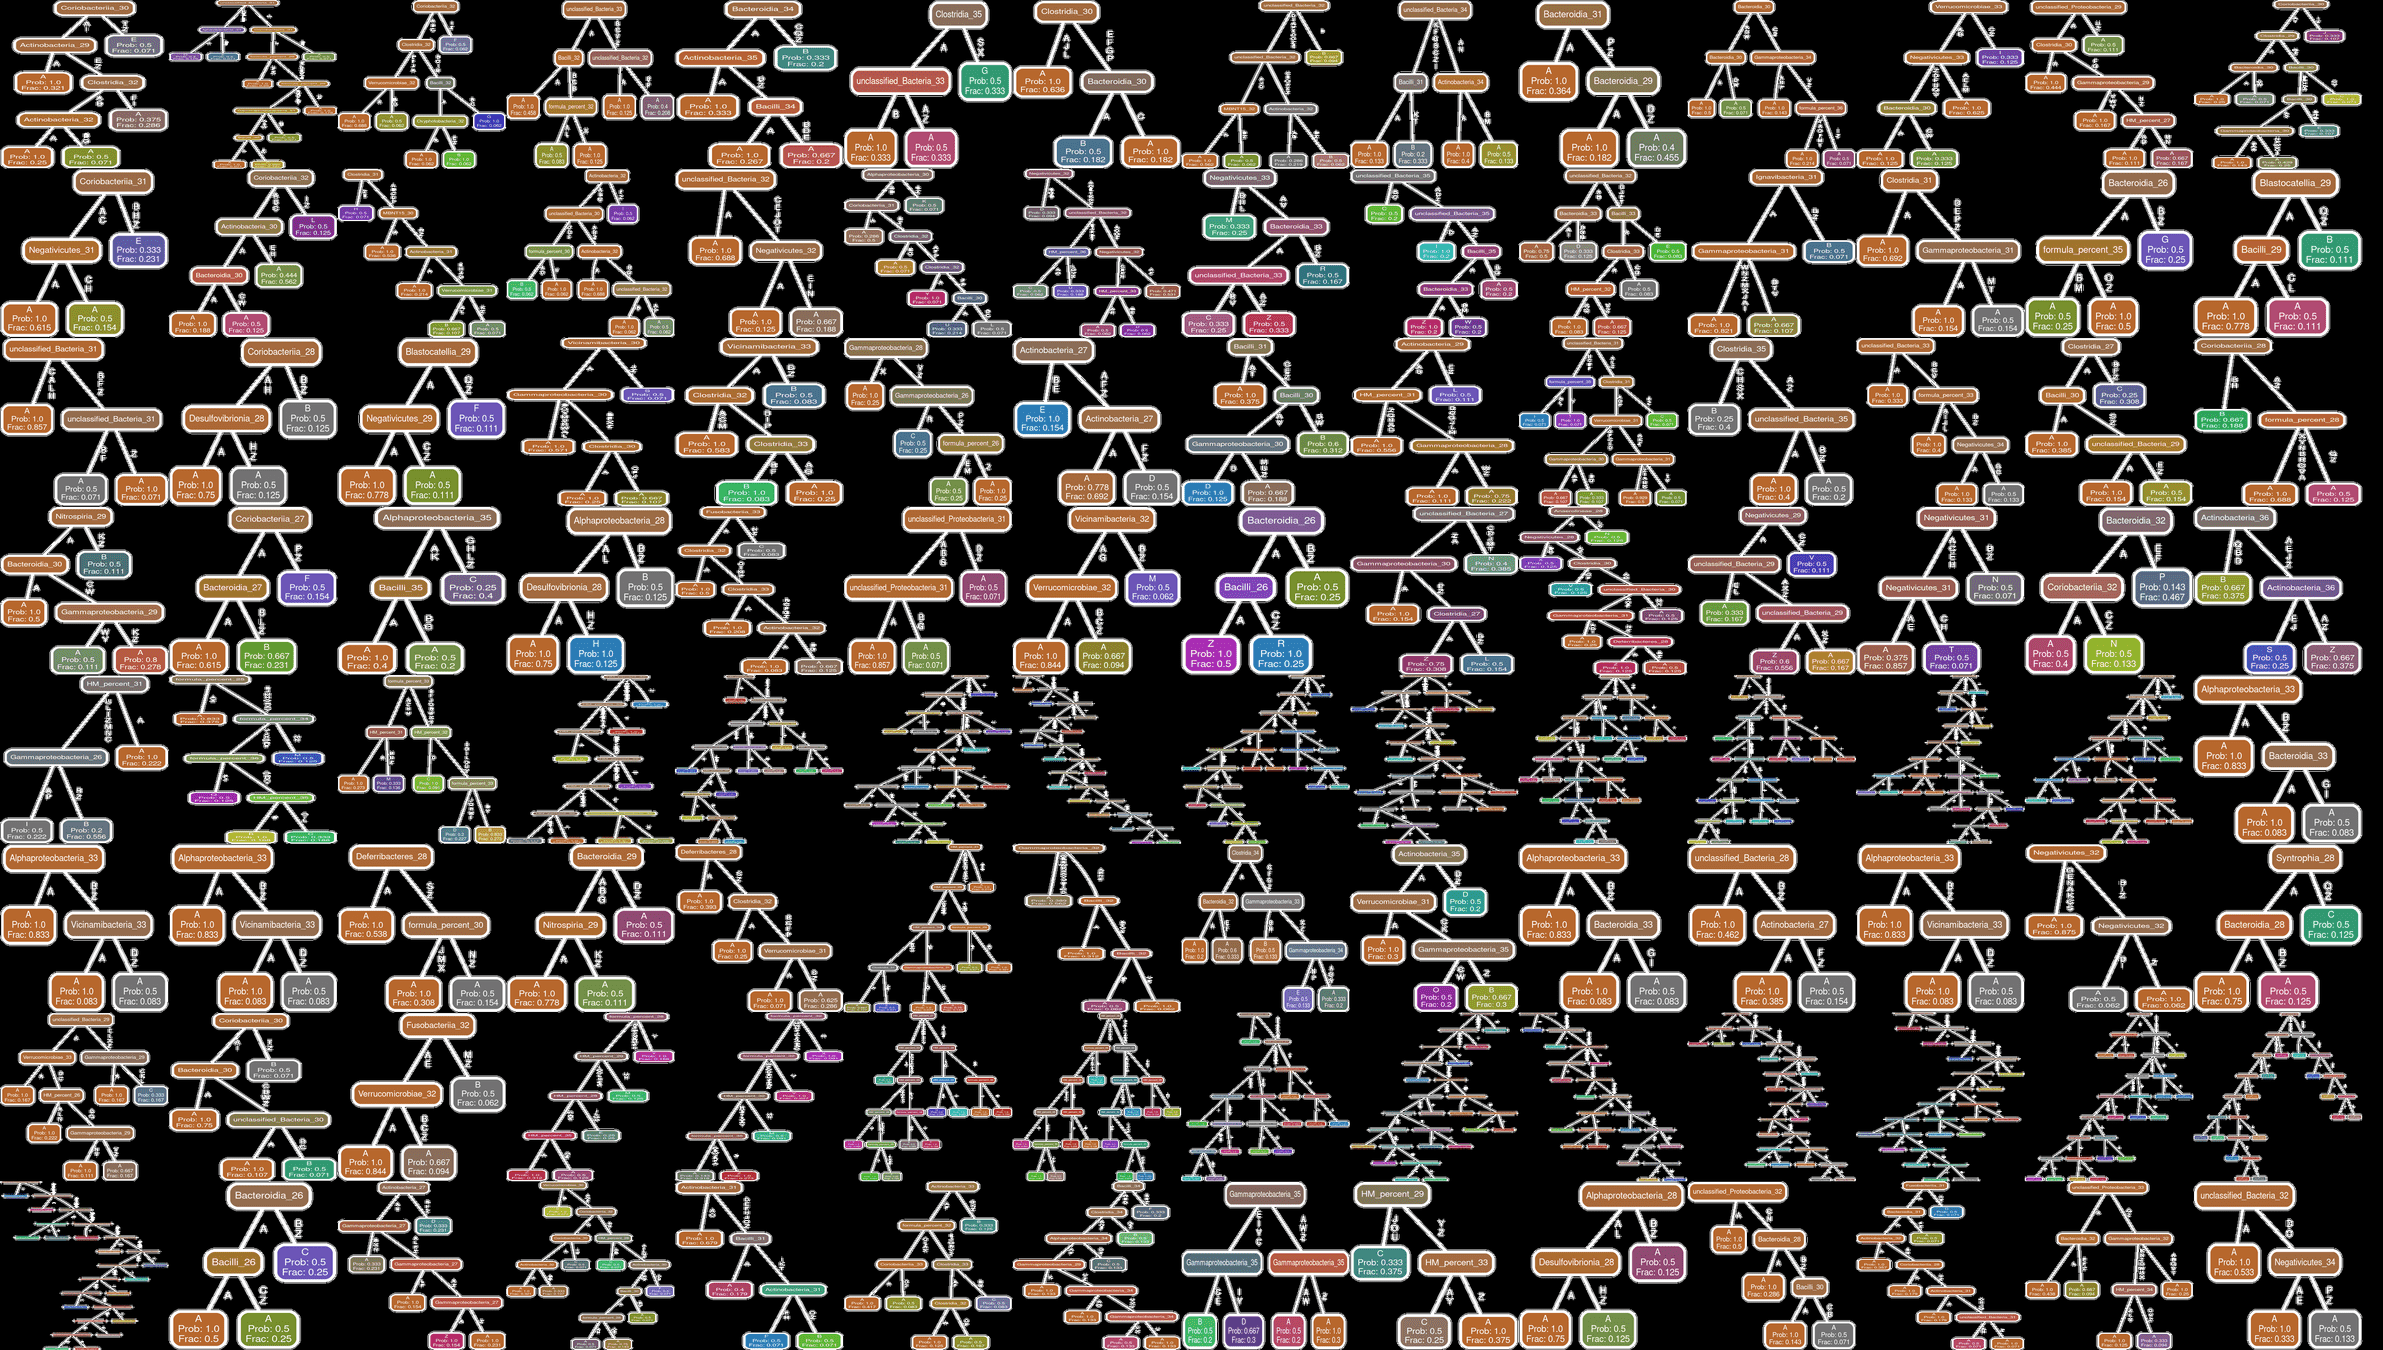
How different are the individual estimators for typical and dysbiotic models?
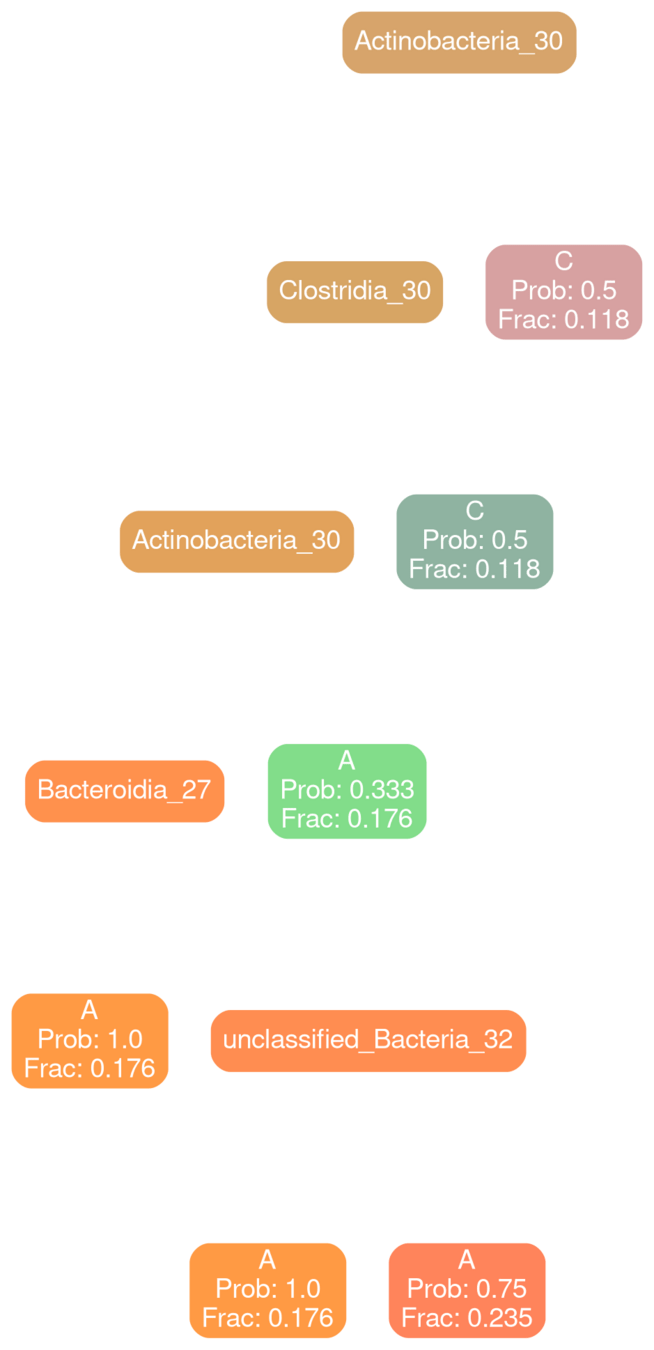
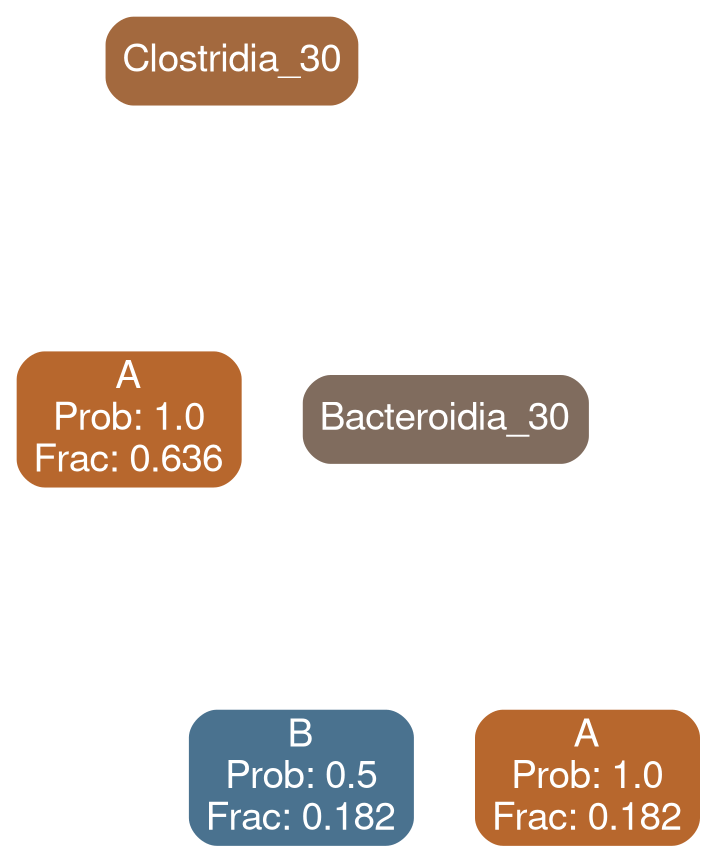
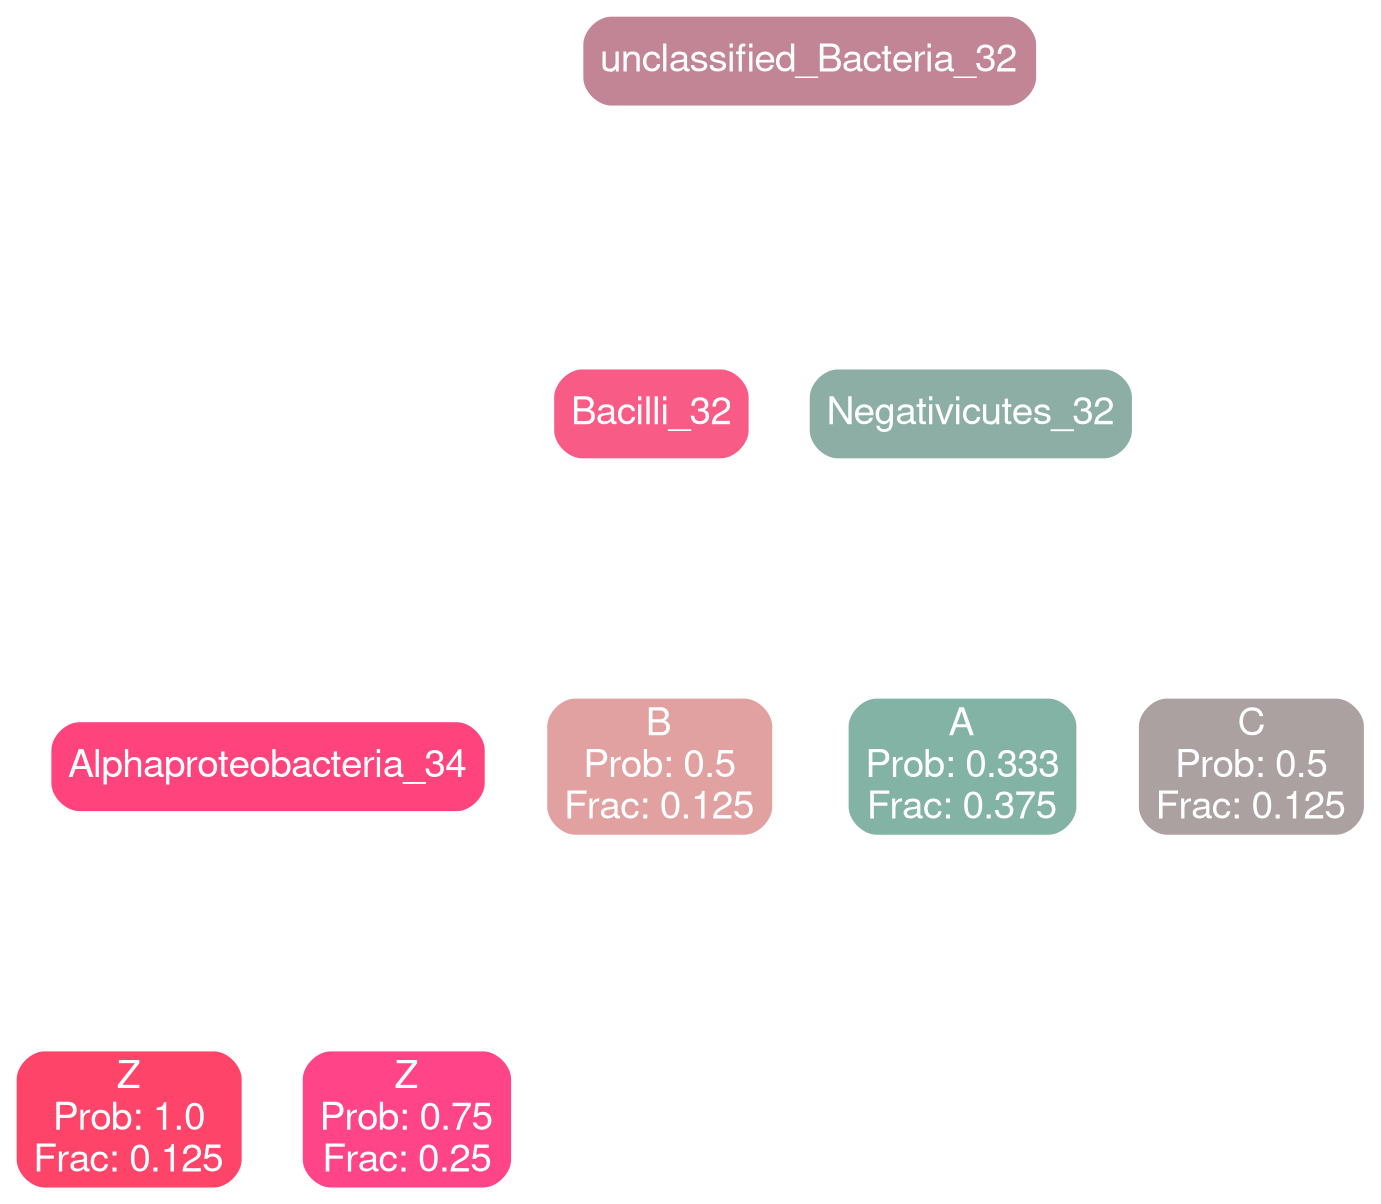
Bacilli 30
typical
deficit
Coriobacteria 32
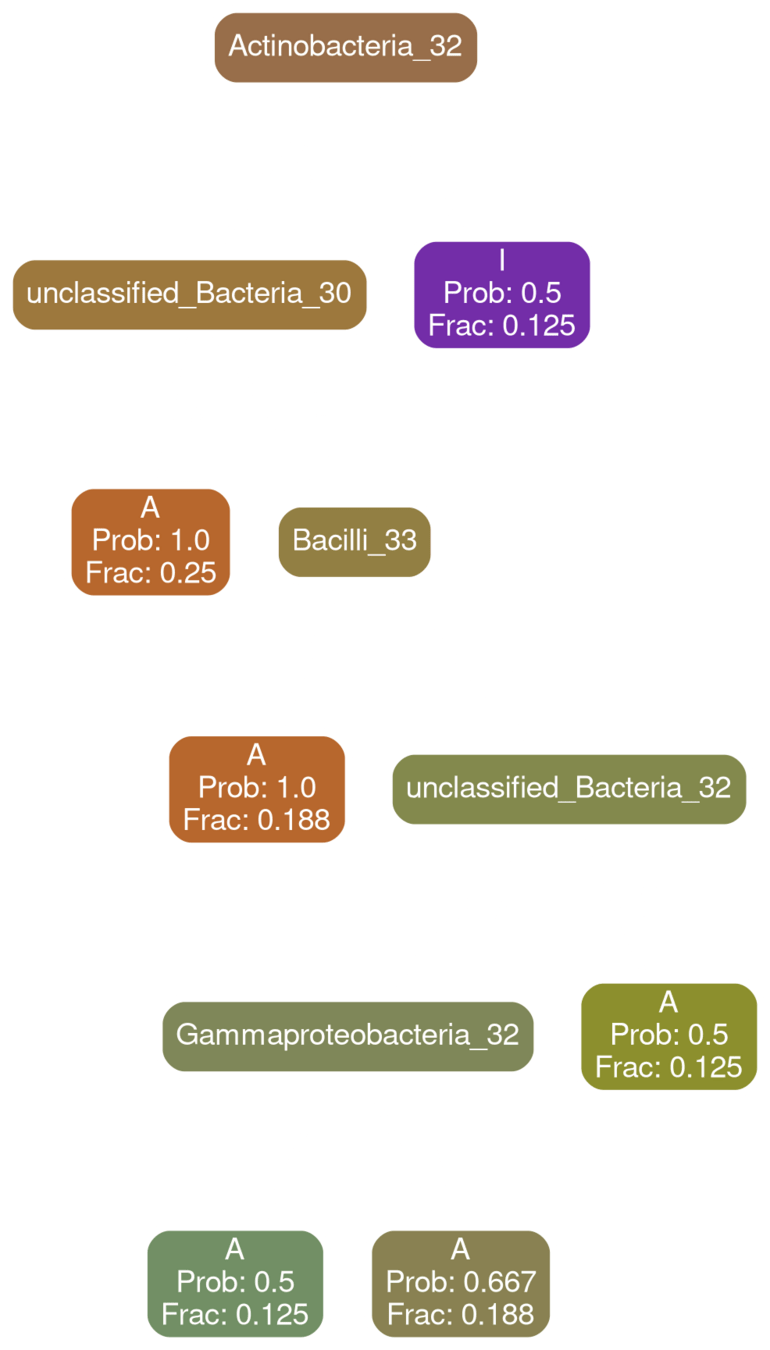
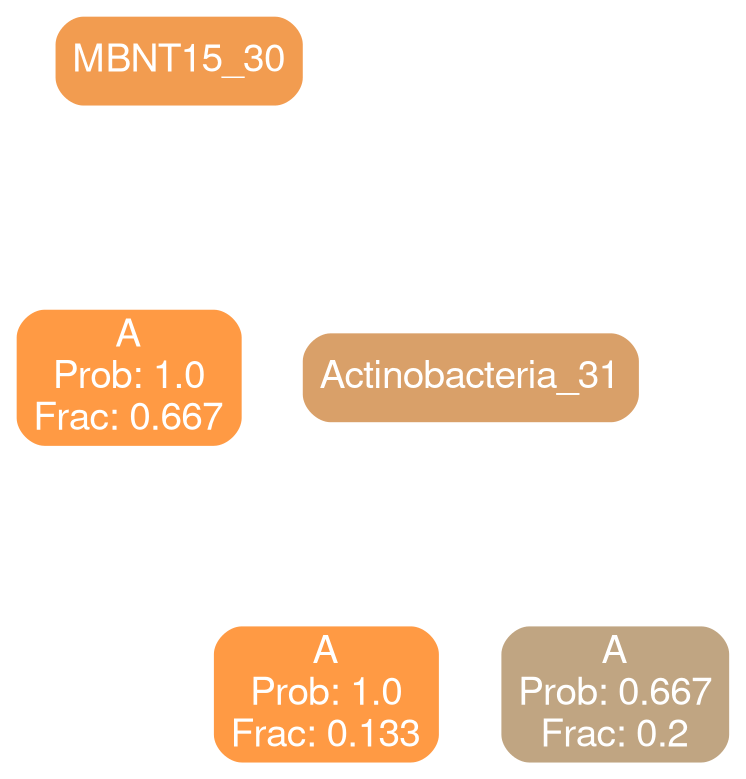
typical
deficit
Gammaproteobacteria 32
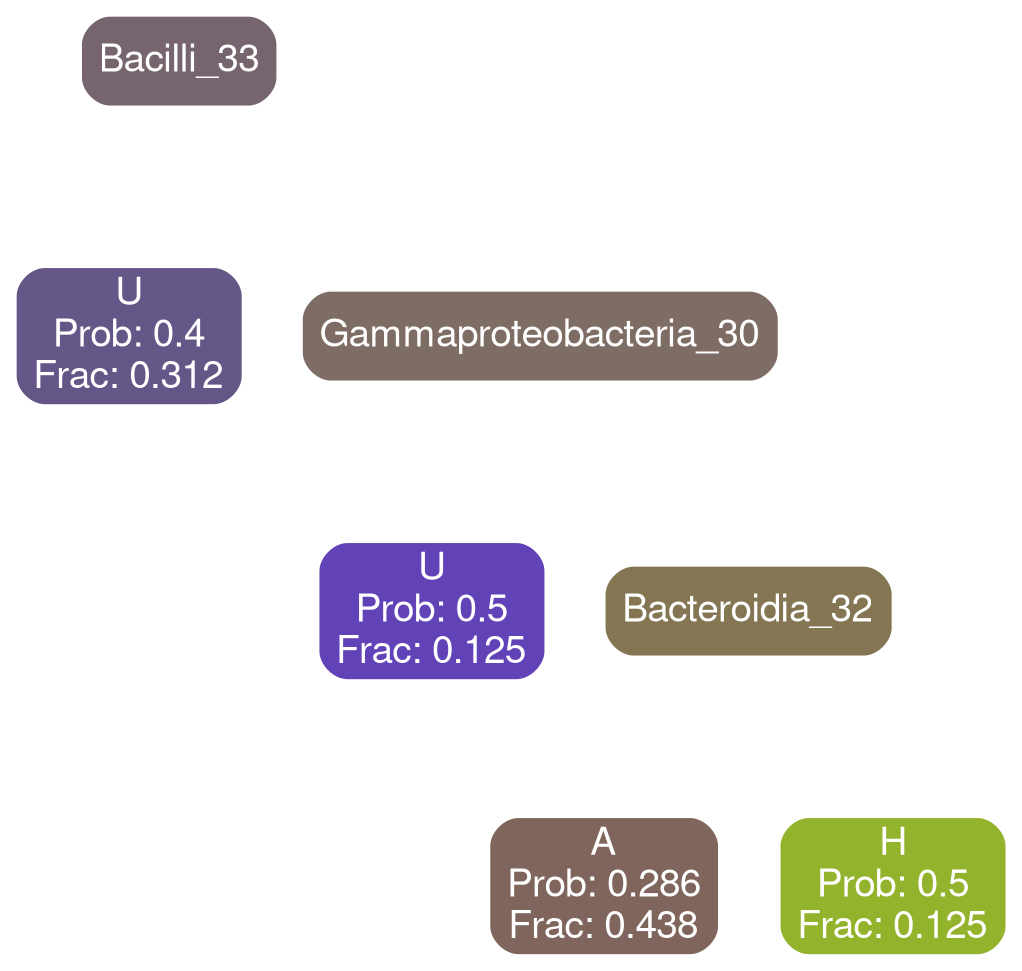
typical
deficit
All Patients
Feeding Variables added
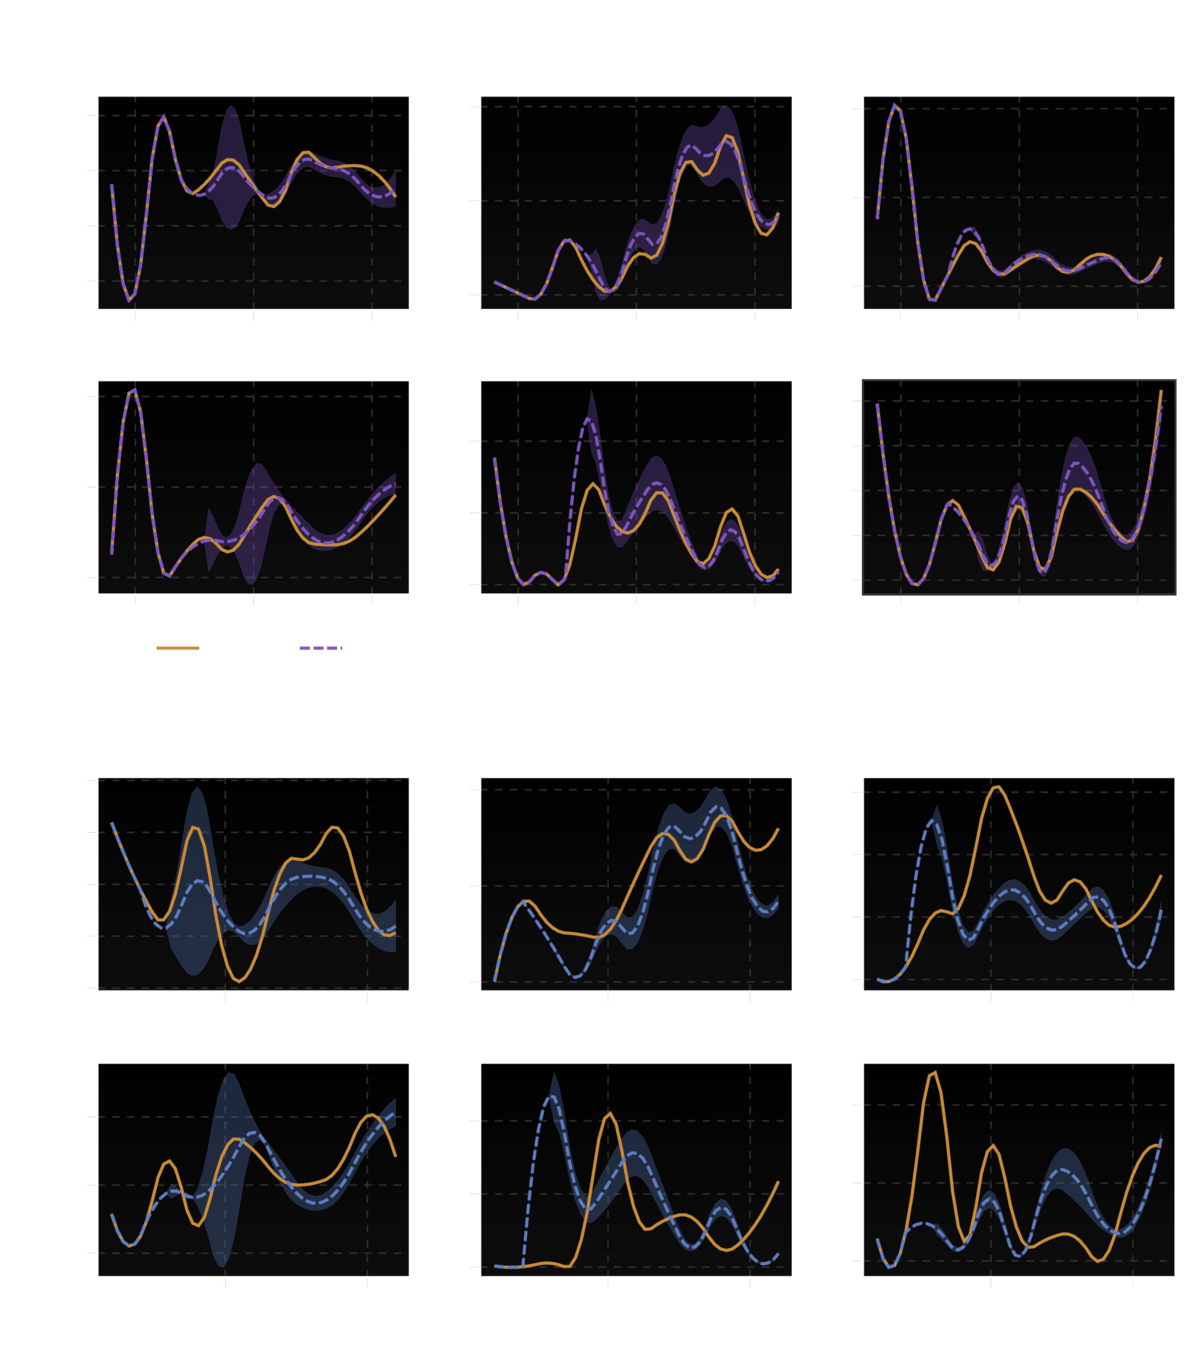
Forecasting of class abundance variations both
in-sample (\( R^2 \ge 95\%\))
and out-of sample (\(R^2\ge 72\%\))
Forecasting of class abundance variations both
in-sample (\( R^2 \ge 95\%\))
and out-of sample (\(R^2\ge 72\%\))
Building classifier based on LSM metric
moving the top drivers impact risk of deficit maximally
Understanding Key Drivers via LSM perturbations
Just add those microbes back?
No! The LSM indicates that supplantations need to be patient specific
No transplantation is guaranteed to work reliably
Predicted to reduce
risk reliably
Predicted to reduce
risk reliably
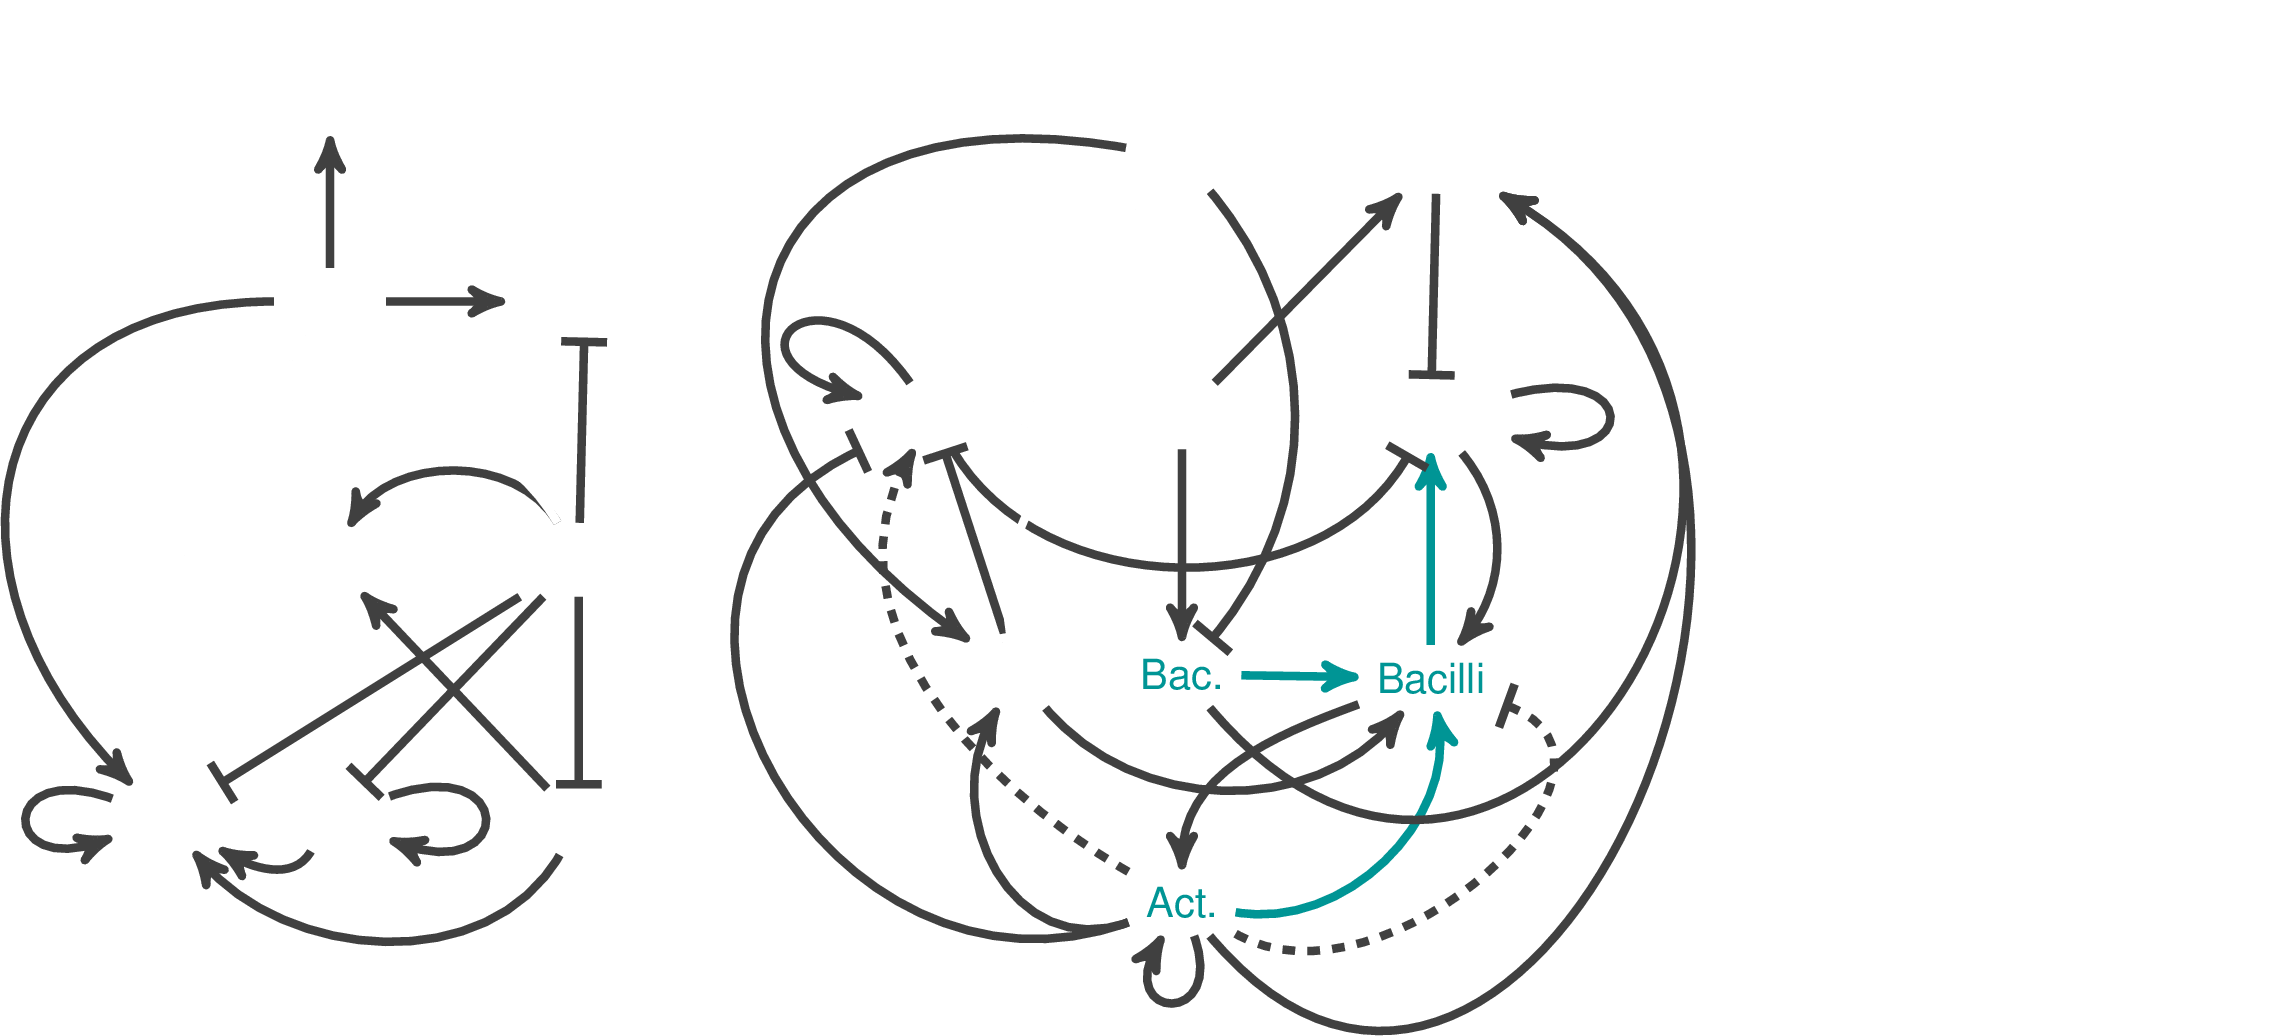
Network Interpretations? We see clear differences between two cases
Typical
Deficit
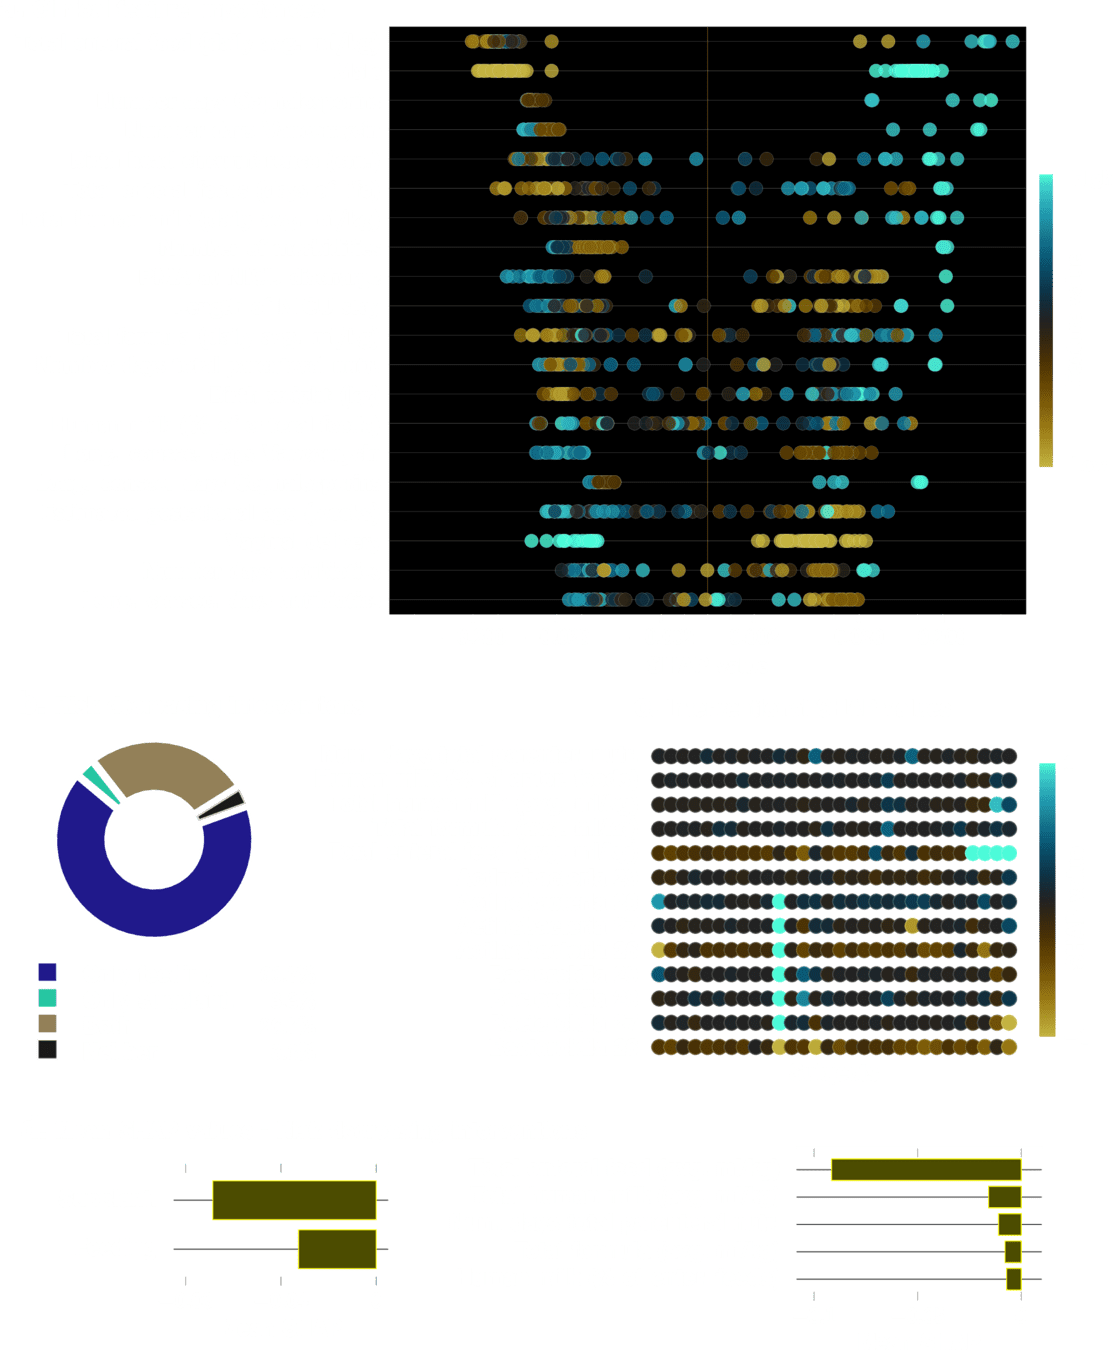
Integrating Clinical Features
IBD Metabolomics: Preliminary Results
Dataset from Metabolomics Workbench
| Study ID | ST000923 |
|---|---|
| Study Title | Longitudinal Metabolomics of the Human Microbiome in Inflammatory Bowel Disease |
| Institute | Broad Institute of MIT and Harvard |
|---|---|
| Last Name | Avila-Pacheco |
| First Name | Julian |
| Submit Date | 2017-11-14 |
| Num Groups | 3 |
| Total Subjects | 546 |
| Num Males | 276 |
| Num Females | 270 |
| Analysis Type Detail | LC-MS |
State-of-art microbiome based Classification (~10 species) *
| IBD vs UC | 0.82 |
| IBD vs CD | 0.76 |
*Zheng, J., et al. (2024). Noninvasive, microbiome-based diagnosis of inflammatory bowel disease. Nature Medicine, 30(12), 3555–3567. https://doi.org/10.1038/s41591-024-03280-4
| IBD vs non IBD | 0.85 |
Gut-Metabolome based Classification (~36 metabolites) *
Application 2

Large Science Models
1. How will proposer form and maintain a computationally tractable LSM tree structure given, as proposed, hundreds to thousands of observable variables?
\(\checkmark\)
- Each predictor is inferred independently
- Can scale up to thousands of variables in Python implementation
- Further scale-up \(10^6 - 10^8\) needs C/C++ implementation
https://34.66.189.202/data/trees_mbol_UC
Full Example of Hyperlinked Trees
Metabolomics
LSM model
- No. parameters: 70 million
- Out of sample n=150
- Uses all names and unnamed metabolites (>81K features)
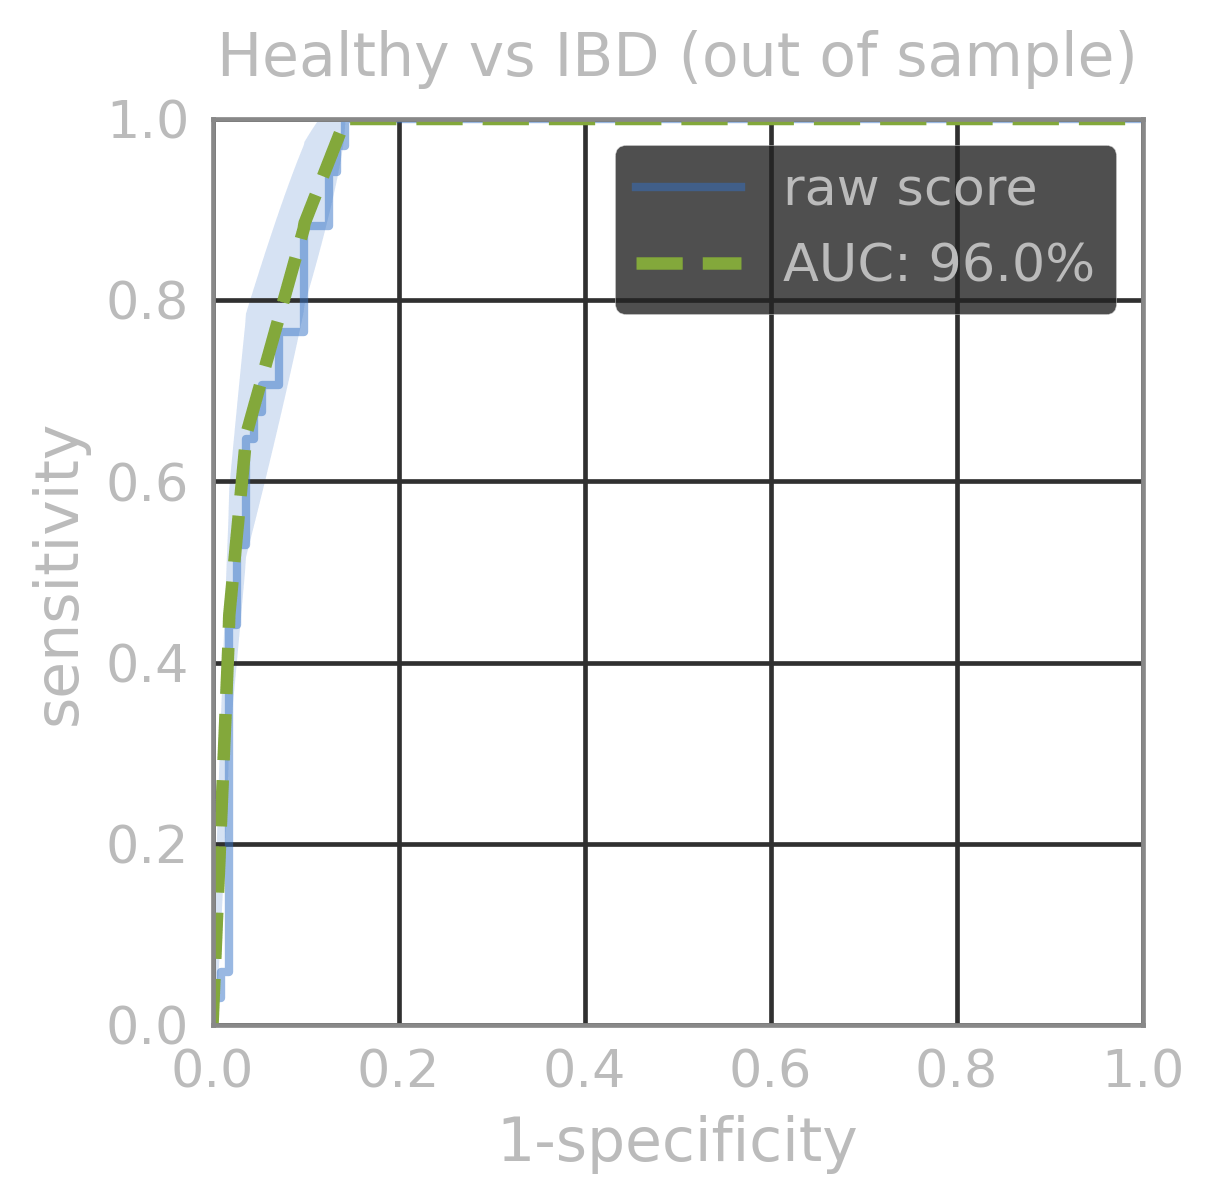
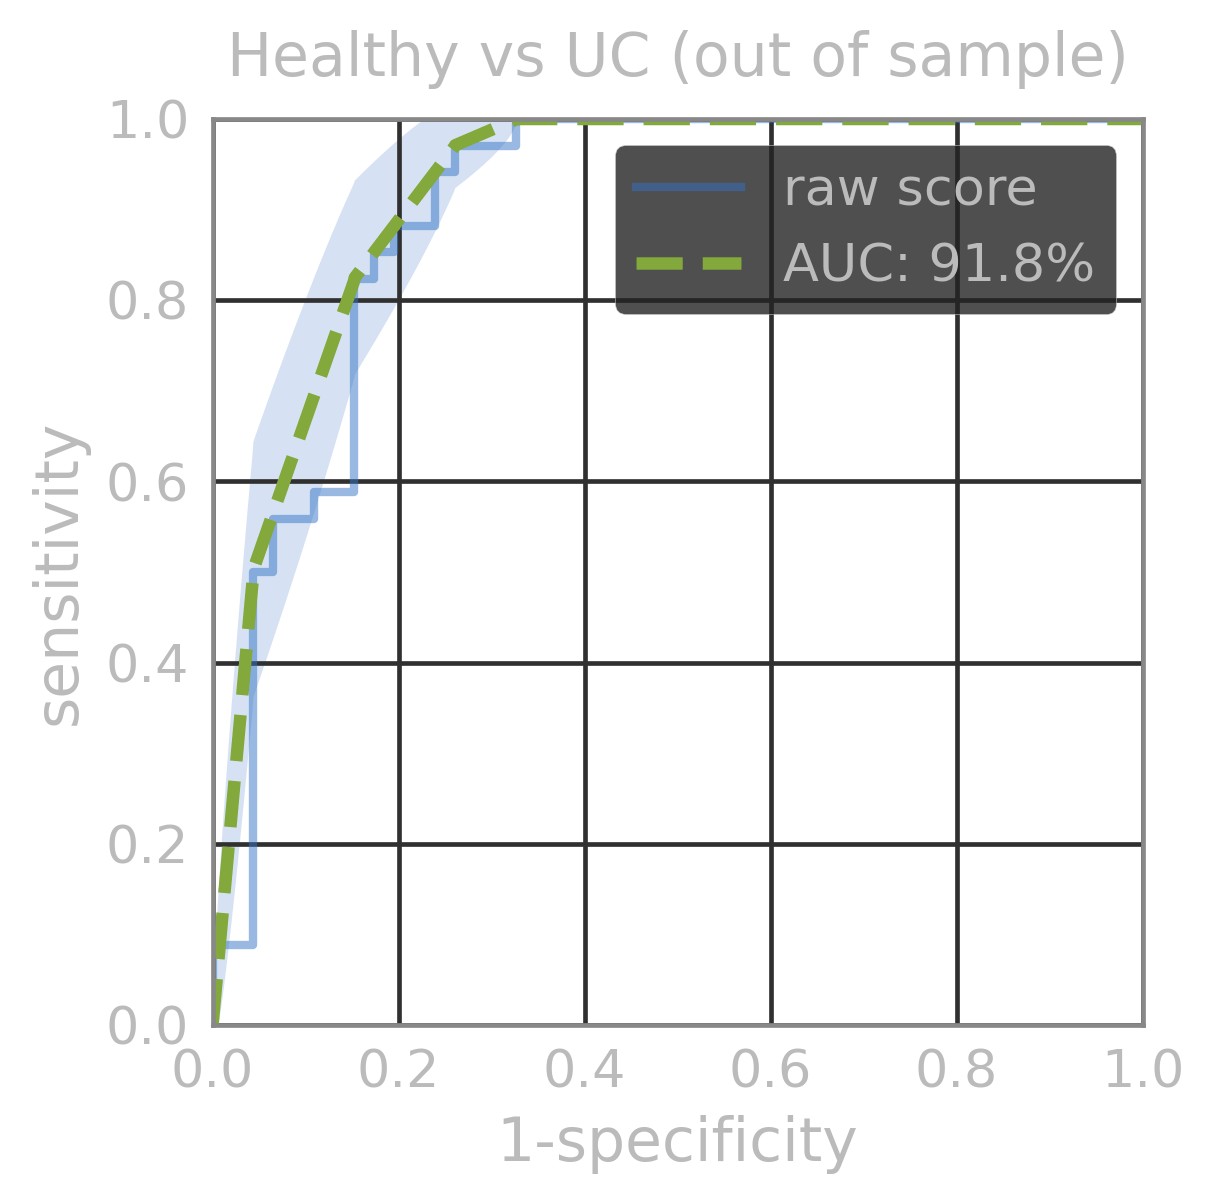
| AUC (out of sample) | |
|---|---|
| Healthy vs IBD | 96.1% |
| Healthy vs UC | 92% |
| UC vs CD | 99% |
| Healthy vs CD | 99% |
Metabolomics
LSM model
- No. parameters: 70 million
- Out of sample n=150
- Uses all names and unnamed metabolites (>81K features)
| AUC (out of sample) | |
|---|---|
| Healthy vs IBD | 96.1% |
| Healthy vs UC | 92% |
| UC vs CD | 99% |
| Healthy vs CD | 99% |
Metabolomics
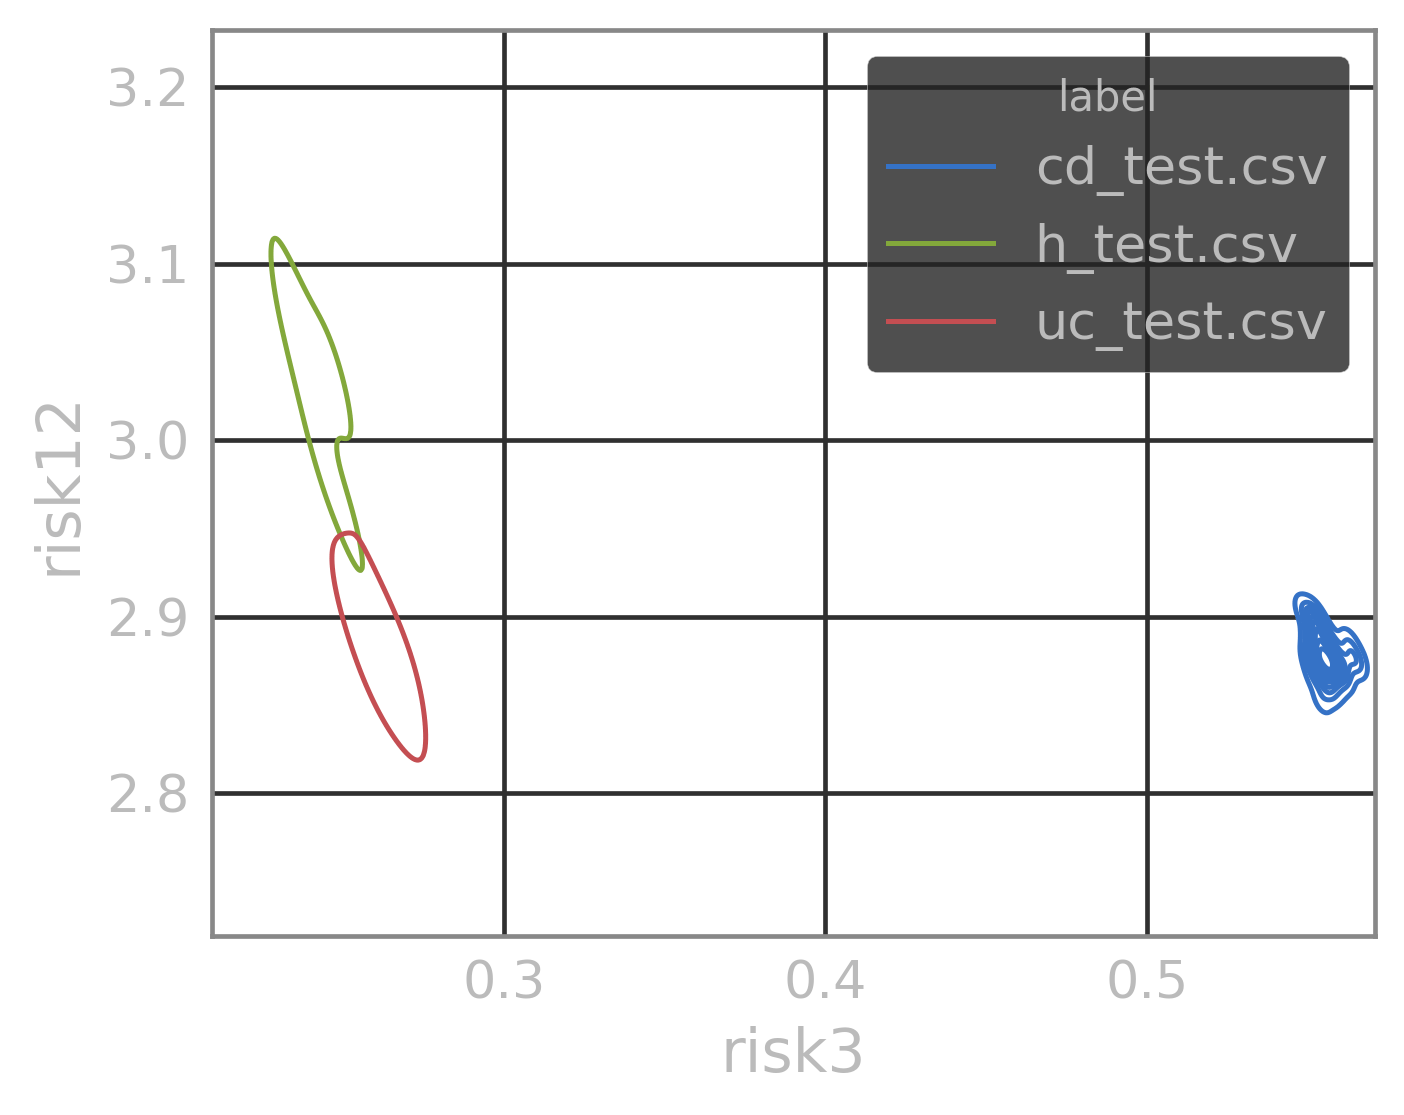
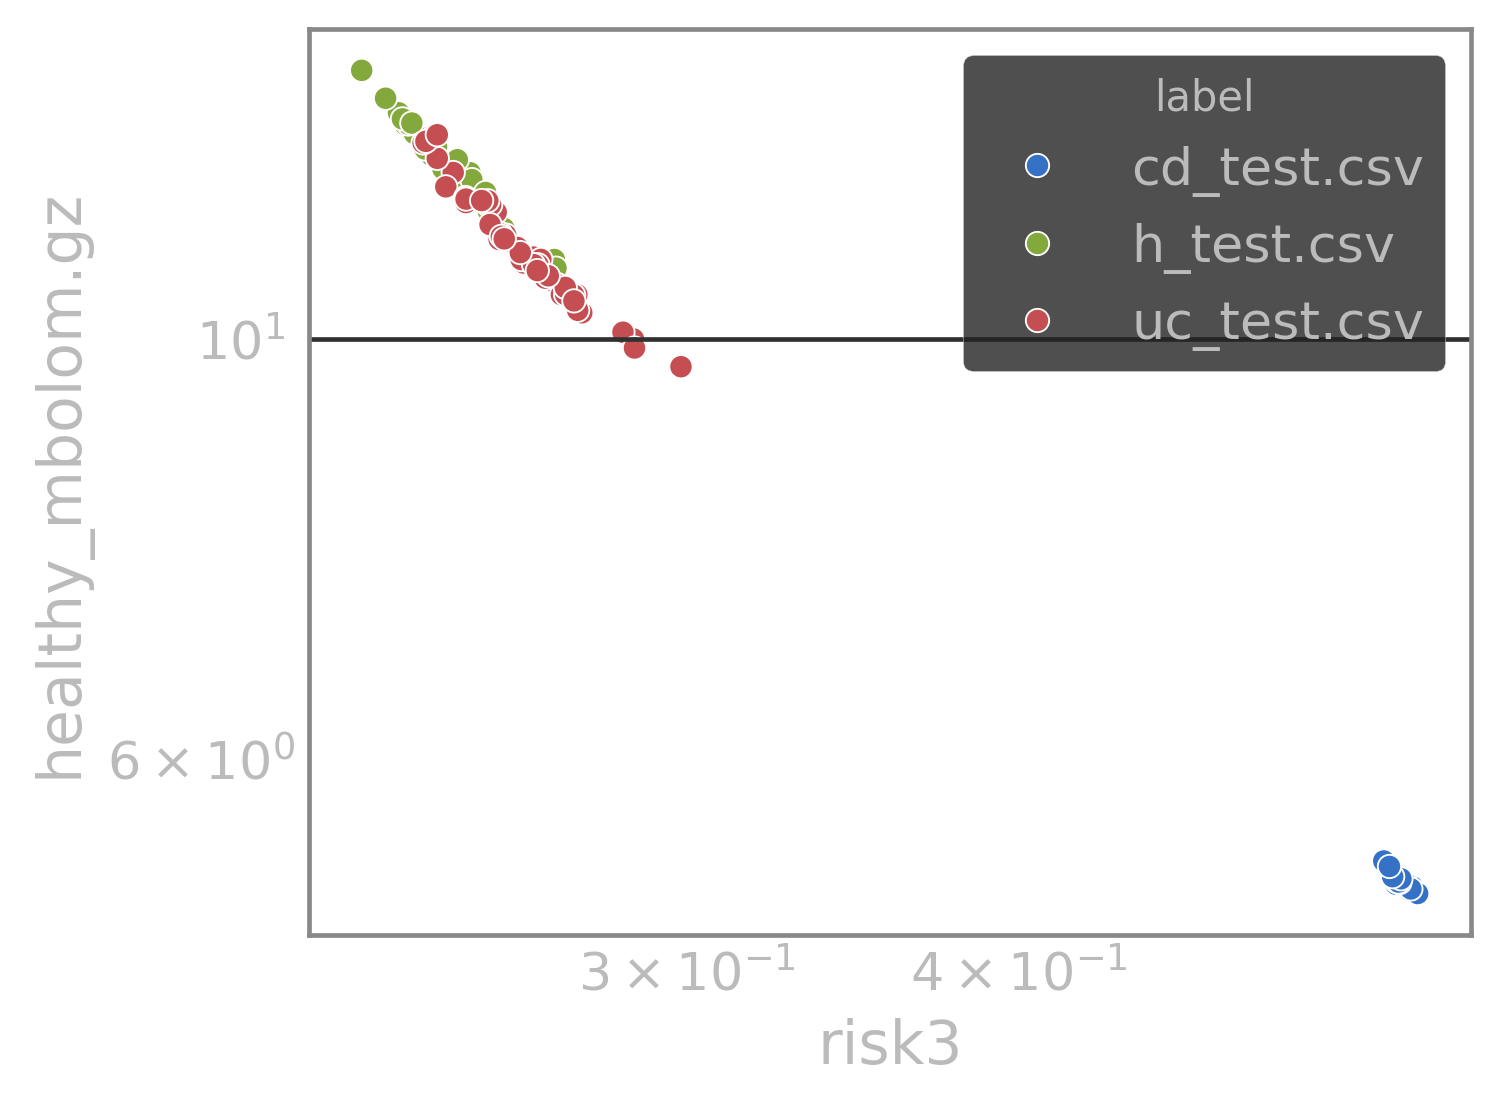
Insight: the discriminating hypersurface is 2d (almost 1d)
| Number of metabolites | 5,280 | 85% untargeted metabolites |
|---|---|---|
| Number of parameters | 4,002,306 | |
| Average Tree Depth | 38.62 | |
| Number of constraints inferred | 108,884 | ~83% involve untargeted metabolites |
| Number of samples used | 180 | (no clinical phenotype information used) |
-
Using all samples of metabolite profiles
-
Not using clinical phenotypes and replicates
Application 3
ASD Metabolics: Preliminary Results

ASD Metabolics: Preliminary Results
ASD sample profile
ASD samples from same patient
sample profile of new patient \(y\)
Need one patient!
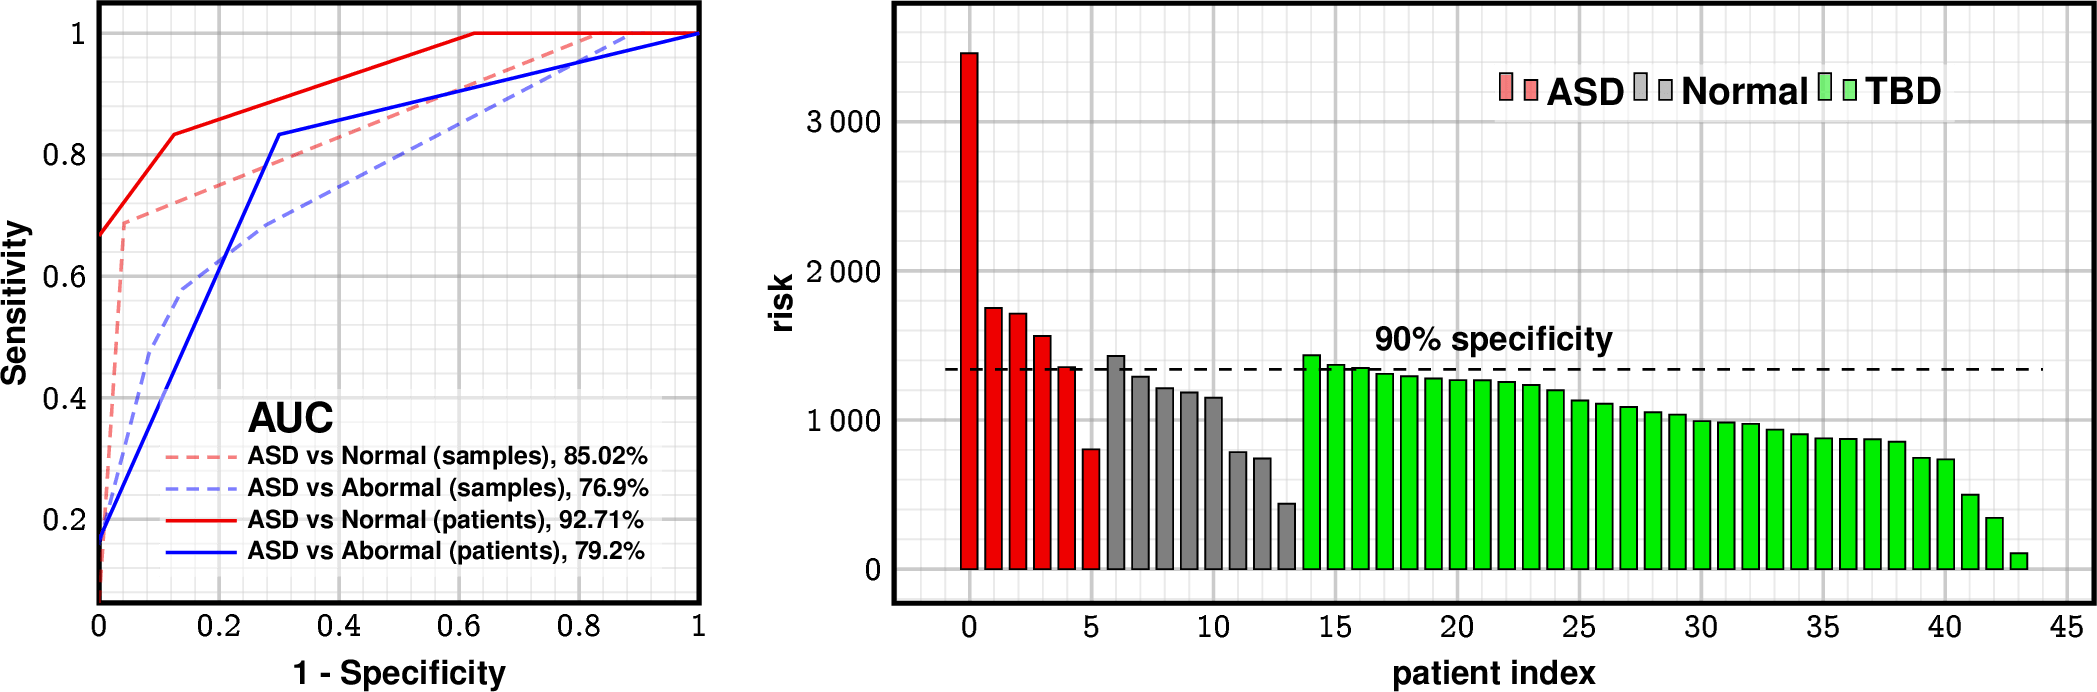
Predictive Performance
| AUC | Sensitivity at 95% spec | |
|---|---|---|
| LSM | 92.7% | 74% |
| MCHAT/F | 67% | 39% |
| ADOS-2 | 90-97% | 85% |
getting close to the gold standard
1 false positive
1 false negative
10% flag in TBD (expected 8.3% positives)
Predictive Performance
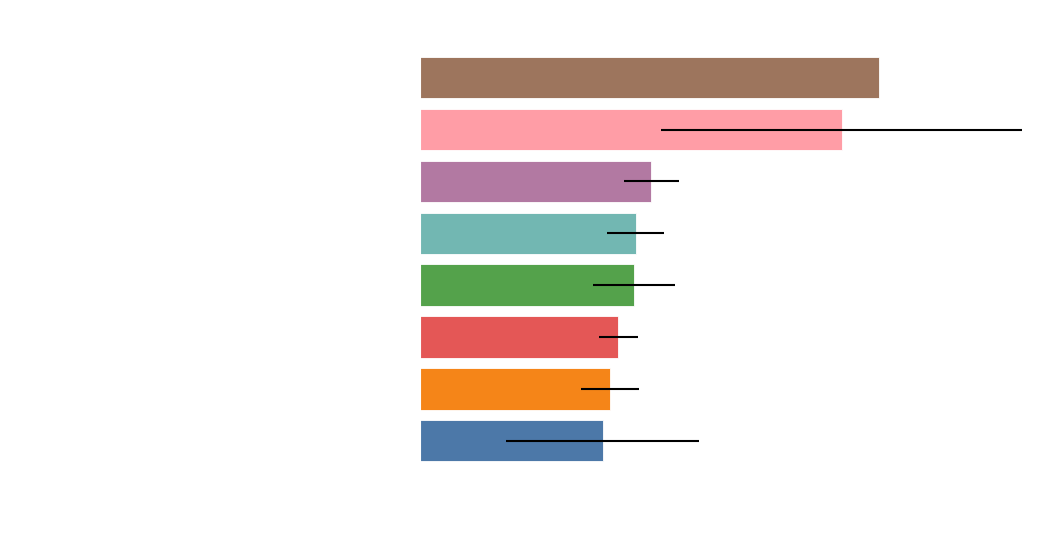
Top risk drivers mapped to known pathways
Patient specific driver profile
Average driver profile
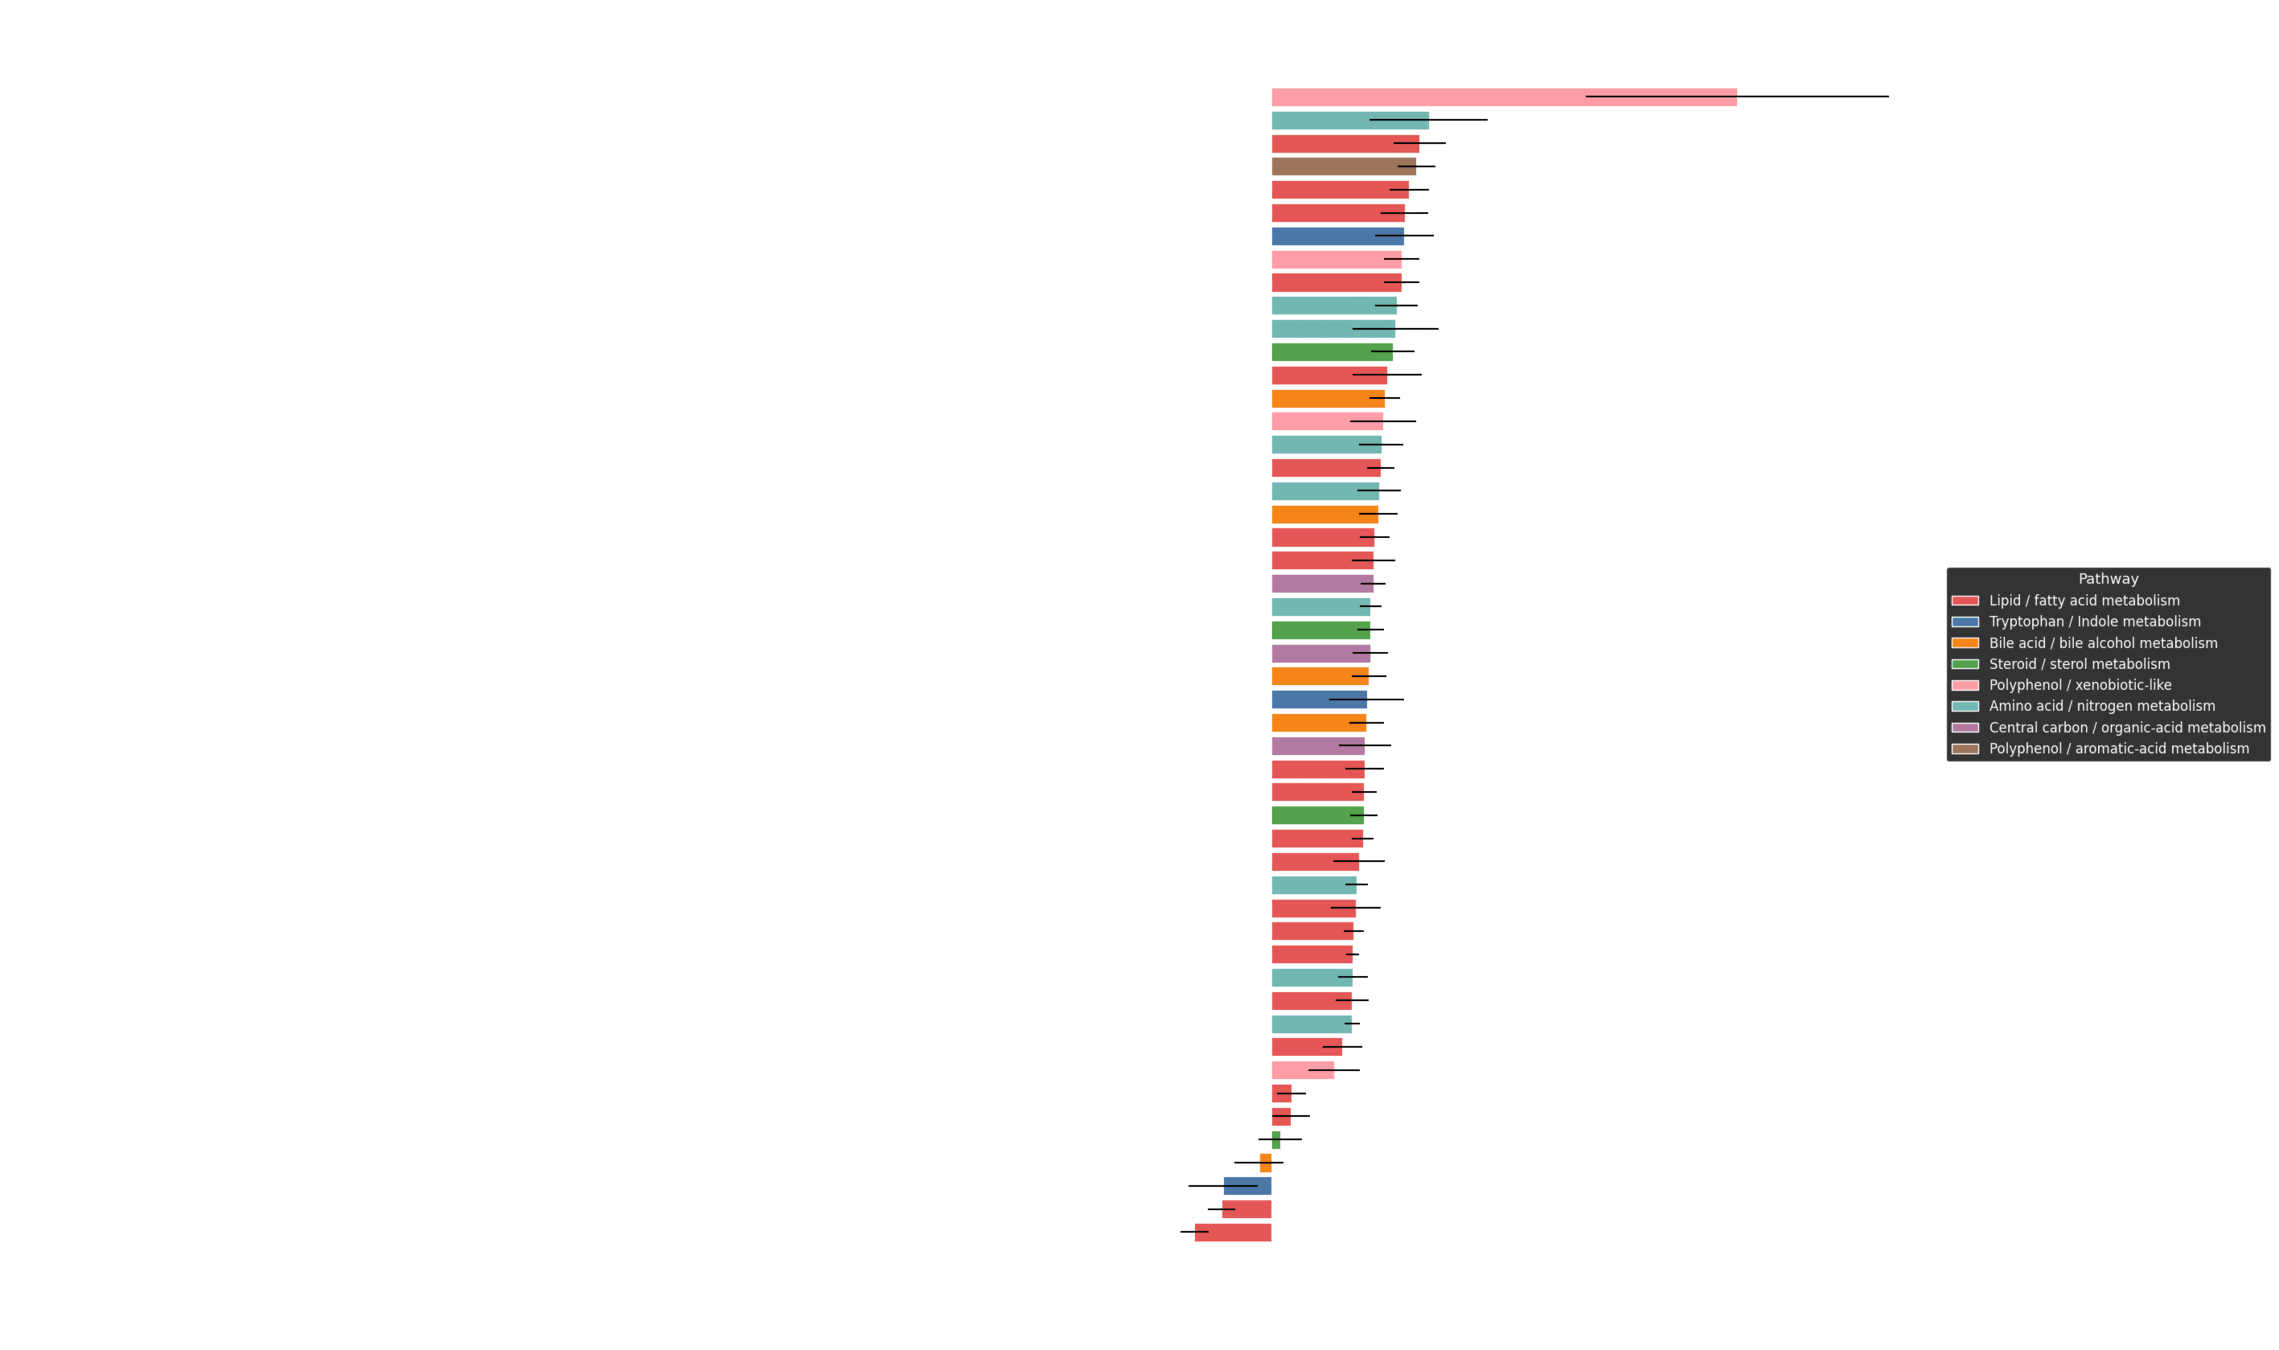
Top 30 risk drivers (targeted met.)
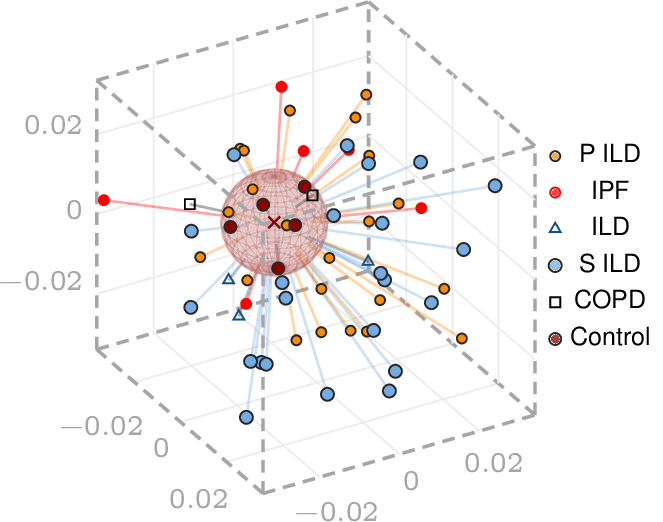
Tissue and Serum Metabolomics (Targeted and Untargeted) in Fibrotic Interstitial Lung Disease (F-ILD)
Uncovering latent geometry separating disease phenotypes
Application 4

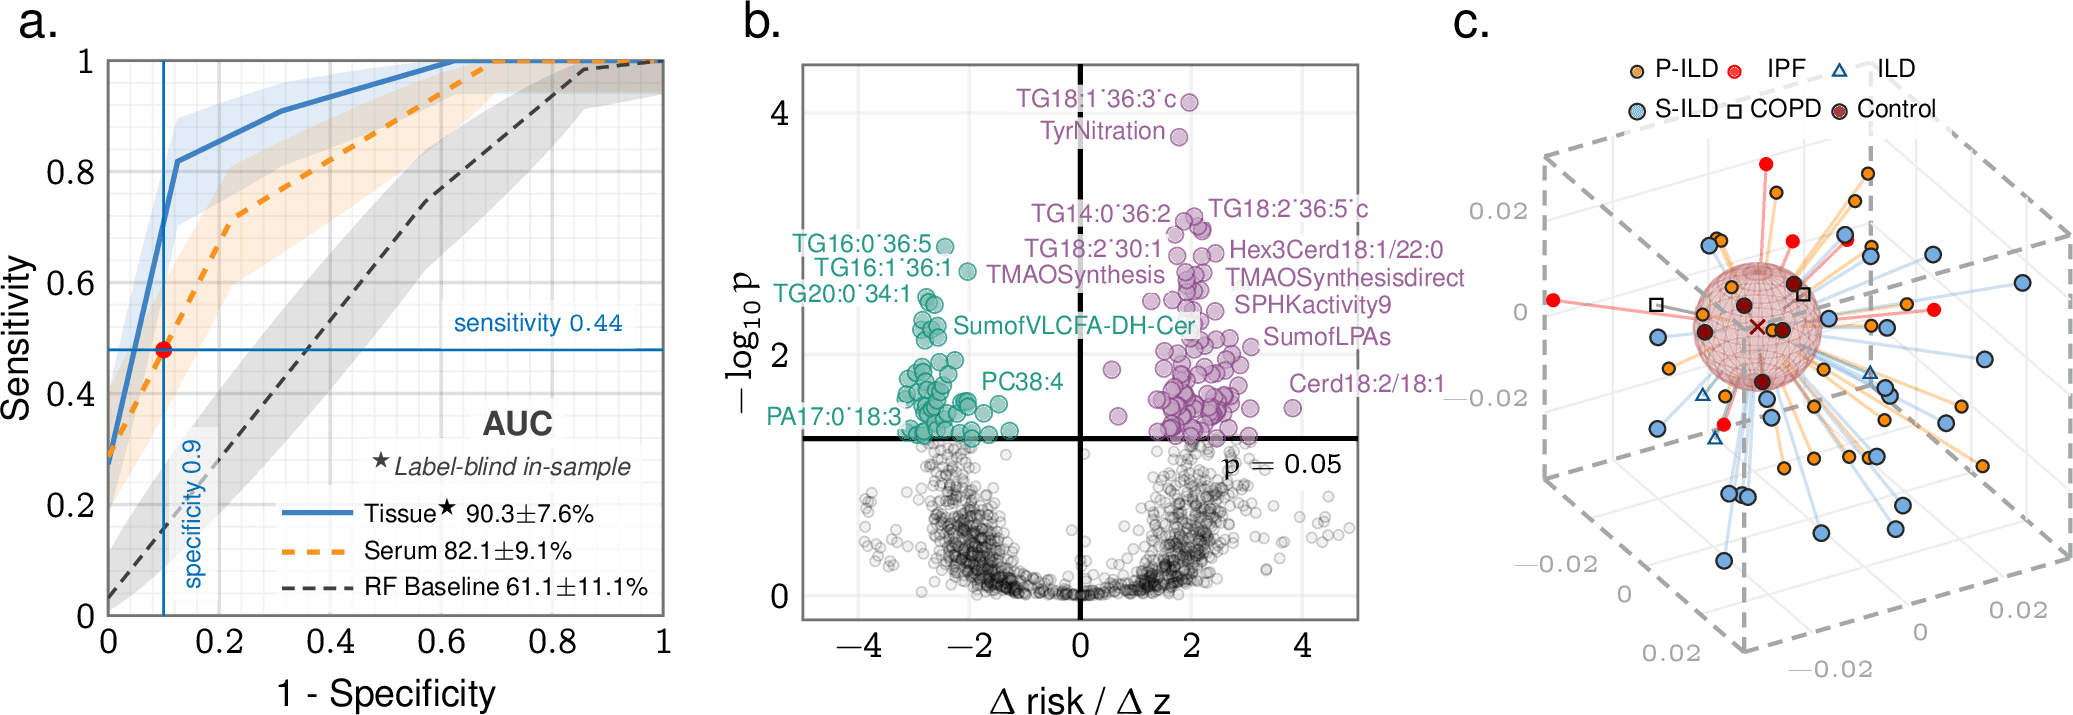
Tissue and Serum Metabolomics (Targeted and Untargeted) in Fibrotic Interstitial Lung Disease (F-ILD)
Learn LSM with tissue samples -> Can disambiguate serum samples
LSM model for healthy profiles
What is a healthy Microbiome/ Metabolome?
Any profile generated by \(\mathcal{H}\) is a healthy profile, while they might be different from one another
A Universal Risk Index
average healthy profile

A New Paradigm of AI-driven Discovery in Metabolome Biology
Supplantation MUST be bacteroidia
Supplantation MUST be Actinobacteria
No risk-decreasing supplantation
*Hothorn, Torsten, Kurt Hornik, and Achim Zeileis. "Unbiased recursive partitioning: A conditional inference framework." Journal of Computational and Graphical statistics 15, no. 3 (2006): 651-674.
LSM Forest of Conditional Inference Trees*
Revealing Emergent Cross-talk between mutations in a viral protein (Influenza A HA)
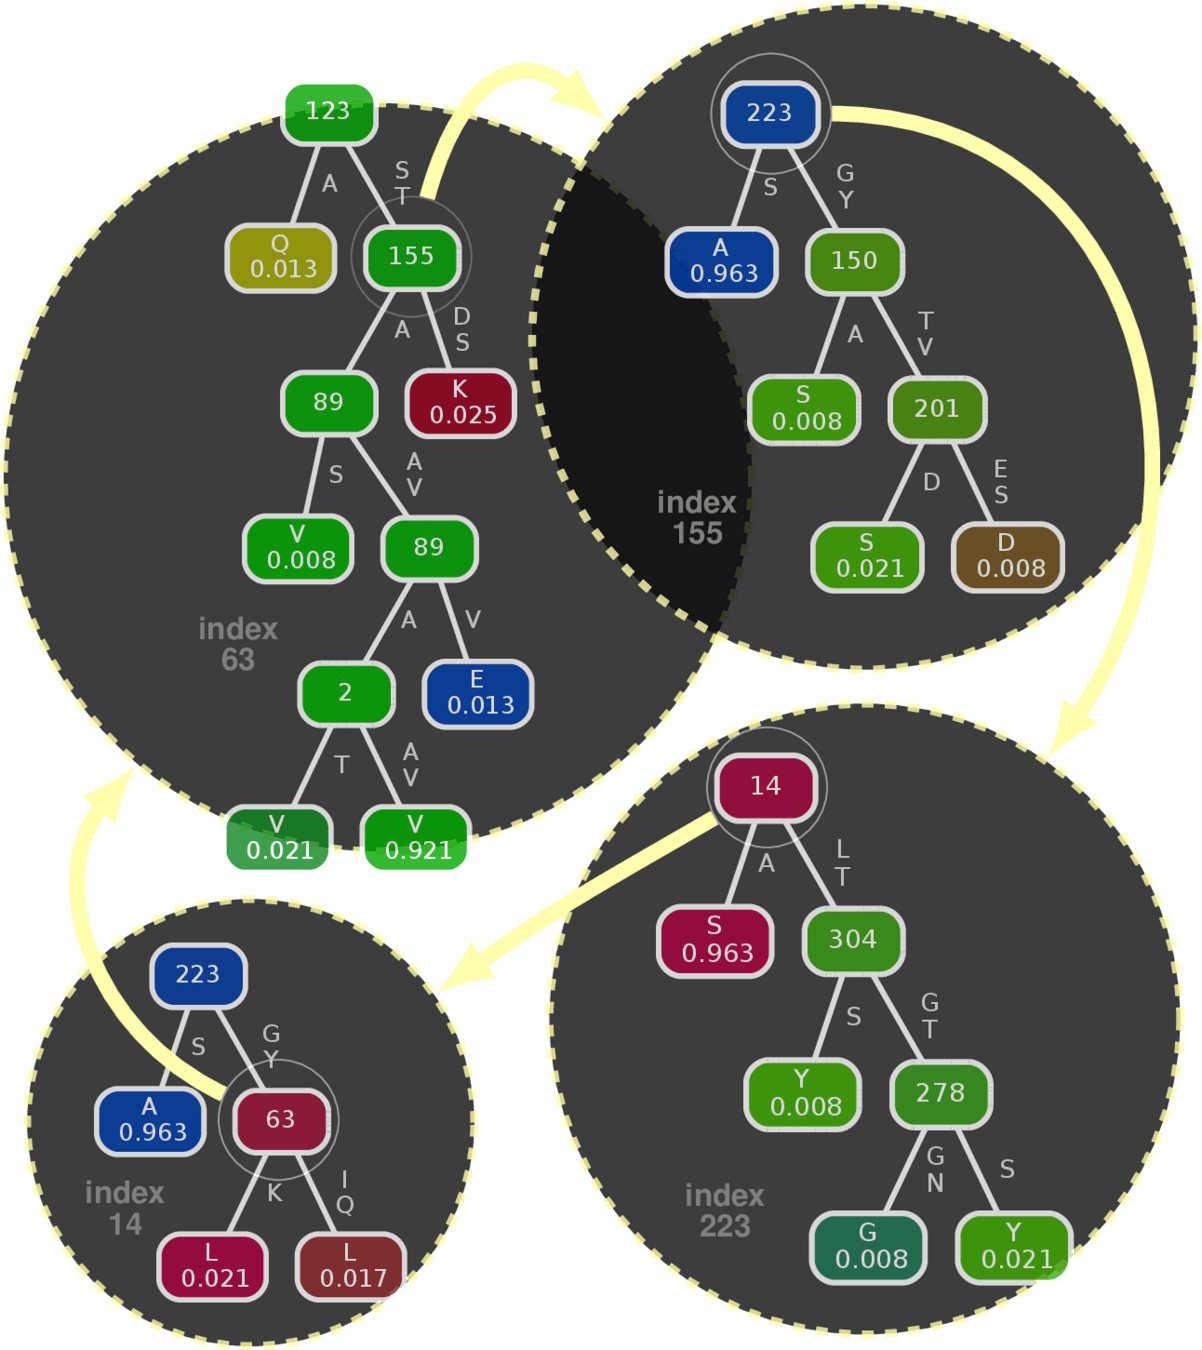
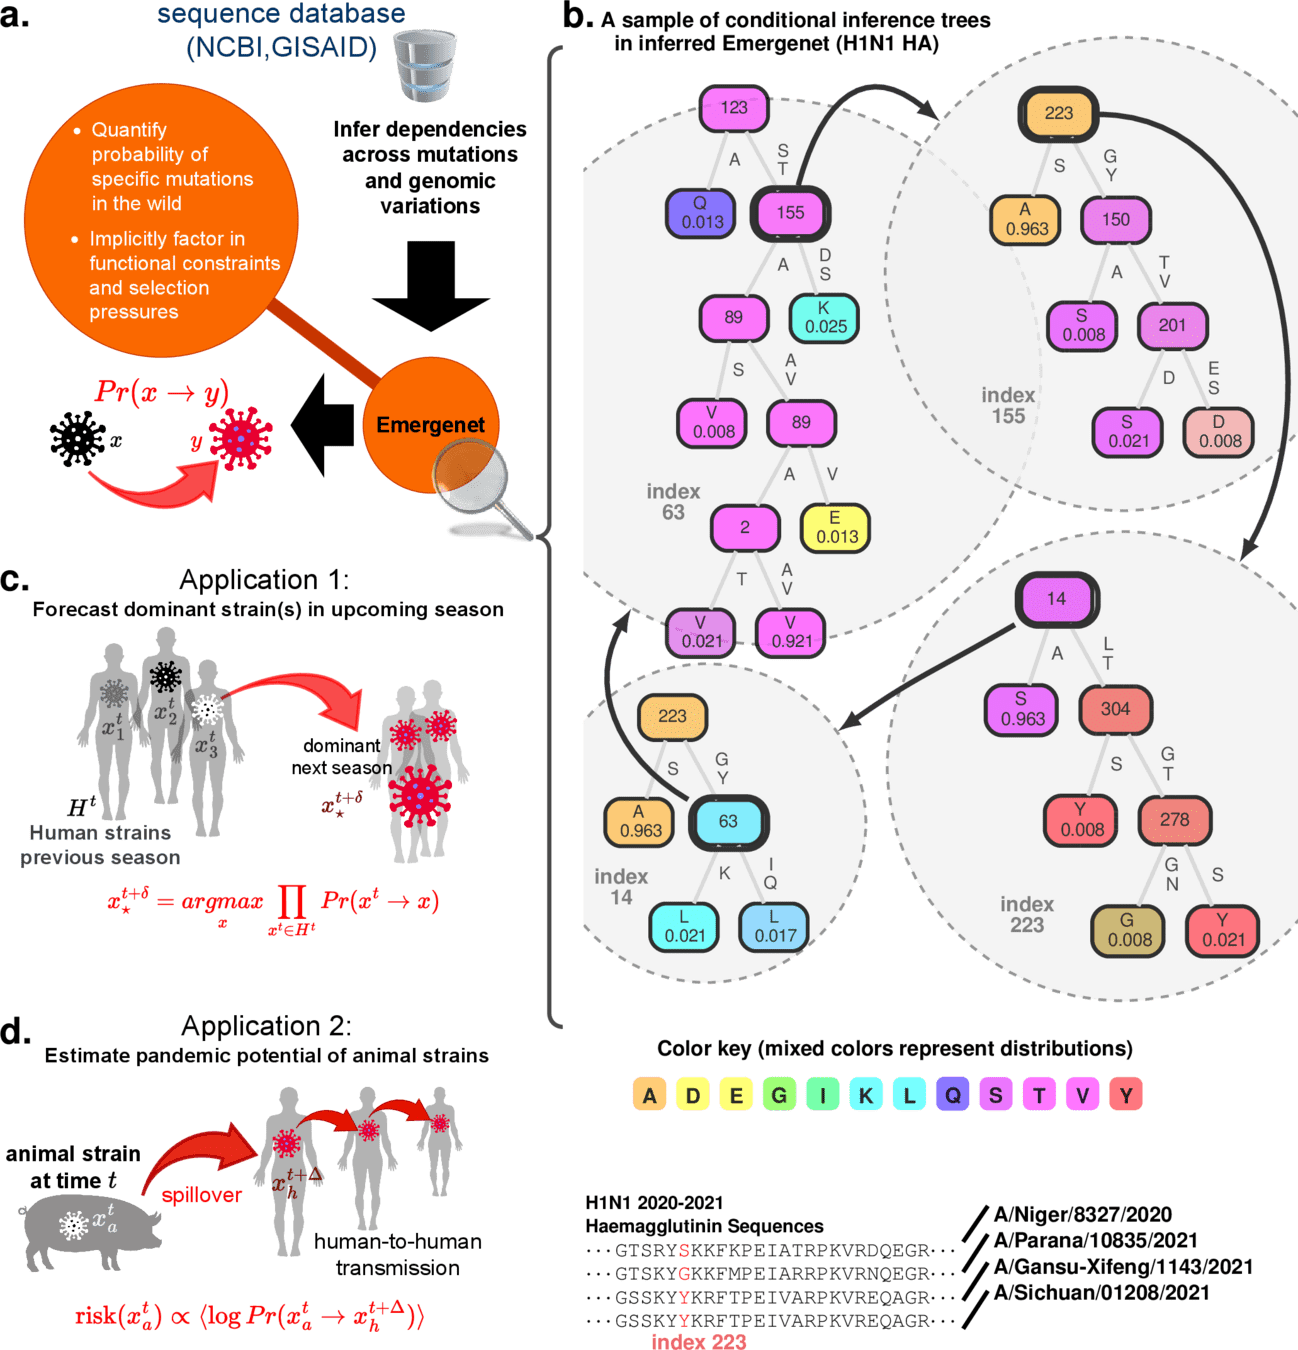
Component predictor (Conditional Inference Tree*)
Example: Influenza A HA protein
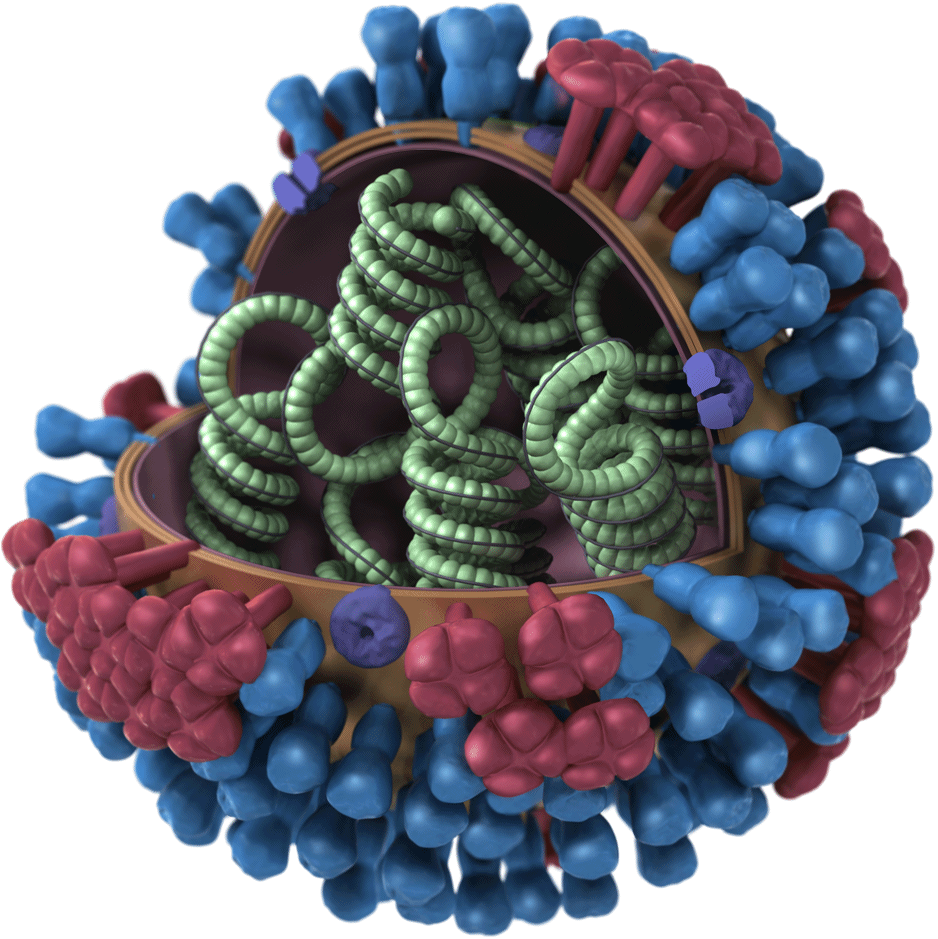
Large Science Models: Properties
LSM-Distance Metric*
where \(D_{JS}(P\vert \vert Q)\) is the Jensen-Shannon divergence.
Large Deviation Bound*
Induced Riemannian metric tensor
This bound connects ``closeness'' of samples to the odds of perturbing from one to the other, bridging geometry to dynamics
Ergodic Projection
(Sanov's Theorem, Pinkser's Inequality)
\(\psi\)
\(\psi'\)
\(\theta\)
"spatial average": average of all plausible worldviews or states
* Sizemore, Nicholas, Kaitlyn Oliphant, Ruolin Zheng, Camilia R. Martin, Erika C. Claud, and Ishanu Chattopadhyay. "A digital twin of the infant microbiome to predict neurodevelopmental deficits." Science Advances 10, no. 15 (2024): eadj0400. https://www.science.org/doi/full/10.1126/sciadv.adj0400
persistence probability
Ergodic dispersion
Central to Model Drift Quantification
Start with opinion vector with all entries missing
This is a standard Physics construct, quantifying curvature of the underlying latent geometry
Easily computable in LSM framework!
Apply \(\phi^i\)
Random variable quantifying dispersion around the spatial average of worlviews
const. scaling as \(N^2\)
Digital Twin Inference
- Consider ecosystem of many inbitants
- The abundunce of each entity is a variable
- The variables interact in complex ways
- We are going to model this cross-talk
The LSM Framework
Q-Net
recursive forest
Proposed Concept

- Develop Foundation models of complex systems with
- hundreds to thousands of evolving variables with apriori unknown cross-talk
- no governing equations are know a priori
- reflexivity: system changes if observed
- Learn intrinsic system geometry from data
- Derive equations of motion with variational principles (stationary action on Lagrangian).
- Inference under data sparsity
- Detect data (in)sufficiency, adapt to model drift
- Support forward simulation and perturbation analysis
Data inference boundaries & limitations
Alignment validation
Complex phenomena
Adaptation to model obsolence
Precise validation protocols to assess process drift triggering re-calibration/training
Built-in flexibility for changing contexts and non-ergodicity
Scalable to thousands to millions of variables, intrinsic reflexivity
Component LSM predictors enforce statistical significance of splits in recursive partitioning, ensuring precise uncertainty quantification
*Hothorn, Torsten, Kurt Hornik, and Achim Zeileis. "Unbiased recursive partitioning: A conditional inference framework." Journal of Computational and Graphical statistics 15, no. 3 (2006): 651-674.
emergent macro-structure
Component predictor (Conditional Inference Tree*)
Example: Influenza A HA protein
Recursive
LSM
forest
LSM Forest of Conditional Inference Trees*
Revealing Emergent Cross-talk
Large Science Models: Mathematical Framework
| reliten | gunlaw | abany | --- | grass | |
|---|---|---|---|---|---|
| Person 1 | |||||
| Person 2 | |||||
| --- | |||||
| Person m |
observables
samples
Distributions over alphabet \(\Sigma^i\)
Individual Predictor (CIT)
cross-talk
Tension between predicted and observed distribution drives change
Example
GSS topic: There should be more gun-control
\(\psi^i\)
| strongly agree | agree | neutral | disagree | strongly disagree |
Digital Twin
\(\phi\) estimates \(\psi\)
Examples: GSS, ANES, WVS, ESS, Eurobarometer, Afrobarometer, Asian Barometer etc
group
individual
estimate is always a non-empty non-degenerate distribution
missing observation
Large Science Models: Properties
LSM-Distance Metric*
where \(D_{JS}(P\vert \vert Q)\) is the Jensen-Shannon divergence.
Large Deviation Bound*
Induced Riemannian metric tensor
This bound connects ``closeness'' of samples to the odds of perturbing from one to the other, bridging geometry to dynamics
Ergodic Projection
(Sanov's Theorem, Pinkser's Inequality)
\(\psi\)
\(\psi'\)
\(\theta\)
"spatial average": average of all plausible worldviews or states
* Sizemore, Nicholas, Kaitlyn Oliphant, Ruolin Zheng, Camilia R. Martin, Erika C. Claud, and Ishanu Chattopadhyay. "A digital twin of the infant microbiome to predict neurodevelopmental deficits." Science Advances 10, no. 15 (2024): eadj0400. https://www.science.org/doi/full/10.1126/sciadv.adj0400
persistence probability
Ergodic dispersion
Central to Model Drift Quantification
Start with opinion vector with all entries missing
This is a standard Physics construct, quantifying curvature of the underlying latent geometry
Easily computable in LSM framework!
Apply \(\phi^i\)
Random variable quantifying dispersion around the spatial average of worlviews
const. scaling as \(N^2\)
Digital Twin & Fidelity of Simulation
Sample predicted distributions
perturbed state within \(\epsilon\) of \(\psi\)
Digital Twin
-Neighborhood of state \(\psi\)
Definition
Sample neighborhood to impute missing data
}
LSM sampling: sampling the \(\epsilon\)-neighborhood of a state or worldview allows reconstruction of censored opinions
Predictive ability of LSM quantified as ability to reconstruct censored out-of-sample observations
Null state (all missing observations)
Valid perturbations/ simulations
LSM sampling allows simulating opinion perturbations
Global Emergent Structure via Clusters & Poles
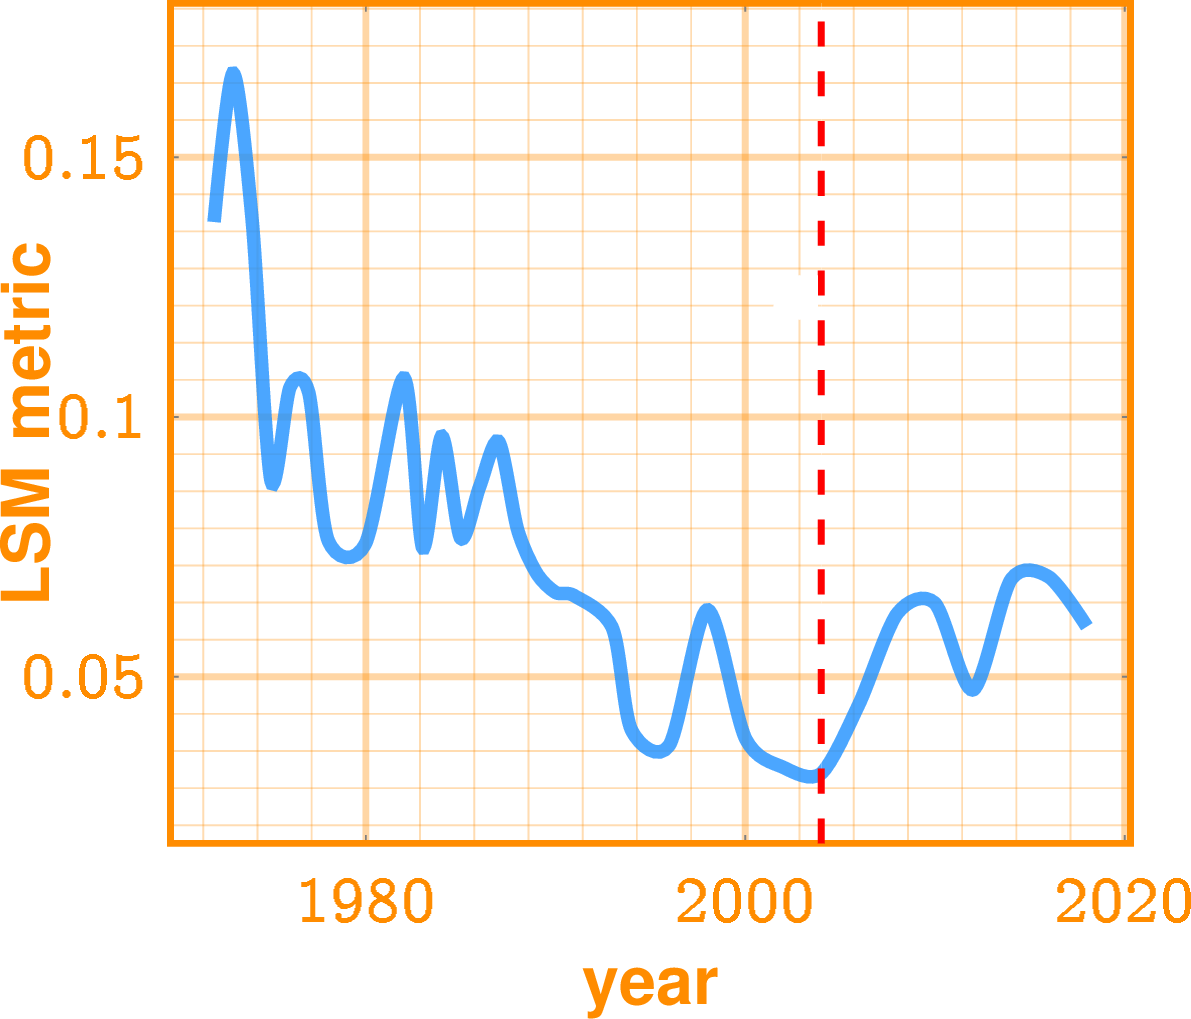
2018 GSS
Polar separation over time
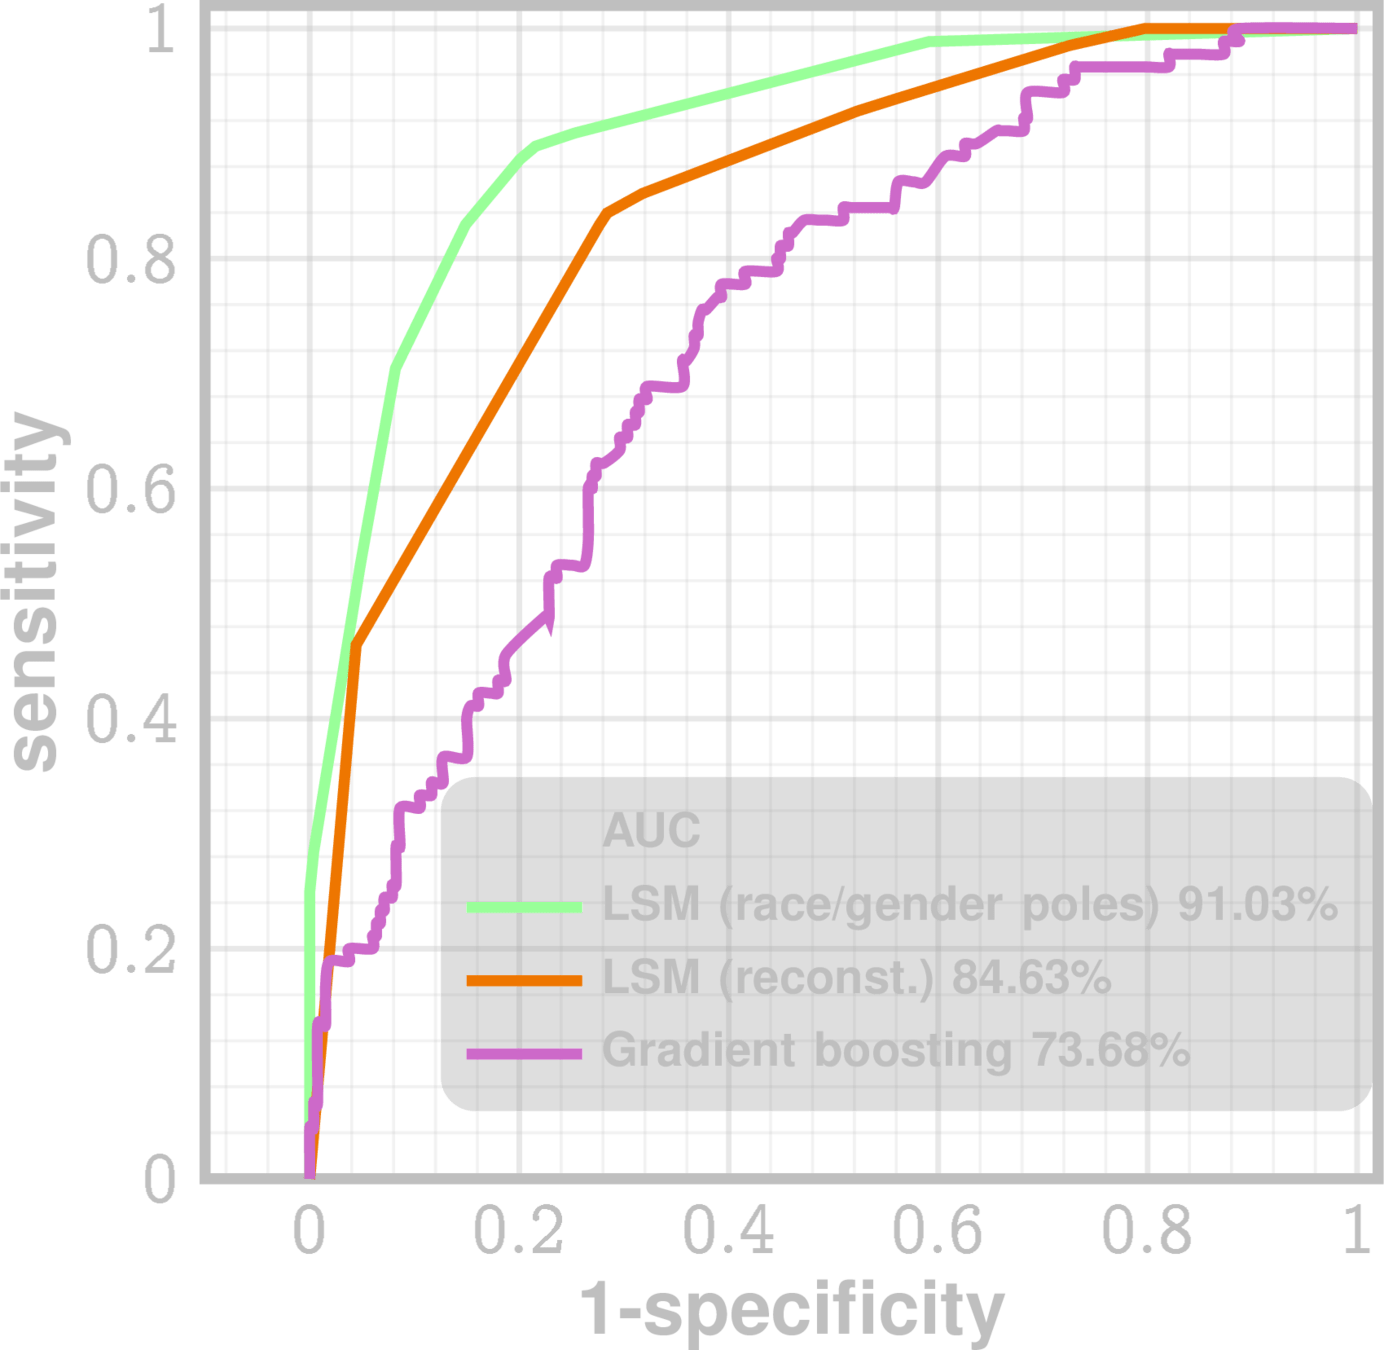
2016 Presidential Election Vote Prediction


2004
| abany | no | yes |
| abdefctw | always wrong | not wrong at all |
| abdefect | no | yes |
| abhlth | no | yes |
| abnomore | no | yes |
| abpoor | no | yes |
| abpoorw | always wrong | not wrong at all |
| abrape | no | yes |
| absingle | no | yes |
| bible | inspired word | book of fables |
| colcom | fired | not fired |
| colmil | not fired | not allowed |
| comfort | strongly agree | strongly disagree |
| conlabor | hardly any | a great deal |
| godchnge | believe now, always have | don't believe now, never have |
| grass | not legal | legal |
| gunlaw | oppose | favor |
| intmil | very interested | not at all interested |
| libcom | remove | not remove |
| libmil | not remove | remove |
| maboygrl | true | false |
| owngun | yes | no |
| pillok | agree | strongly agree |
| pilloky | strongly disagree | strongly agree |
| polabuse | no | yes |
| pray | several times a day | never |
| prayer | disapprove | approve |
| prayfreq | several times a day | never |
| religcon | strongly disagree | strongly agree |
| religint | strongly disagree | strongly agree |
| reliten | strong | no religion |
| rowngun | yes | no |
| shotgun | yes | no |
| spkcom | not allowed | allowed |
| spkmil | allowed | not allowed |
| taxrich | about right | much too low |
conservative pole
liberal pole
Clustering LSM distance \(\theta(x,y)\) between out-of-sample individuals
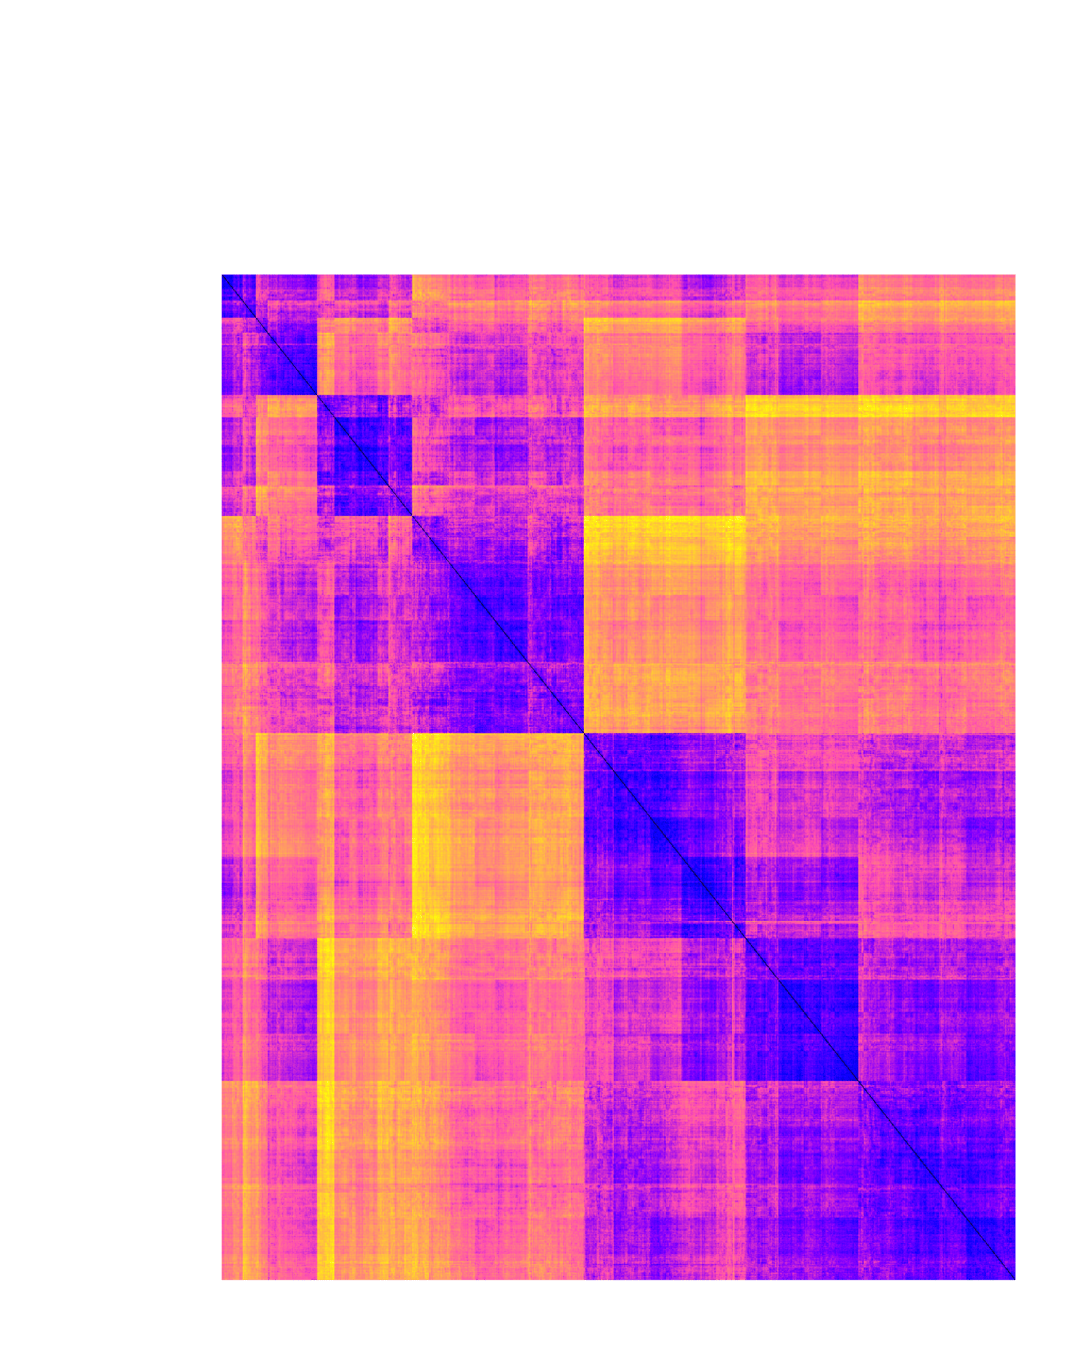
conservative
liberal
poles:
partial states aligning with extreme opposing worldviews
- Compare across time and different GSS surveys
- Derived features for individuals (ideology index)
Predict 2016 votes using ideology index
Emergent global structure
Reflexivity and State Collapse on Observation
Emergent Equations of Motion
Define Lagrangian*
Via the Euler-Lagrange Equations\(^\dag\):
Over-damped Gradient flow Equation*
where \(-g^{km}\) is the inverse metric tensor
kinetic energy
state collapse
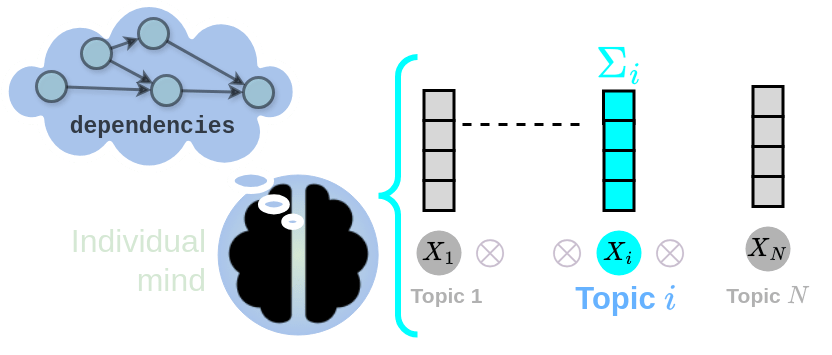
strongly agree
agree
neutral
disagree
strongly disagree
strongly agree
agree
neutral
disagree
strongly disagree
Query/
Observation
\(X_i\)
Non-local Influence propagation on measurement/observation (QM-like)

potential energy
* Einstein notation used
Goldstein, Herbert, et al. Classical Mechanics. 3rd ed., Pearson, 2002.
\(^\dag\)
Principle of stationary action
Dynamics
Local potential field eqn
Local Potential Fields
Stable
(captured by local extrema)
Free to move locally towards extrema
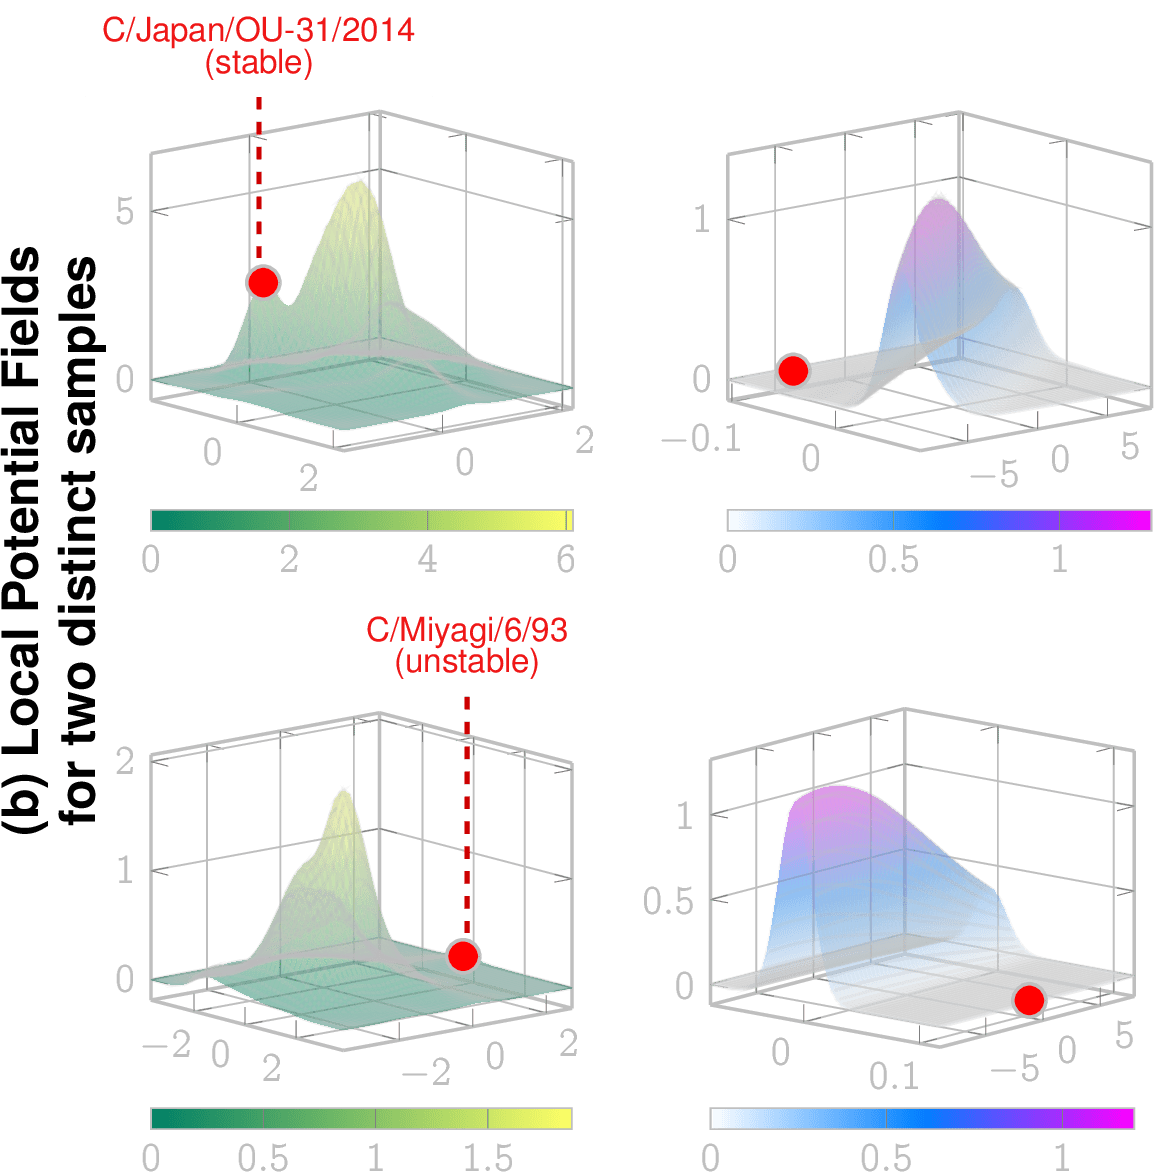
GSS 2018 individuals and neighborhoods
Influenza C : strains and their neighborhoods
Observation: This lineage (Mississippi lineage) is now extinct since 2022/23
stable lineage
Local potential fields can be computed given the LSM and dynamical considerations, which reveal future evolution
Data Sufficiency via Conservation of Complexity
The No-cheating Thorem: Generative models cannot cheat on complexity
Kolmogorov Complexity
Optimal Generative Model
compressed data representation
compressed model representation
Theorem
Conservation Law arising from the continuous symmetry of typicality*
Saturation relation:
Data Sufficiency Statistic \(\mu_0\)
We need LSM-sampling to calculate this
*Noether's Theorem
For every continuous symmetry of a physical system, there exists a corresponding conserved quantity
How much more data do we need?
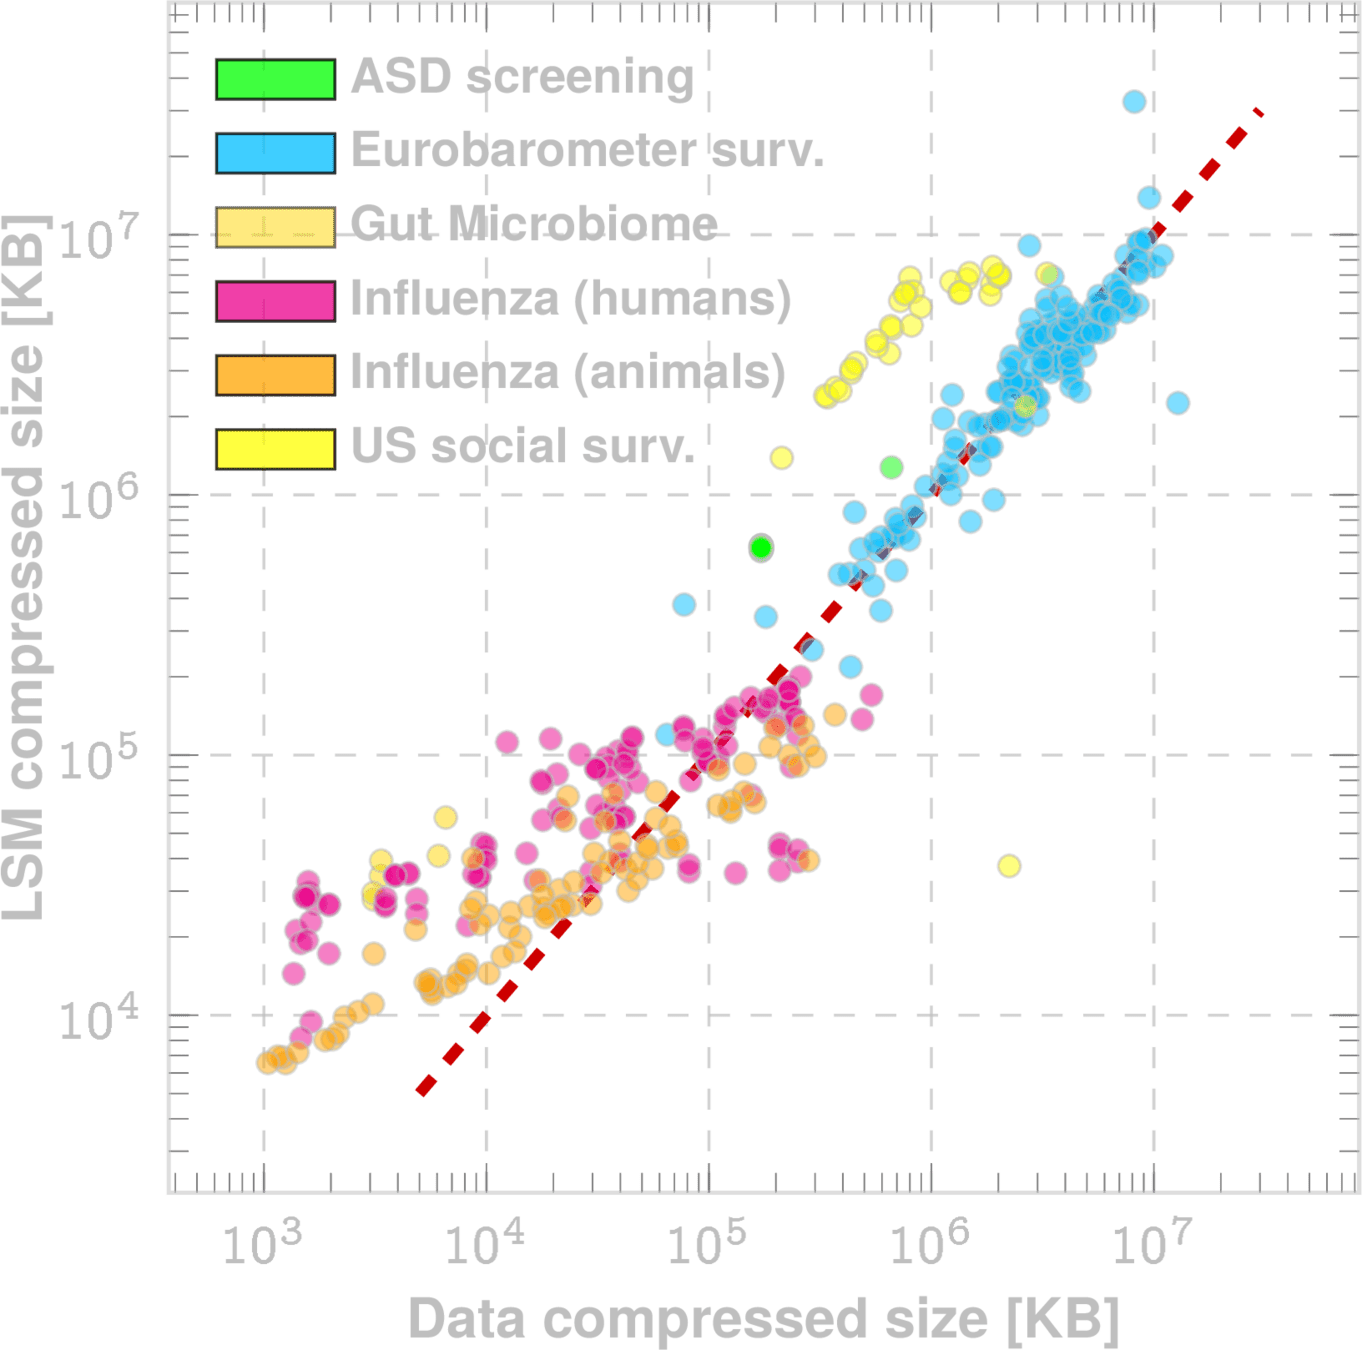
Data saturation
Data deficient
Needed
Current
Empirical Validation
Model Drift Quantification
Ergodic dispersion
Z-value of dispersion
Do new samples (survey respondents) still conform to the model?
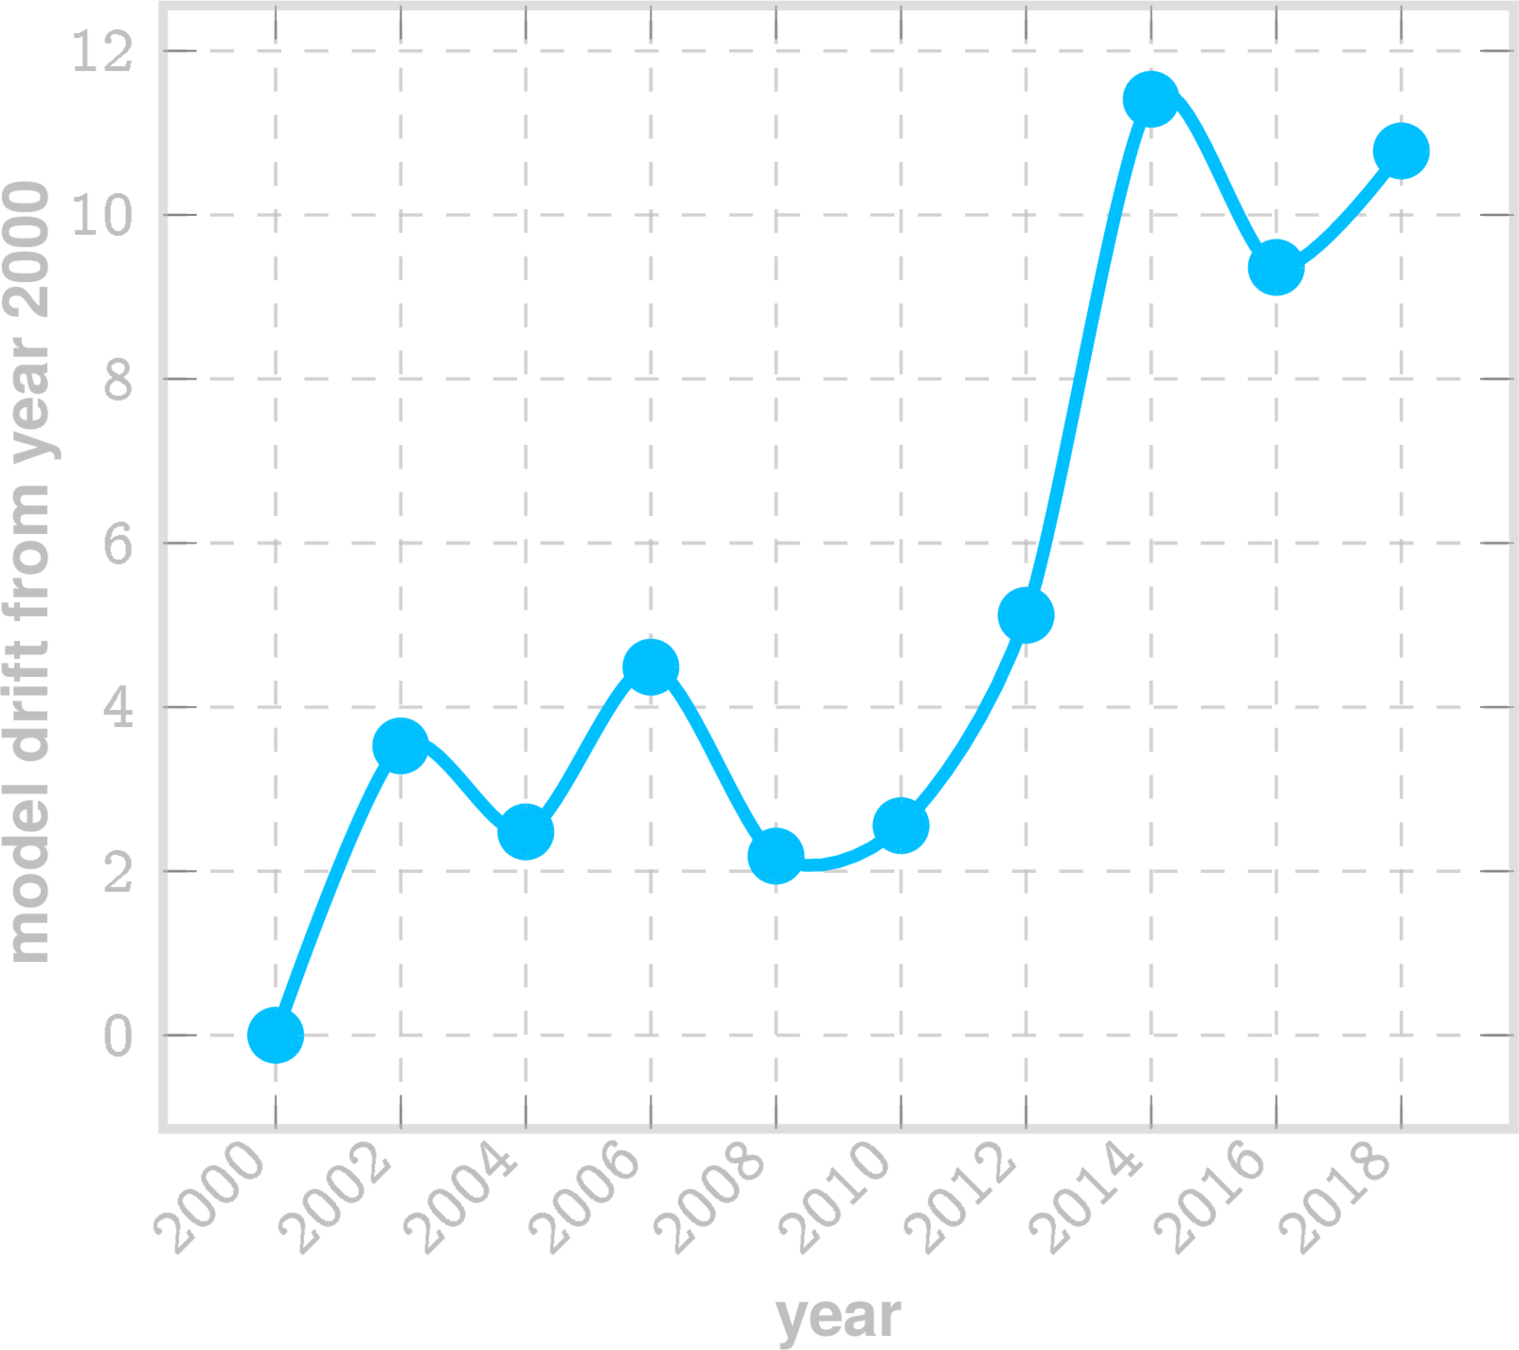
GSS Model drift
ergodic projection (all missing values)
A random belief state (with possibly missing entries)
random variable
normal variate
Model drift stochastic process (\(\zeta\))
assess if \(\zeta\) is stationary: if not then new samples are not conforming to model
Example for GSS LSM inferred for year 2000
Large Science Models & Ergodicity
\(\checkmark\) 4. Address whether your approach makes assumptions regarding ergodicity, and if so, how these assumptions affect the model's applicability to non-ergodic systems.
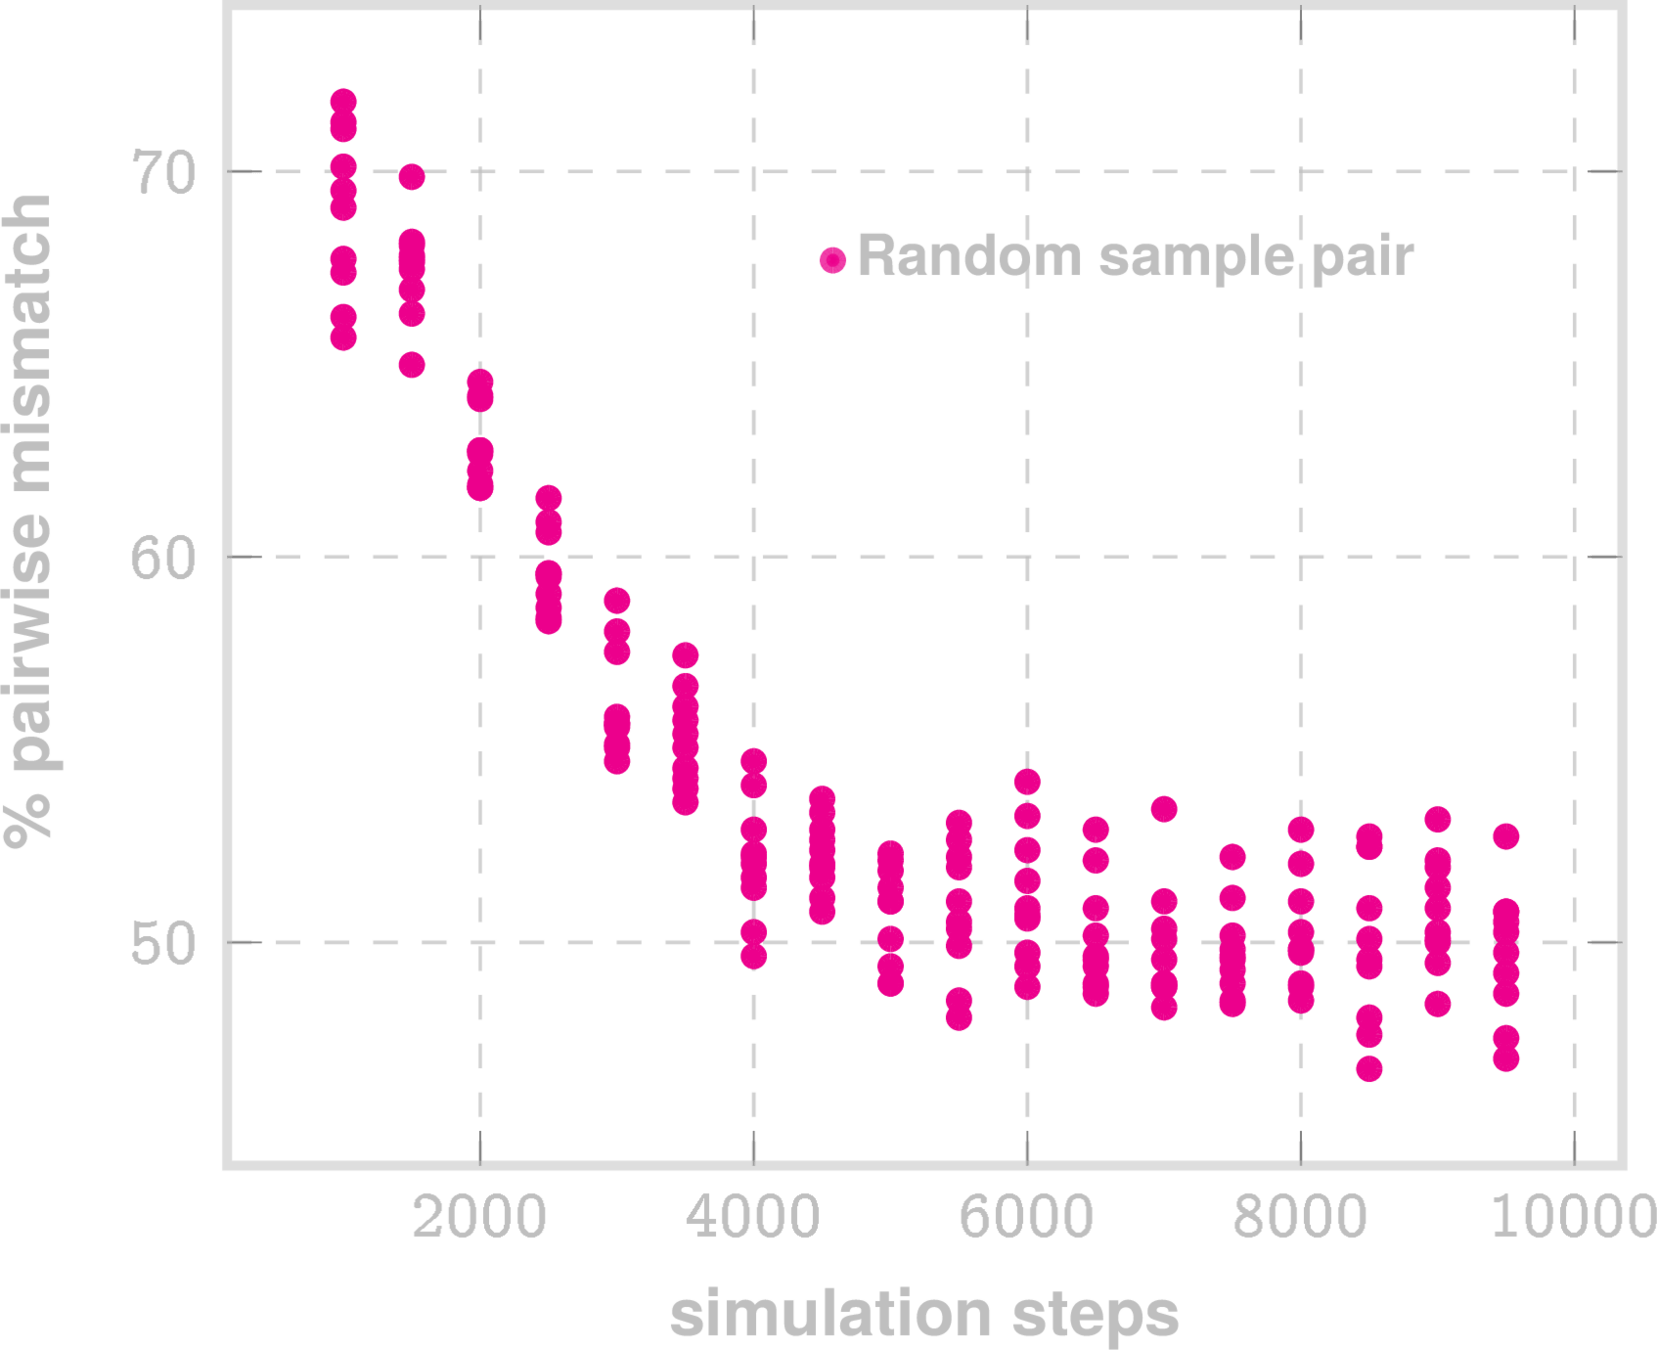
No Convergence
(~50% belief mismatch between pairs)
2018 GSS survey belief vectors simulated via LSM sampling
- No ergodicity assumption: LSMs are built for non-ergodic systems
- Sampling and simuation "remembers" the start point (No convergence), demonstrating non-ergodic learned structure
- Local potential fields vary across the space
- Potential wells may arise, driven by the dynamics at hand, not via assumptions
- "change" is driven by non-equilibrium (dissonance)
Embedded Social Theories in LSM
When applied to Social Modeling and Opinion Dynamics
-
Belief about topic iii is expected to align with beliefs about other topics \(\displaystyle\psi^{-i}\).
Deviations are exponentially improbable \(\Rightarrow \) people/groups seek internal coherence. -
Theory Link:
-
Cognitive consistency theory – Abelson et al. (1968)
-
Constraint satisfaction in beliefs – Read & Marcus-Newhall (1993)
-
-
Beliefs evolve to minimize tension between actual state and “expected” state.
Reflexive gradient flow — system reduces internal contradiction. -
Theory Link:
-
Cognitive Dissonance Theory – Festinger (1957)
-
Homeostatic belief adjustment – Gawronski & Strack (2004)
-
-
Observing a belief changes it and affects all conditionals.
Direct encoding of feedback loops central to human systems. -
Theory Link:
-
Reflexivity in social systems – Giddens (1984), Soros (1994)
-
Theory of mind / mutual modeling – Premack & Woodruff (1978)
-
Validation of Social Theory Questions:
- Perception changes reality, which changes perception
- The Constitution of Society
- The Alchemy of Finance
- Does a chimpanzee have a theory of mind?
- Our system “wants” to reach a low-energy (low-dissonance) state — a direct computational analog of Festinger’s theory.
- People strive to align beliefs and attitudes across related domains. Inconsistencies create cognitive discomfort, prompting adjustments across belief clusters to restore harmony.
| Exploratory: Belief systems react measurably to exogenous events and shocks |
Exploratory: Cross-dependencies between beliefs have observable effects on societal resilience.
Is Polarization an Inevitable Attractor?
Social Identity Theory vs. Belief Proximity
Large Science Models: Broader Applications
A General Framework for modeling Complex Systems
Genomic database: Missing heritability problem
Personalized Clinical Digital Twin, Virtual Patients
Any structured interview, PTSD fabrication
Assess sysmptom data and co-pathologies
Predict future mutations; which animal strain is closest to jumping to humans
Mental health diagnosis
Microbiome Analysis**
Algorithmic lie detector
Viral emergence
Teomims
Opinion Dynamics
Darkome
Generative model of complex microbial ecosystems, and their impact on health and disease
Data requirements
- Tabular data
- Potentially large number of features/covariates (\(10^2 - 10^8 \))
- Sufficient number of samples (\(10^3 - 10^6\))
- Small number of longitudinal samples (currently, \( < 100\))
| Limitation | Mitigation / Response |
|---|---|
| Conventional time series is currently out-of-scope | Focus on cross-sectional interdependencies and belief geometry; time handled via drift |
| LSMs model statistical interdependence, not causal mechanisms | Use perturbation-based simulations to infer plausible influence pathways |
| Limited by observed belief variables | Integrate multiple surveys; use latent proxies and test sensitivity of digital twins |
| Social theory connections and interpretability may be challenging | Anchor dynamics with theory-driven constructs (e.g., ToM, cognitive dissonance) |
LSMs for complex systems
**preliminary study published (https://www.science.org/doi/10.1126/sciadv.adj0400)
[
    {
        "patient_id": "P000038",
        "sex": "F",
        "birth_date": "01-01-2006",
        "DX_record": [
            {"date": "07-31-2006", "code": "Z38.00"},
            {"date": "08-07-2006", "code": "P59.9"},
            {"date": "08-29-2016", "code": "J01.90"},
            {"date": "09-10-2016", "code": "J01.90"},
            {"date": "11-14-2016", "code": "J01.91"}
        ],
        "RX_record": [
            {"date": "10-29-2011", "code": "rxLDA017"},
            {"date": "05-16-2015", "code": "rxIDG004"},
            {"date": "08-08-2015", "code": "rxIDG004"},
            {"date": "06-04-2016", "code": "rxIDD013"}
        ],
        "PROC_record": [
            {"date": "02-05-2007", "code": "90723"},
            {"date": "11-05-2007", "code": "J1100"}
        ]
    }
]
{
"predictions": [
{
"error_code": "",
"patient_id": "P000012",
"predicted_risk": 0.005794344620009157,
"probability": 0.8253881317184486
}
],
"target": "TARGET"
}Data Out
Data In
Current state: Fully functional API *
- user-specific API
- Custom models targeting range of disorders
- Scalable
*Documentation: https://github.com/zeroknowledgediscovery/paraknowledgedoc
Model ready to deploy behind UK firewall
>5 Million in US. >13 Million in next 10 years
Alzheimer's Disease and Related Dimentia
MOCA, Blood Tests
Current Practice:
state of art with EHR:
~67% AUC*
ZCoR: ~87%
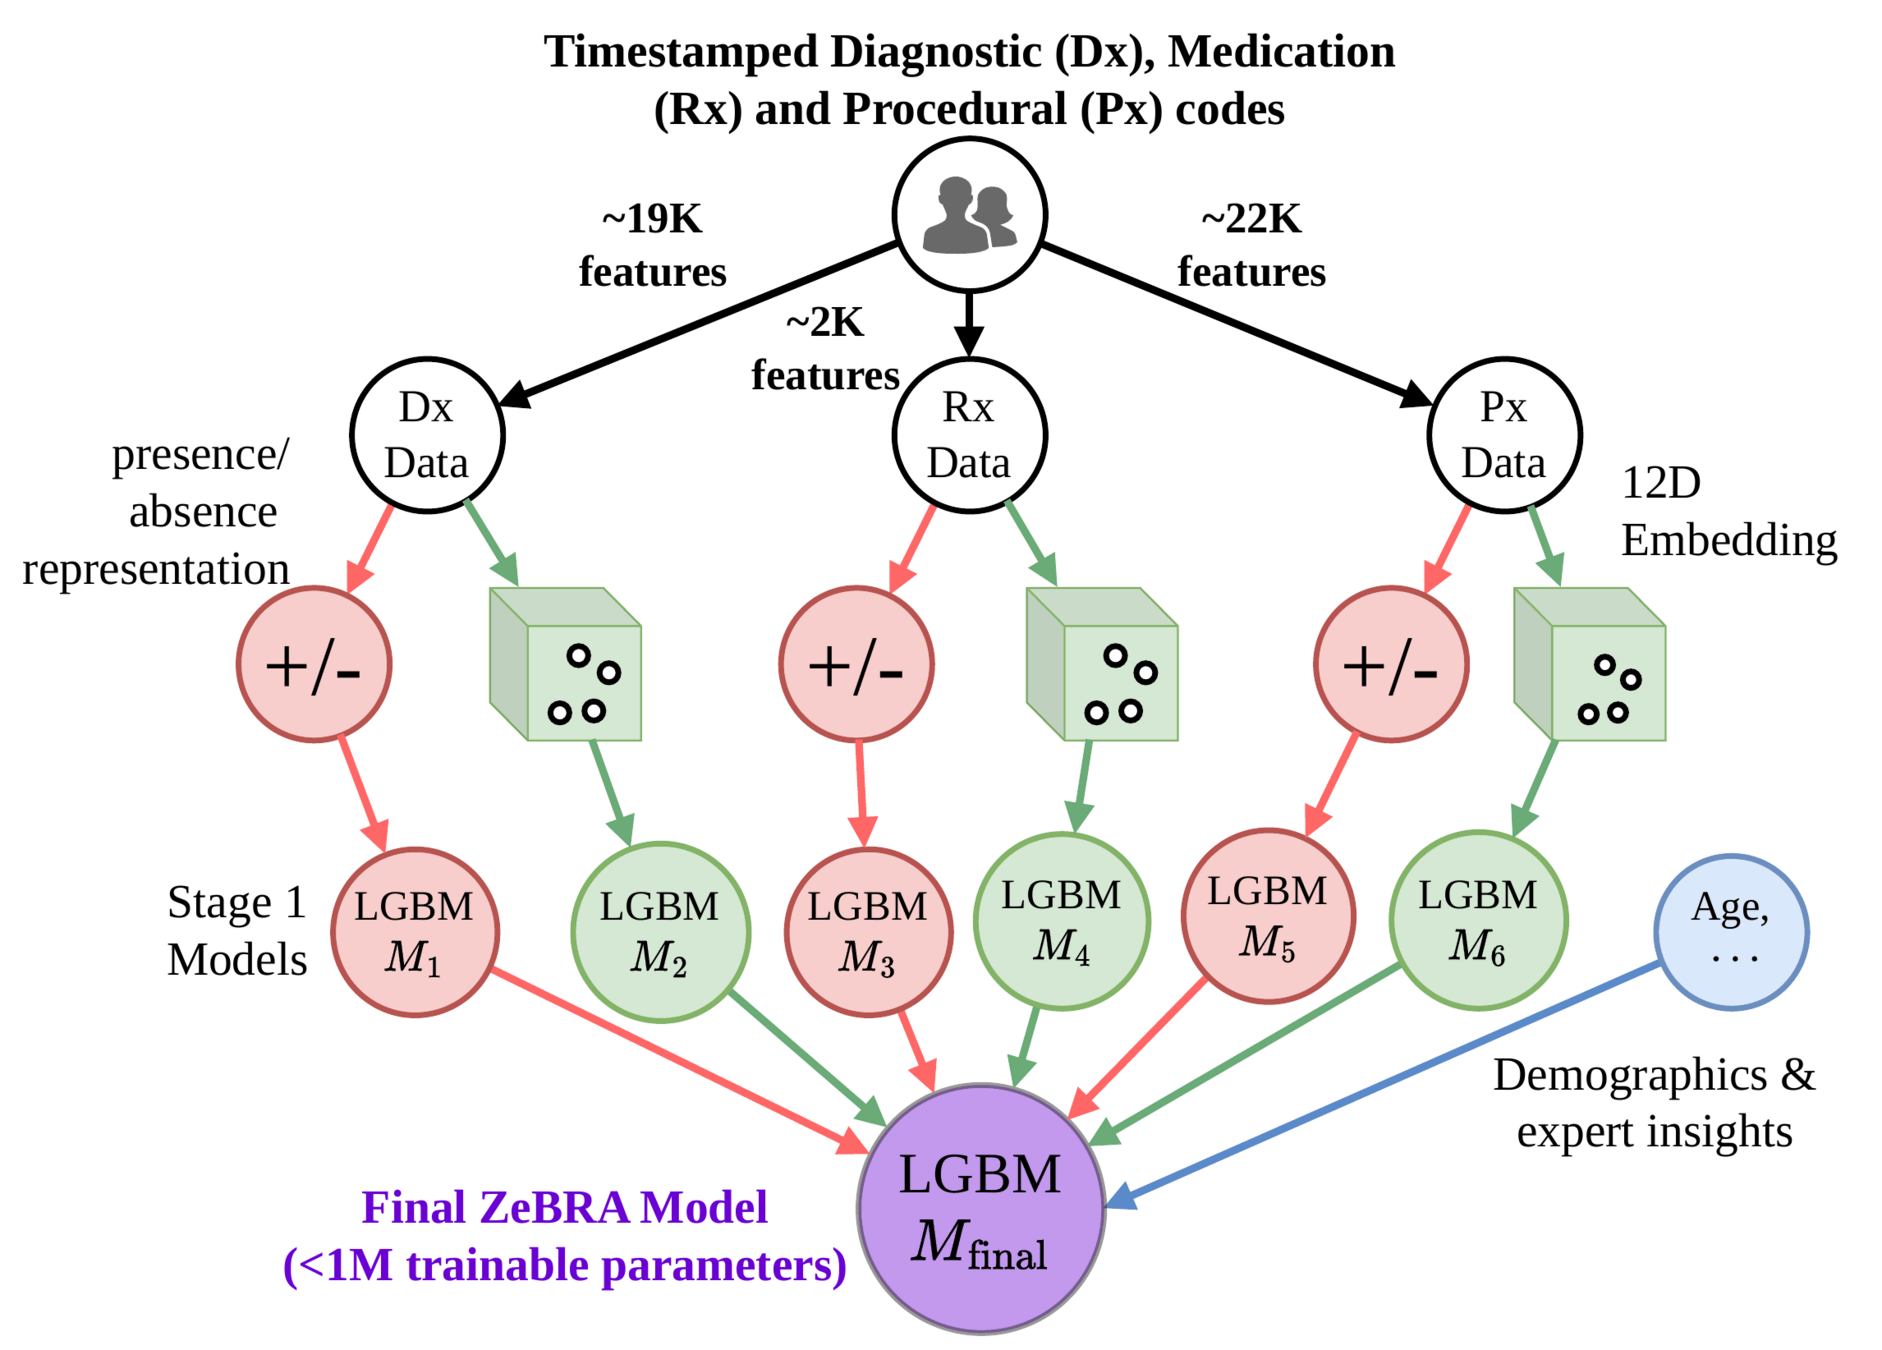
HrEF
ILD
TimestampedDiagnostic procedural codes & prescriptions
ICD
Rx
Dx
Px
Primary care