Industry Analysis and Competitive Benchmarking

You are working as a junior equity research analyst. Your manager wants you to evaluate ITC Ltd. and understand how it performs compared with companies in its peer group. Instead of analysing ITC in isolation, you need to compare its profitability, capital efficiency, valuation, dividend returns, sales growth, and debt.
The ultimate question you must answer is: Is ITC performing better than its peers, and does its market valuation accurately reflect its financial performance?
Business Scenario


Pre-Lab Preparation
Topic : Fundamental & Ratio Analysis
-
Company analysis
-
Industry analysis
-
Macroeconomic analysis
-
Revenue and cost drivers
-
Liquidity ratios, Profitability ratios, Leverage ratios, Efficiency ratios
Task 1: Compare Companies
1
Open Screener.in
a
Open your web browser and navigate to
b
Log in with your free account or continue as a guest

2
Search for ITC Ltd
a
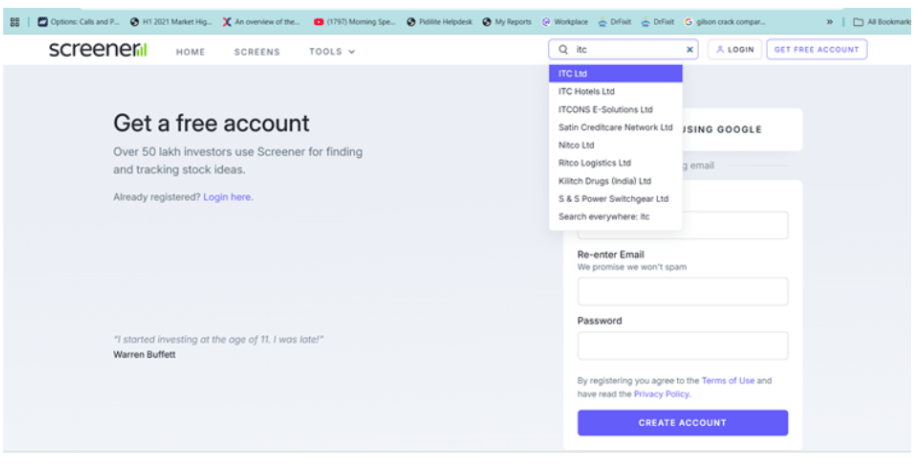
In the top search bar, type ITC
b
Select ITC Ltd. from the dropdown menu to open its consolidated company dashboard.
3
Review Baseline Financial Metrics
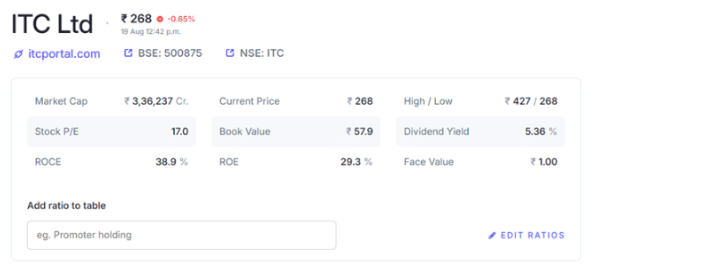
Before comparing against competitors, record the target company’s core parameters from the top metric card:
| Key Ratio / Metric | Value (from Dashboard) | Financial Significance |
|---|---|---|
| Market Capitalization | ₹3,36,237 Cr. | Reflects the overall market valuation and large-cap stability. |
| Stock P/E Ratio | 17.0x | Represents the price investors are paying for ₹1 of earnings. |
| ROCE | 38.9% | Return on Capital Employed; indicates high capital efficiency. |
| ROE | 29.3% | Return on Equity; shows profitability generated on shareholders' funds. |
| Dividend Yield | 5.36% | Demonstrates consistent cash return to shareholders. |
| Book Value | ₹57.9 | Net asset value per share. |
Note Understand the Important Concepts:
1. Market Capitalization
Market Capitalization = Share Price × Number of Shares
It tells us the total market value of a company.
For example, if a company has a market capitalization of ₹3 lakh crore, investors collectively value the company at approximately ₹3 lakh crore.
Simple meaning:
"How big is the company in the stock market?"
A higher market capitalization generally indicates a larger company.
2. P/E Ratio — Price to Earnings
P/E tells us how much investors are willing to pay for ₹1 of the company's earnings.
For example:
-
P/E = 10 → Investors pay ₹10 for ₹1 of earnings.
-
P/E = 40 → Investors pay ₹40 for ₹1 of earnings.
A high P/E can mean investors expect strong future growth. However, it can also mean that the stock is expensive.
A low P/E may indicate a cheaper valuation, but it does not automatically mean the stock is better.
Simple meaning:
"How expensive is the stock compared with its earnings?"
3. ROCE — Return on Capital Employed
ROCE measures how efficiently a company uses the capital invested in the business to generate operating profits.
For example:
-
ITC ROCE = 38.91%
-
HUL ROCE = 28.42%
This means ITC is generating a higher return on the capital employed in its business than HUL, based on the figures in this exercise.
Simple meaning:
"How efficiently is the company using the money invested in its business?"
Higher ROCE is generally better, especially when comparing similar companies.
4. OPM — Operating Profit Margin
OPM tells us how much operating profit a company generates from its sales.
Simple meaning:
"How profitable is the company's core business?"
Higher OPM generally indicates stronger operating profitability and pricing power.
5. Dividend Yield
Dividend Yield tells us how much dividend income an investor receives relative to the share price.
For example:
If a share is priced at ₹100 and the company pays ₹5 as annual dividend:
Dividend Yield = 5%
Simple meaning:
"How much cash return does the company provide to shareholders through dividends?"
A higher dividend yield can be attractive to income-focused investors.
6. Net Profit — Latest Quarter
This shows the company's profit after expenses, interest and taxes for the latest reported quarter.
Simple meaning:
"How much profit did the company actually make in the latest quarter?"
When comparing companies, remember that companies can be very different in size. Therefore, don't compare only the absolute profit; also consider margins, market capitalization and other ratios.
7. Sales Growth — 3 Years
This tells us how much the company's sales have grown over a three-year period.
For example:
-
Positive sales growth → Business is expanding.
-
Very low growth → Business may be growing slowly.
-
Negative growth → Sales have declined.
8. Debt
Debt shows how much borrowing the company has.
A company with high debt may have higher financial risk, particularly if its profits or cash flows are weak.
However, debt should not be judged in isolation. Some businesses can comfortably manage higher debt because they generate strong and stable cash flows.
Simple meaning:
"How much has the company borrowed?"
Task 2 : Analyze Market Share
1
Scroll to the Peer Comparison Section
a
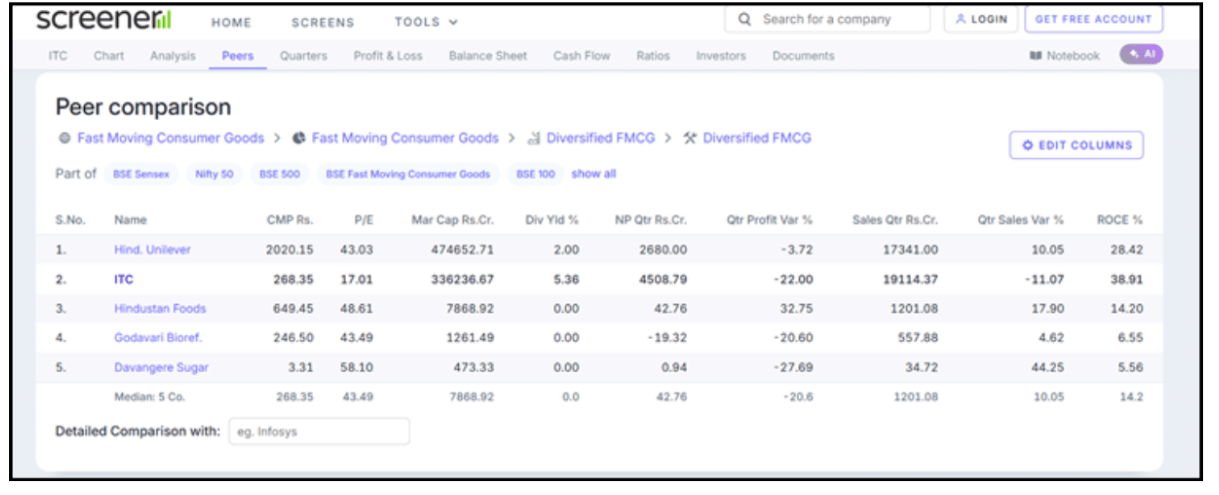
Scroll down the ITC dashboard to the Peer comparison section.
b
Observe the default peer group (Hindustan Unilever, ITC, Hindustan Foods, Godavari Biorefineries, Davangere Sugar).
2
Customize Financial Columns
a
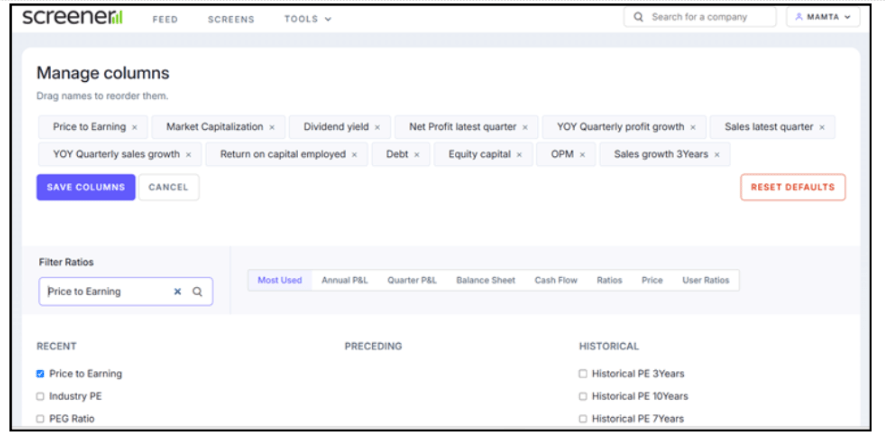
Click the EDIT COLUMNS button located at the top-right of the peer table
b
Add the following critical operating and valuation metrics to your view:
-
Price to Earning (P/E)
-
Market Capitalization (Mar Cap Rs.Cr.)
-
Dividend Yield (Div Yld %)
-
Net Profit latest quarter (NP Qtr Rs.Cr.)
-
Return on Capital Employed (ROCE %)
-
Operating Profit Margin (OPM %)
-
Sales Growth 3 Years (Sales Var 3Yrs %)
-
Total Debt (Debt Rs.Cr.)
c
Click SAVE COLUMNS to refresh the comparative table
3
Peer Benchmarking Table
Examine the refreshed peer table and record the data for benchmarking:
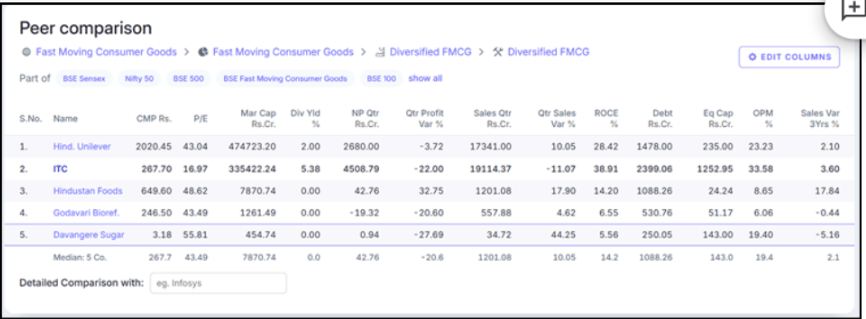
| Company Name | CMP (₹) | P/E | Market Cap (₹ Cr.) | Div Yield (%) | NP Qtr (₹ Cr.) | ROCE (%) | OPM (%) | Sales Growth 3Y (%) | Debt (₹ Cr.) |
|---|---|---|---|---|---|---|---|---|---|
| Hindustan Unilever (HUL) | 2,020.45 | 43.04 | 4,74,723.20 | 2.00% | 2,680.00 | 28.42% | 23.23% | 2.10% | 1,478.00 |
| ITC Ltd. | 267.70 | 16.97 | 3,35,422.24 | 5.38% | 4,508.79 | 38.91% | 33.58% | 3.60% | 2,399.06 |
| Hindustan Foods | 649.60 | 48.62 | 7,870.74 | 0.00% | 42.76 | 14.20% | 8.65% | 17.84% | 1,088.26 |
| Godavari Bioref. | 246.50 | 43.49 | 1,261.49 | 0.00% | -19.32 | 6.55% | 6.06% | -0.44% | 530.76 |
| Davangere Sugar | 3.18 | 55.81 | 454.74 | 0.00% | 0.94 | 5.56% | 19.40% | -5.16% | 250.05 |
| Industry Median | 267.70 | 43.49 | 7,870.74 | 0.00% | 42.76 | 14.20% | 19.40% | 2.10% | 1,088.26 |
Duopoly Market Structure:
The combined market cap of HUL (~₹4.75 Lakh Cr.) and ITC (~₹3.35 Lakh Cr.) accounts for over 98% of the entire peer group's total value.
Smaller entities like Hindustan Foods (₹7,870 Cr.) and Godavari Biorefineries (₹1,261 Cr.) are contract manufacturers or niche commodity processors with drastically smaller market presence.
-
OPM – 33.58%: Highest among the major peers → strong operating profitability and pricing power.
-
ROCE – 38.91%: Higher than HUL (28.42%) and industry median (14.20%) → efficient use of capital.
-
P/E – 16.97x: Much lower than HUL (43.04x) → ITC is valued more cheaply relative to its earnings.
-
Dividend Yield – 5.38%: Higher than HUL (2%) → attractive dividend income for shareholders.
-
Sales Growth – 3.60%: Better than HUL (2.10%) but much lower than Hindustan Foods (17.84%) → ITC is growing, but is not the fastest-growing peer.
-
Net Profit – ₹4,508.79 Cr.: Highest among the selected companies → strong absolute profitability.
-
Debt – ₹2,399 Cr.: Higher than HUL, but debt should be evaluated relative to the company's size and cash flows.
-
Overall: ITC combines high profitability + strong ROCE + high dividend yield + relatively low P/E.
-
Key insight: ITC's lower P/E despite strong profitability suggests the market may be applying a valuation discount, partly because ITC has a diversified business structure.
-
Important: Low P/E does not automatically mean undervalued; growth expectations, risk and business mix also matter.
Task 3 : Identify Trends (Valuation & Growth Dynamics)
Review and benchmark the peer metrics across key operational areas:
-
Profitability & Pricing Power: Compare the Operating Profit Margin (OPM %) across peers. ITC leads at 33.58% versus HUL's 23.23% and the industry median of 19.40%.
-
Capital Efficiency: Compare Return on Capital Employed (ROCE %). ITC delivers 38.91% compared to HUL's 28.42% and the median of 14.20%.
-
Valuation Multiple: Compare the P/E ratios. ITC trades at 16.97x, while HUL trades at 43.04x and the industry median stands at 43.49x.
-
Shareholder Returns: Evaluate Dividend Yield. ITC offers 5.38% versus HUL's 2.00% and 0% for smaller peers.
Peer Benchmark Verdict
- The Relative Valuation Gap (Conglomerate Discount):
Although ITC generates superior operating margins (33.58%) and higher capital efficiency (38.91% ROCE) than HUL, it trades at a significant valuation discount (~17.0x P/E vs. HUL's ~43.0x P/E). This divergence primarily reflects the market's conglomerate discount on ITC's capital-intensive non-FMCG segments relative to pure-play consumer goods businesses.
-
Core Comparison Takeaway:
-
HUL: Positioned as a pure-play FMCG brand powerhouse commanding premium market multiples.
-
ITC: High-cash-flow market leader offering strong margin protection, defensive valuation support, and a high dividend yield (5.38%).
-
Note Understanding the "Conglomerate Discount":
ITC operates across multiple businesses rather than being a pure-play FMCG company.
The market may therefore value ITC differently from a company such as HUL, which is more closely associated with the FMCG business.
This difference in valuation is often discussed as a conglomerate discount.
Simple example
Imagine two restaurants:
Restaurant A specializes only in pizza.
Restaurant B sells pizza, Chinese food, coffee, desserts and packaged food
Even if Restaurant B is profitable, customers may value Restaurant A differently because its business is simpler and easier to understand.
A similar idea can apply to diversified companies in the stock market.
Important: A lower P/E does not automatically mean the market is making a mistake. The lower valuation may reflect differences in growth expectations, business mix, risk and future prospects.
Great job!
ITC shows strong operating profitability and capital efficiency compared with the selected peer group. Its OPM of 33.58% and ROCE of 38.91% are higher than HUL and the industry median. At the same time, ITC trades at a much lower P/E of approximately 17x, compared with HUL's approximately 43x, and provides a higher dividend yield of approximately 5.38%.
However, a lower P/E should not automatically be interpreted as "cheap" or "undervalued." Analysts must consider the company's business mix, growth expectations, risk and future earnings.
Checkpoint