Exploratory Data Visualization for Location Insights for Airbnb

Business Scenario
Welcome Back!
Today is your next working day as a Junior Data Visualization Analyst at the hospitality analytics company.
The analytics leadership team now wants deeper operational insights from the Airbnb business data prepared during the previous lab. Management is particularly interested in understanding pricing behavior, regional demand patterns, listing availability, and property distribution across locations.

Your responsibility today is to build professional exploratory visualizations and analytical insights that will support strategic business reporting and future dashboard development.
Pre-Lab Preparation
Topic : Exploratory Data Visualization & Advanced Analytical Techniques
1) Creating Visualizations in Tableau: Basic Visualization Types
2) Custom Visualization Types-I
3) Custom Visualization Types-III
4) Building KPIs
5) Forecasting and Trend Analysis
6) Statistical Spellcasting
git pull origin branchName
Git Pull
Task 1: Investigate Regional Pricing Performance
The revenue analytics team wants to compare Airbnb pricing performance across operational neighbourhoods to identify high-value business regions.
In this task, you will create comparative operational pricing insights using the existing cleaned workbook fields.
Click to download previous Lab file : Tableau Lab2.twd
Open the Tableau workbook from the previous lab.
1
Verify the following business fields inside the Data Pane:
- Updated_neighbourhood
- Price
- Room Type
- Updated Property Type
- Number Of Reviews
Create Regional Pricing Analysis
2
Build the Business View
a
Navigate to Sheet 1.
Drag:
- Updated_neighbourhood into Rows
- Price into Columns
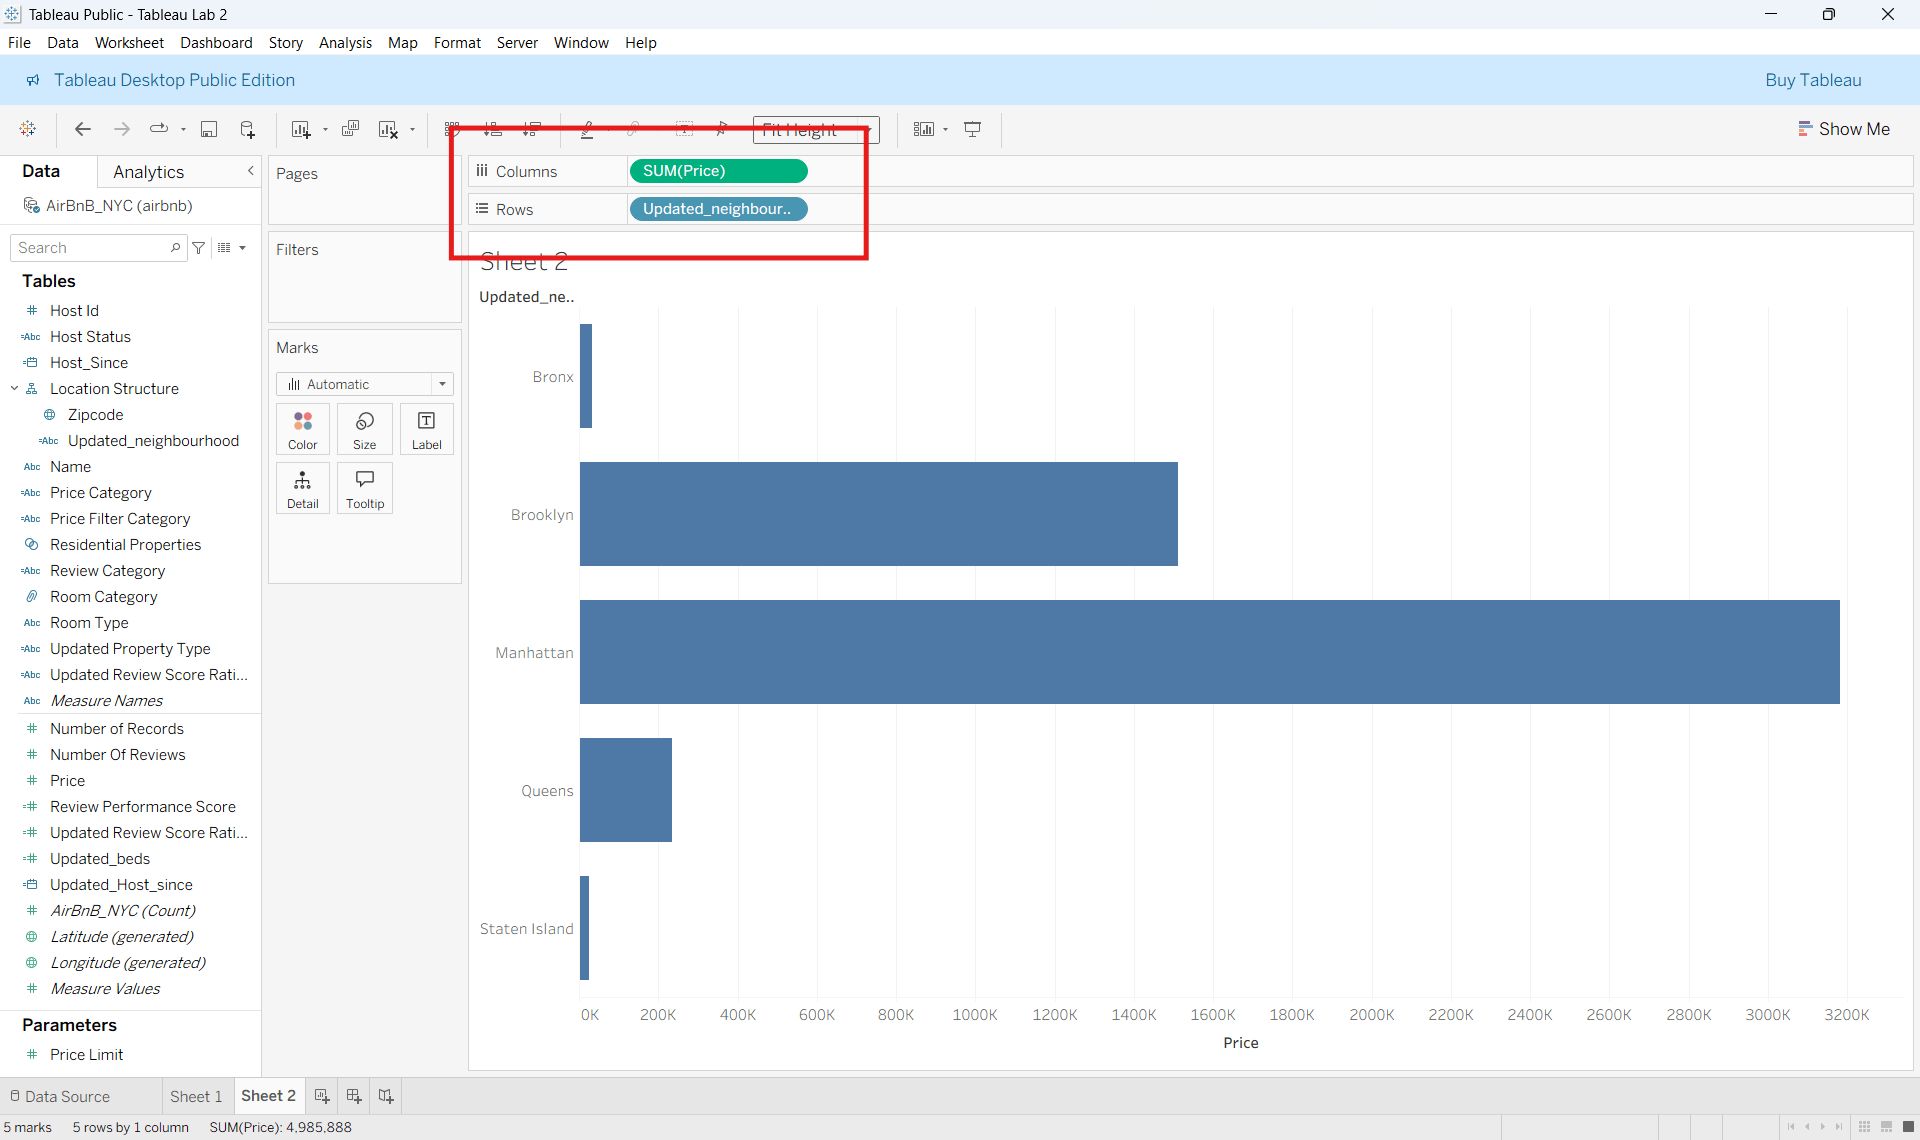
Observe the generated operational comparison chart.
Apply Business Segmentation
b
Drag Room Type into Filters.
Select categories such as:
- Entire home/apt
- Private room
- Shared room
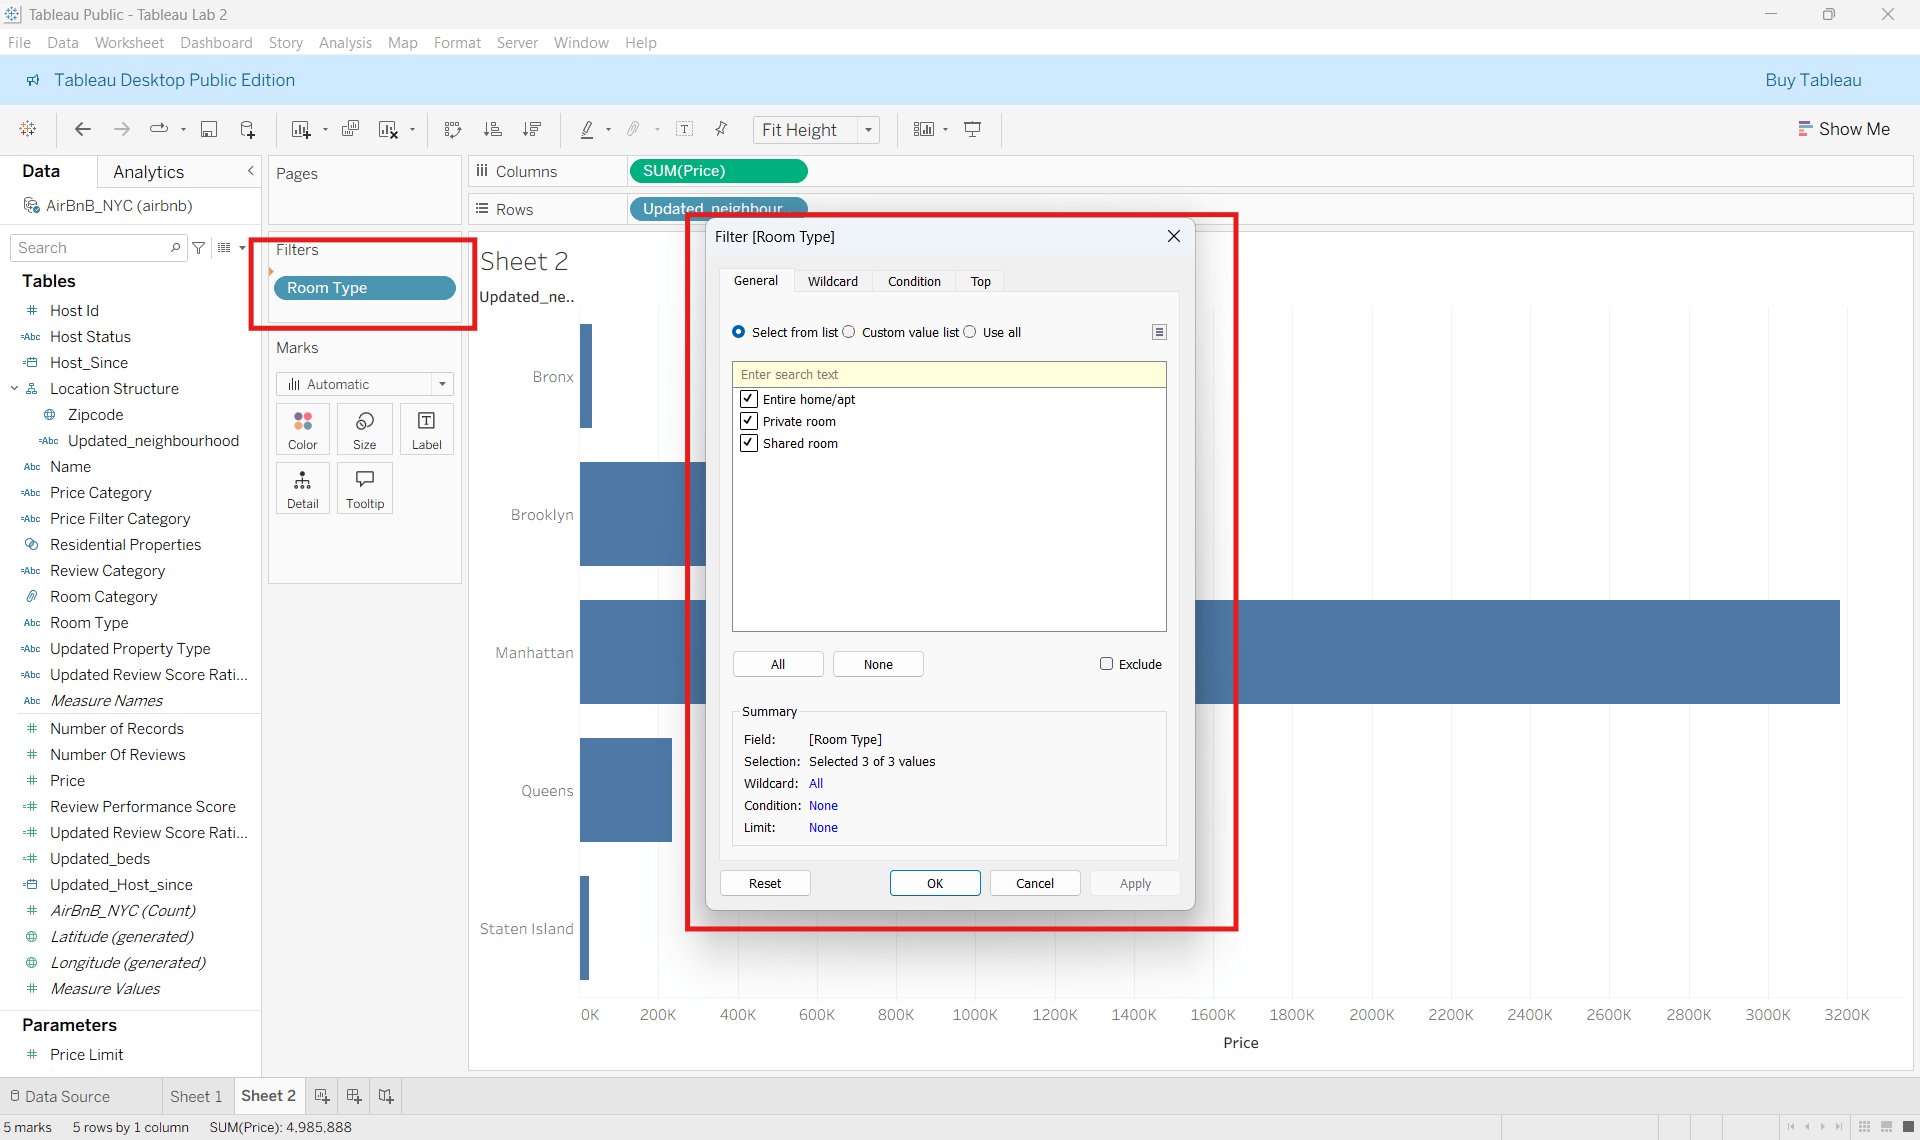
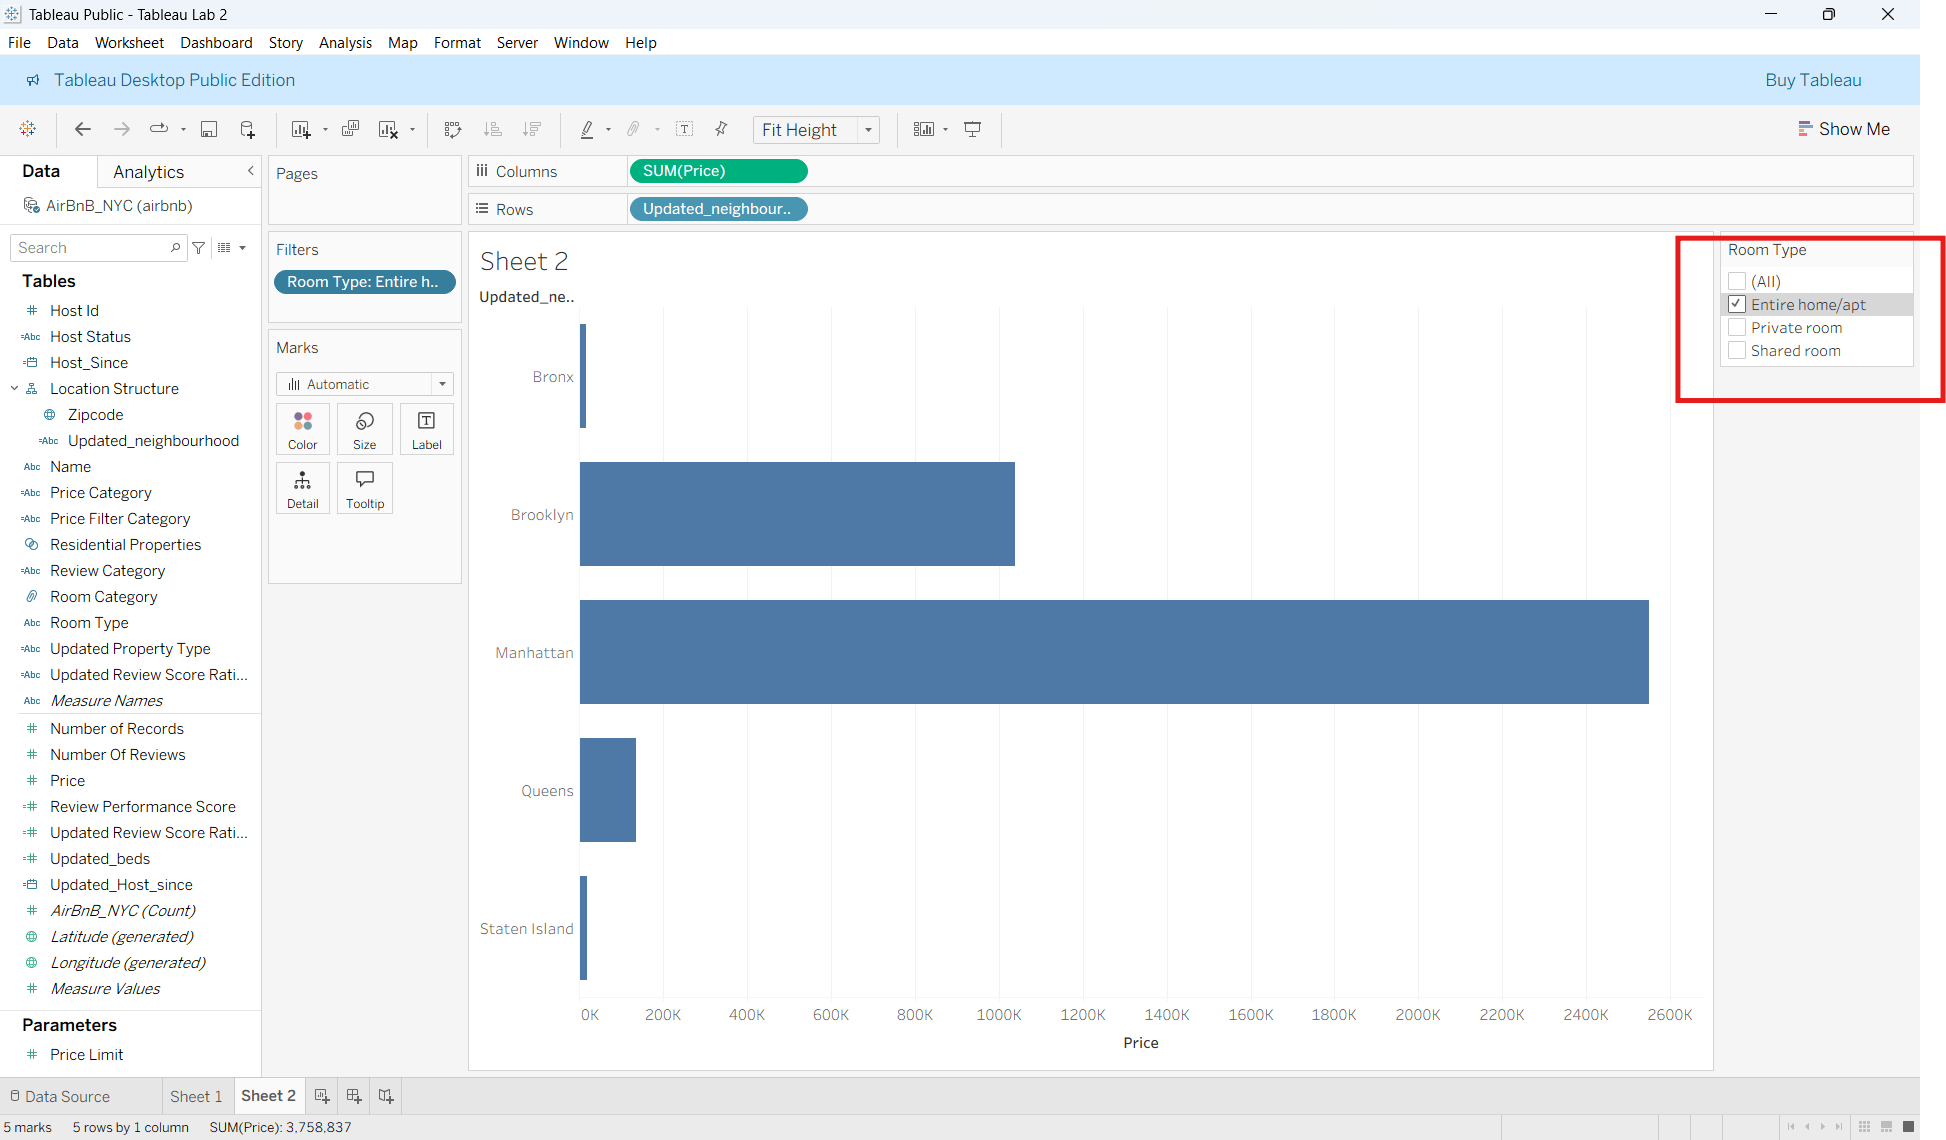
Observe how pricing distribution changes dynamically across neighbourhoods.
Organize Operational Rankings
c
Apply sorting to identify:
- Highest pricing neighbourhoods
- Lowest pricing neighbourhoods
- Premium operational business regions
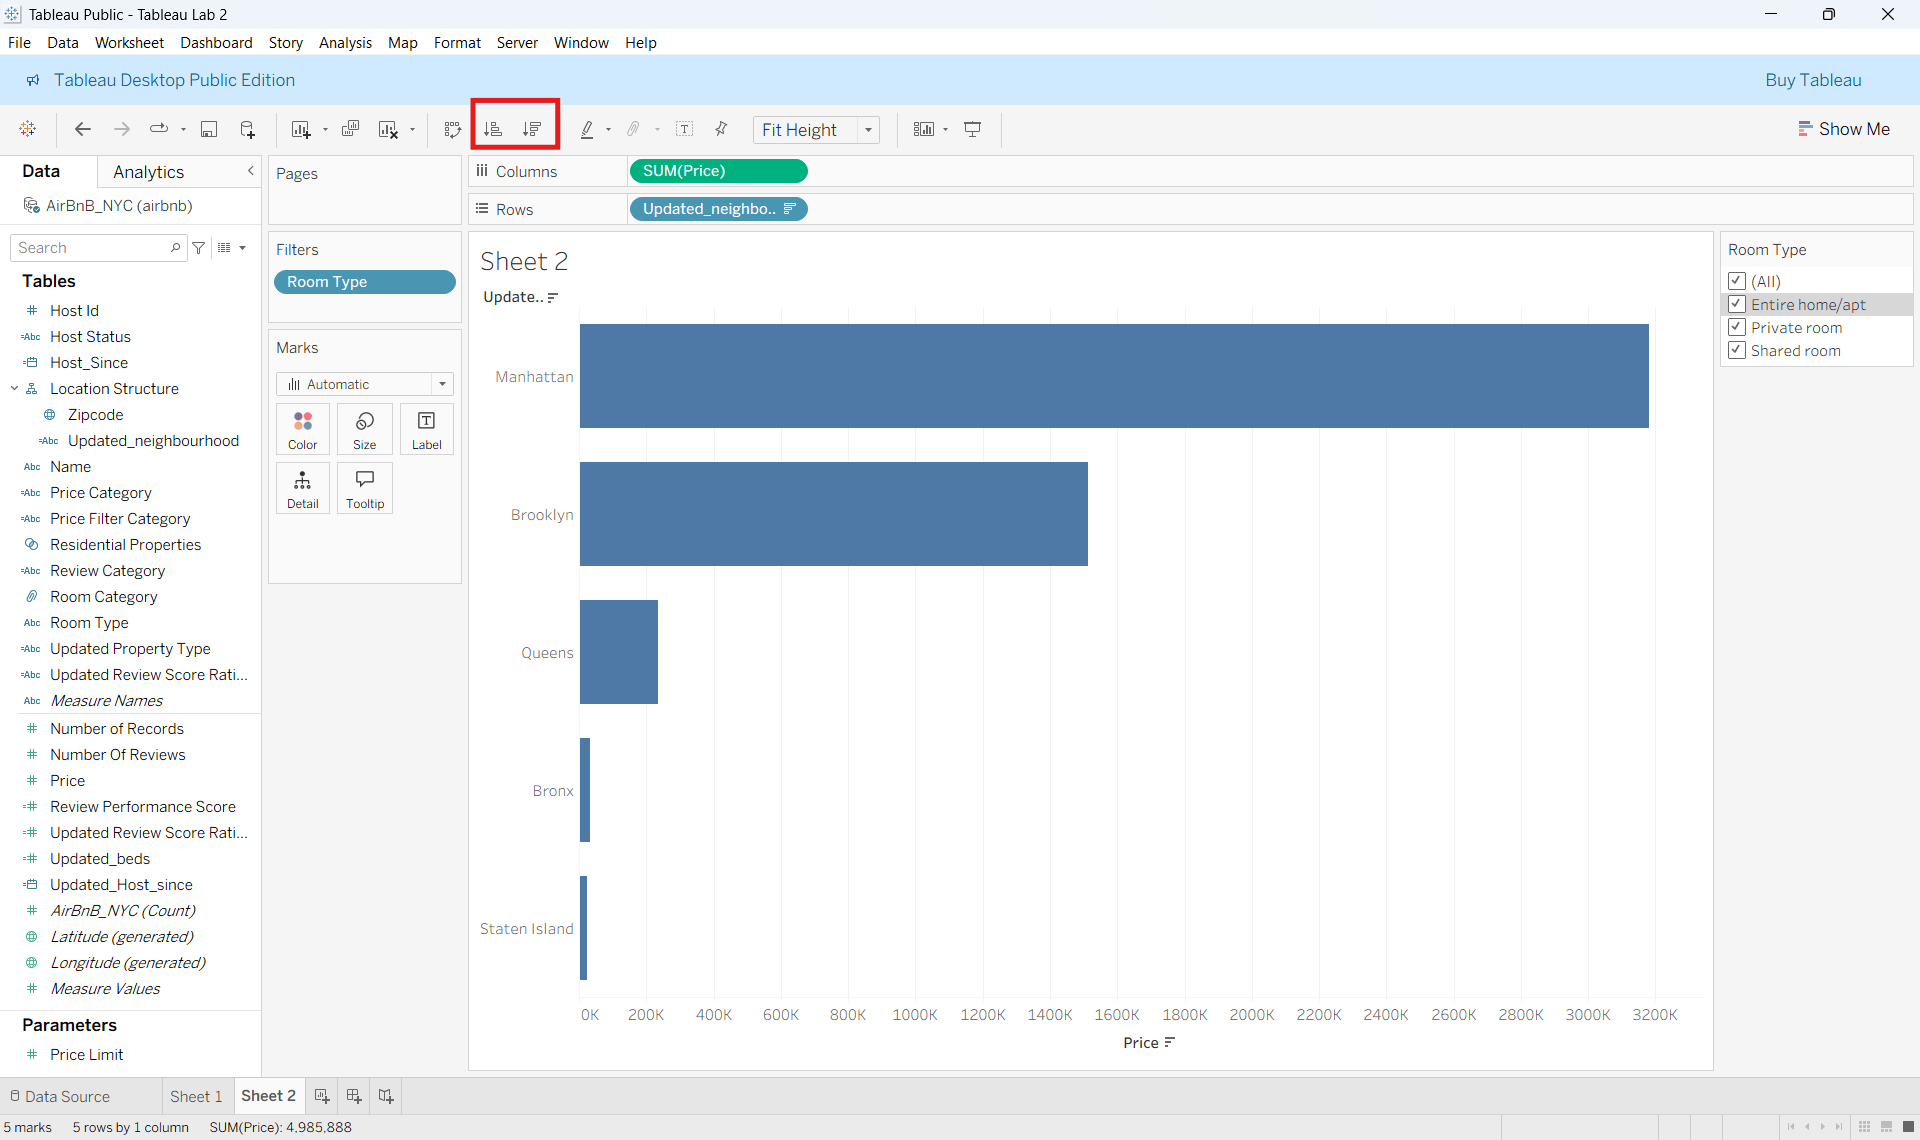
Observe how Tableau reorganizes rankings automatically.
Result:
The revenue analytics team can now identify which operational neighbourhoods generate the strongest pricing performance.
Task 2: Analyze Geographic Listing Distribution
The regional operations team wants geographic visibility into Airbnb business concentration and listing distribution across the city.
In this task, you will build location intelligence visualizations using the generated geographic fields available in the workbook.
Assign Geographic Roles
1
Inside the Data Pane:
Right-click:
- Updated_neighbourhood
Select:
- Geographic Role → City
Repeat for:
- Zipcode → Geographic Role → Zip Code/Postcode
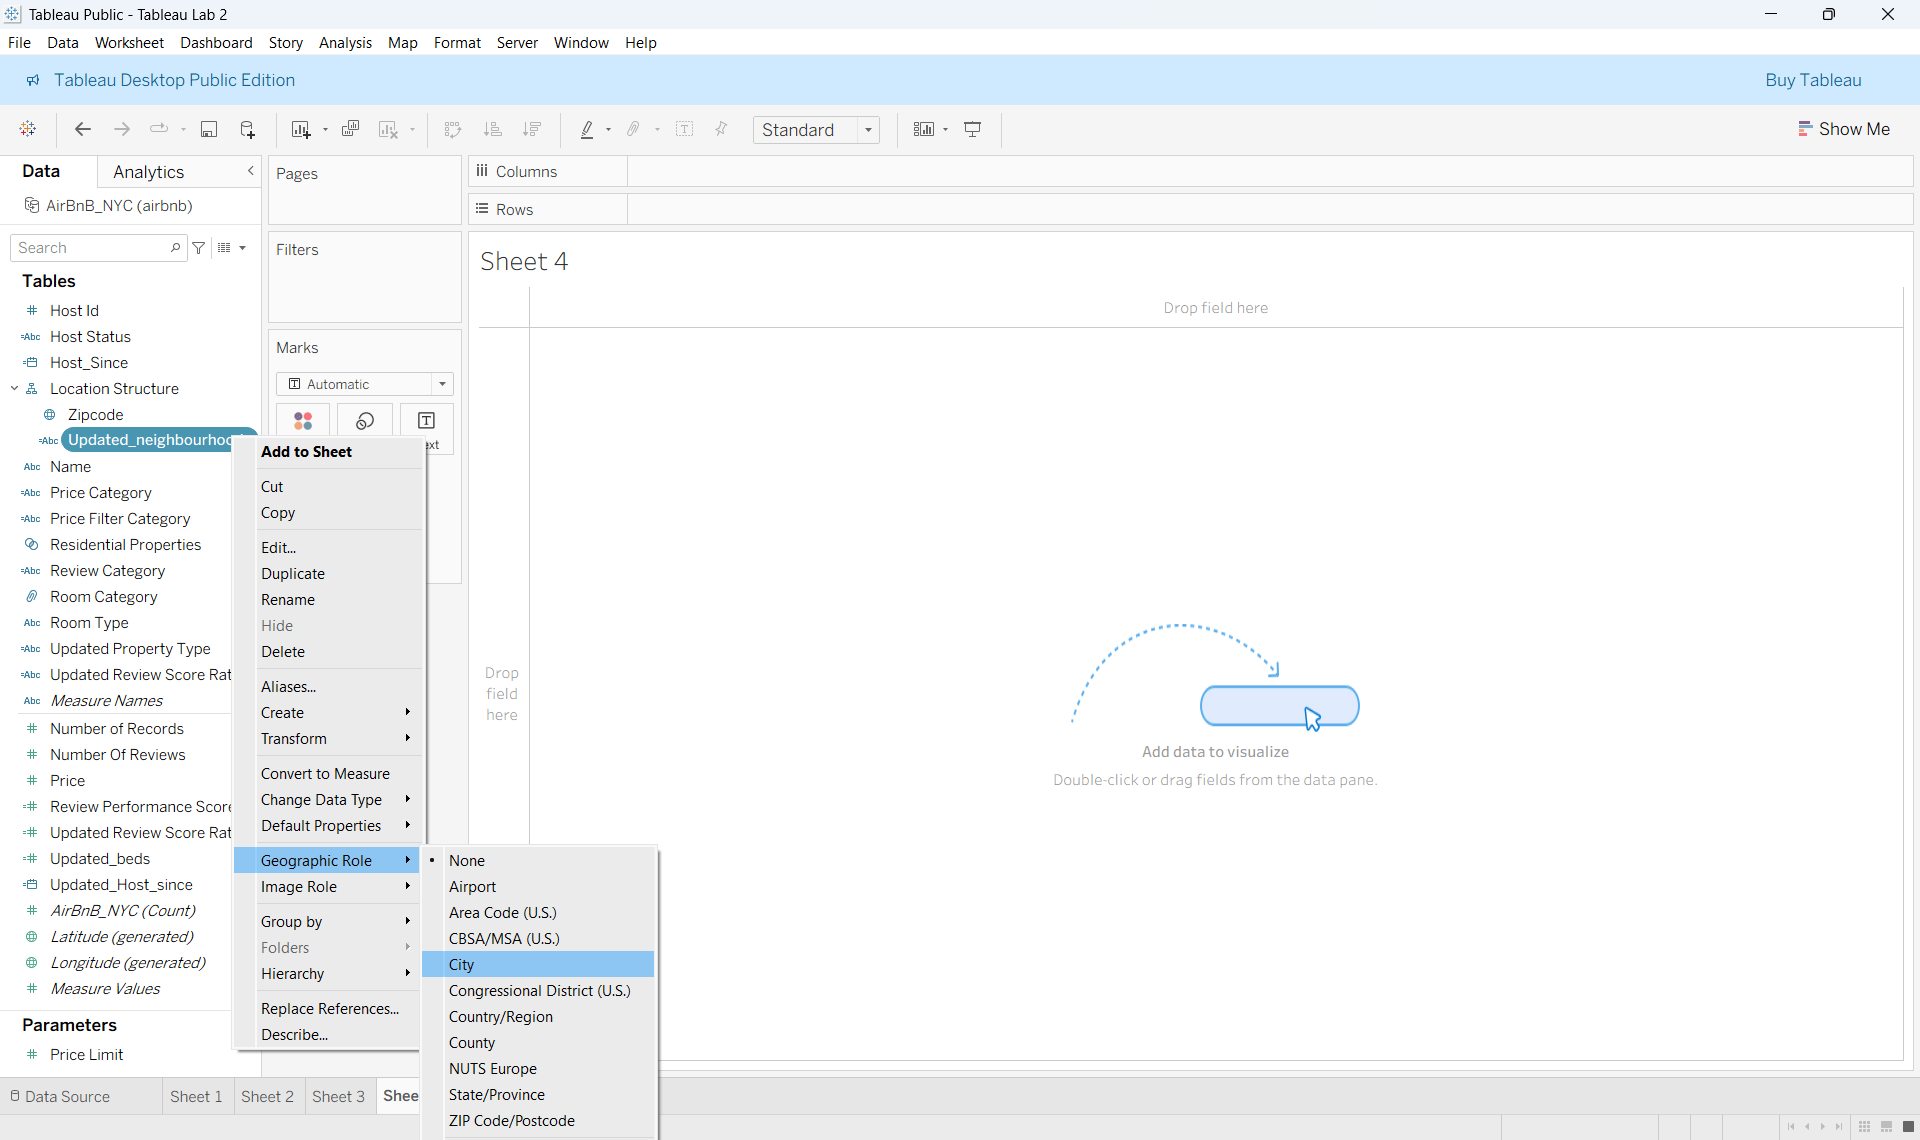
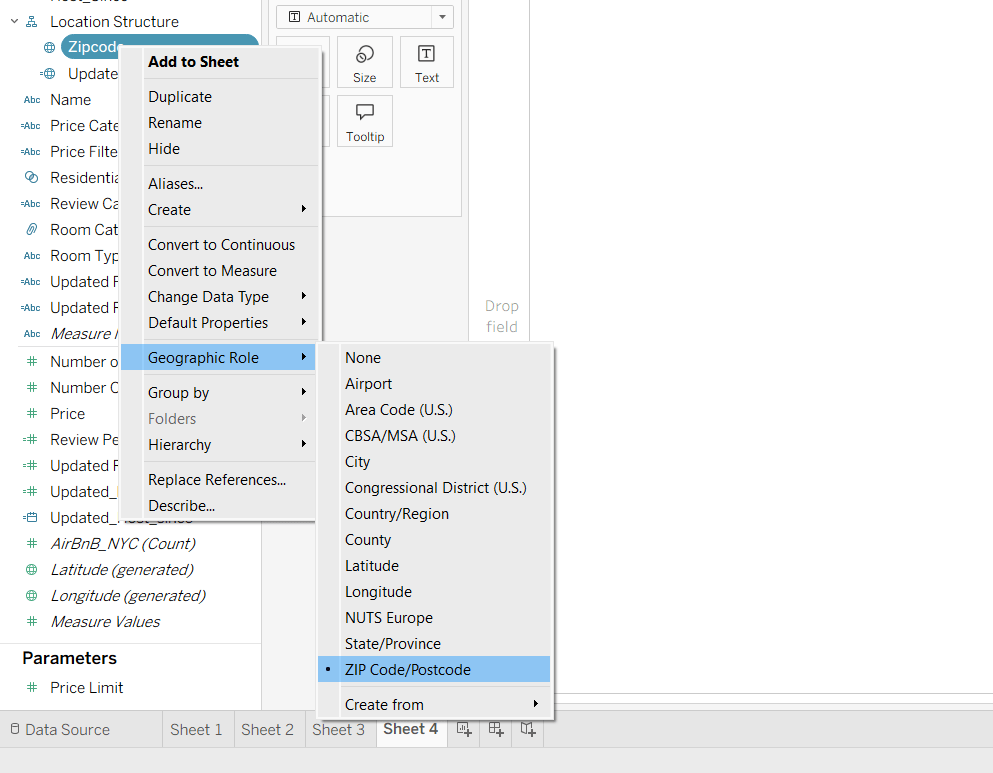
Observe how Tableau prepares the business fields for map visualization.
Build a Regional Performance View
2
Drag:
- Updated_neighbourhood → Columns
- Number Of Records → Rows
a
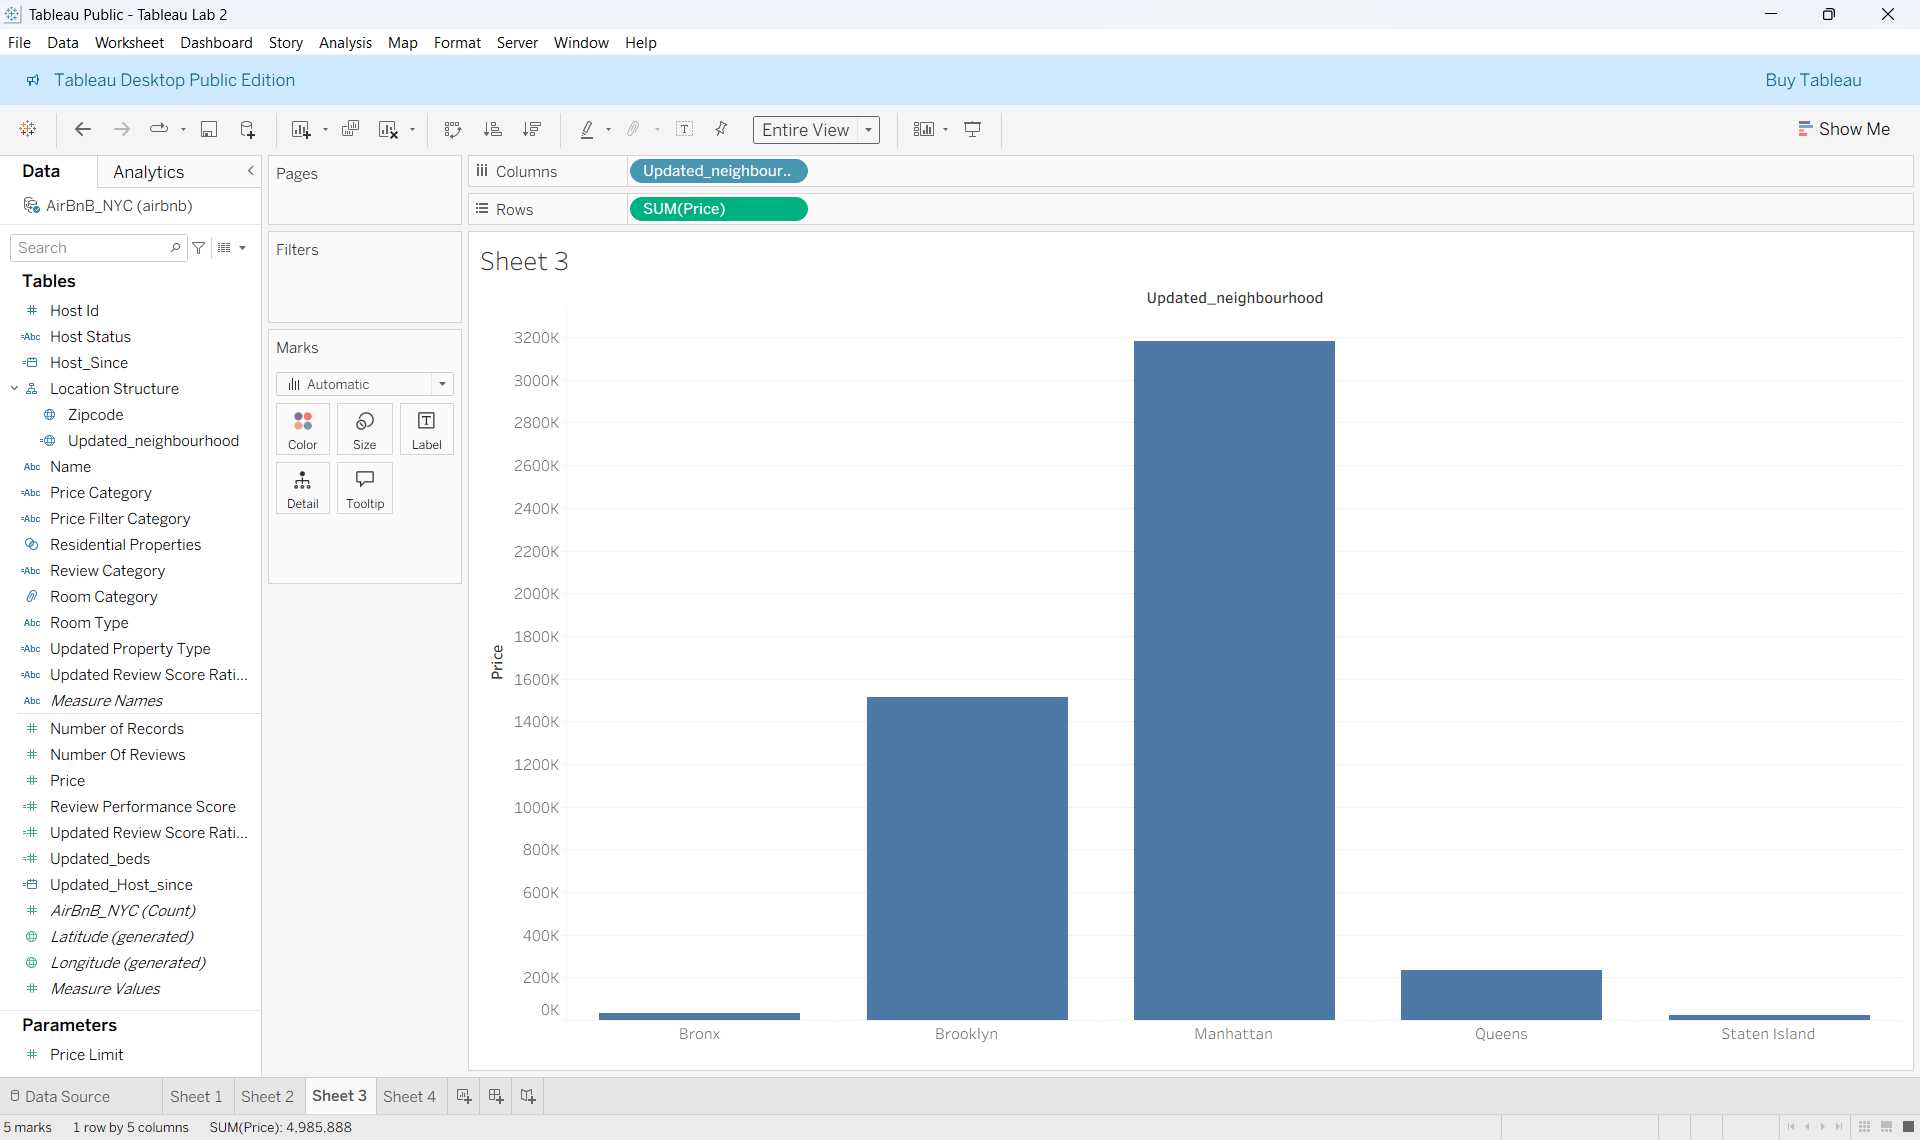
Observe the generated visualization showing listing concentration across operational regions.
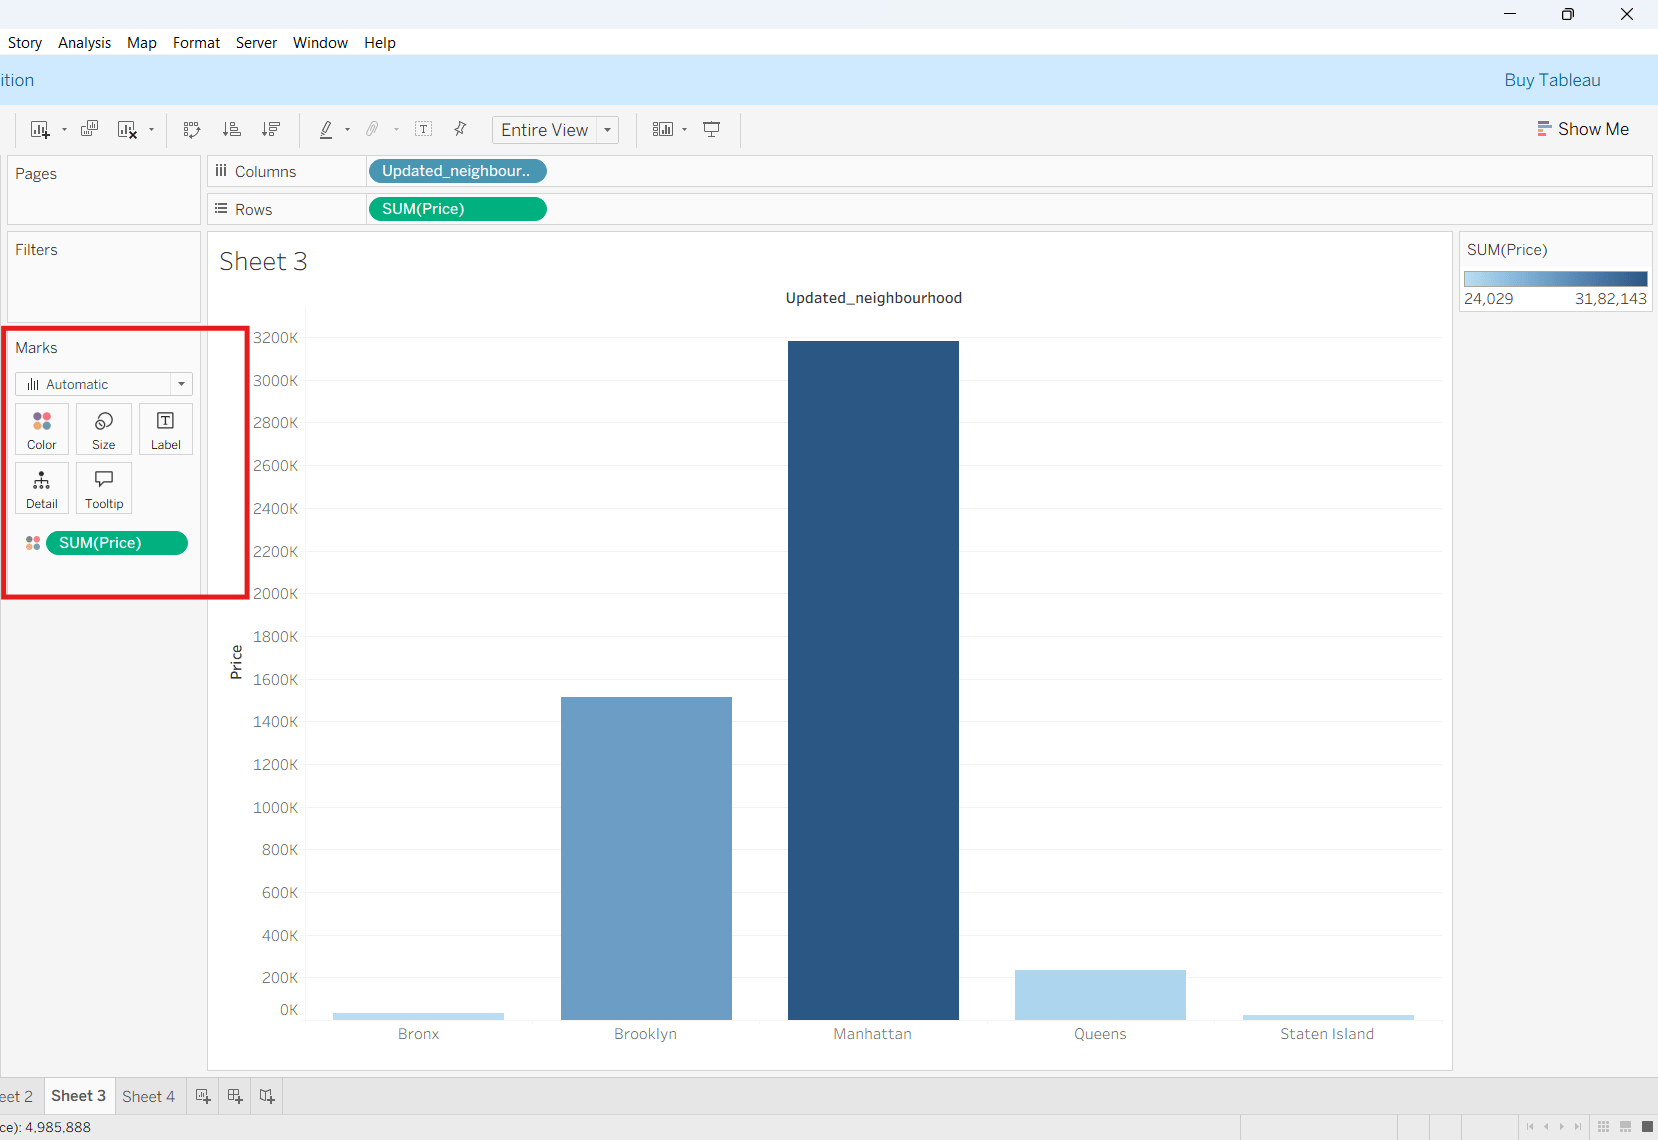
Add Pricing Intelligence
b
Drag:
- Price → Color
Observe how pricing performance varies across neighbourhoods.
Add Customer Activity Analysis
c
Higher color intensity represents stronger operational pricing concentration.
Drag:
- Number Of Reviews → Size
Observe how customer engagement differs across operational regions.
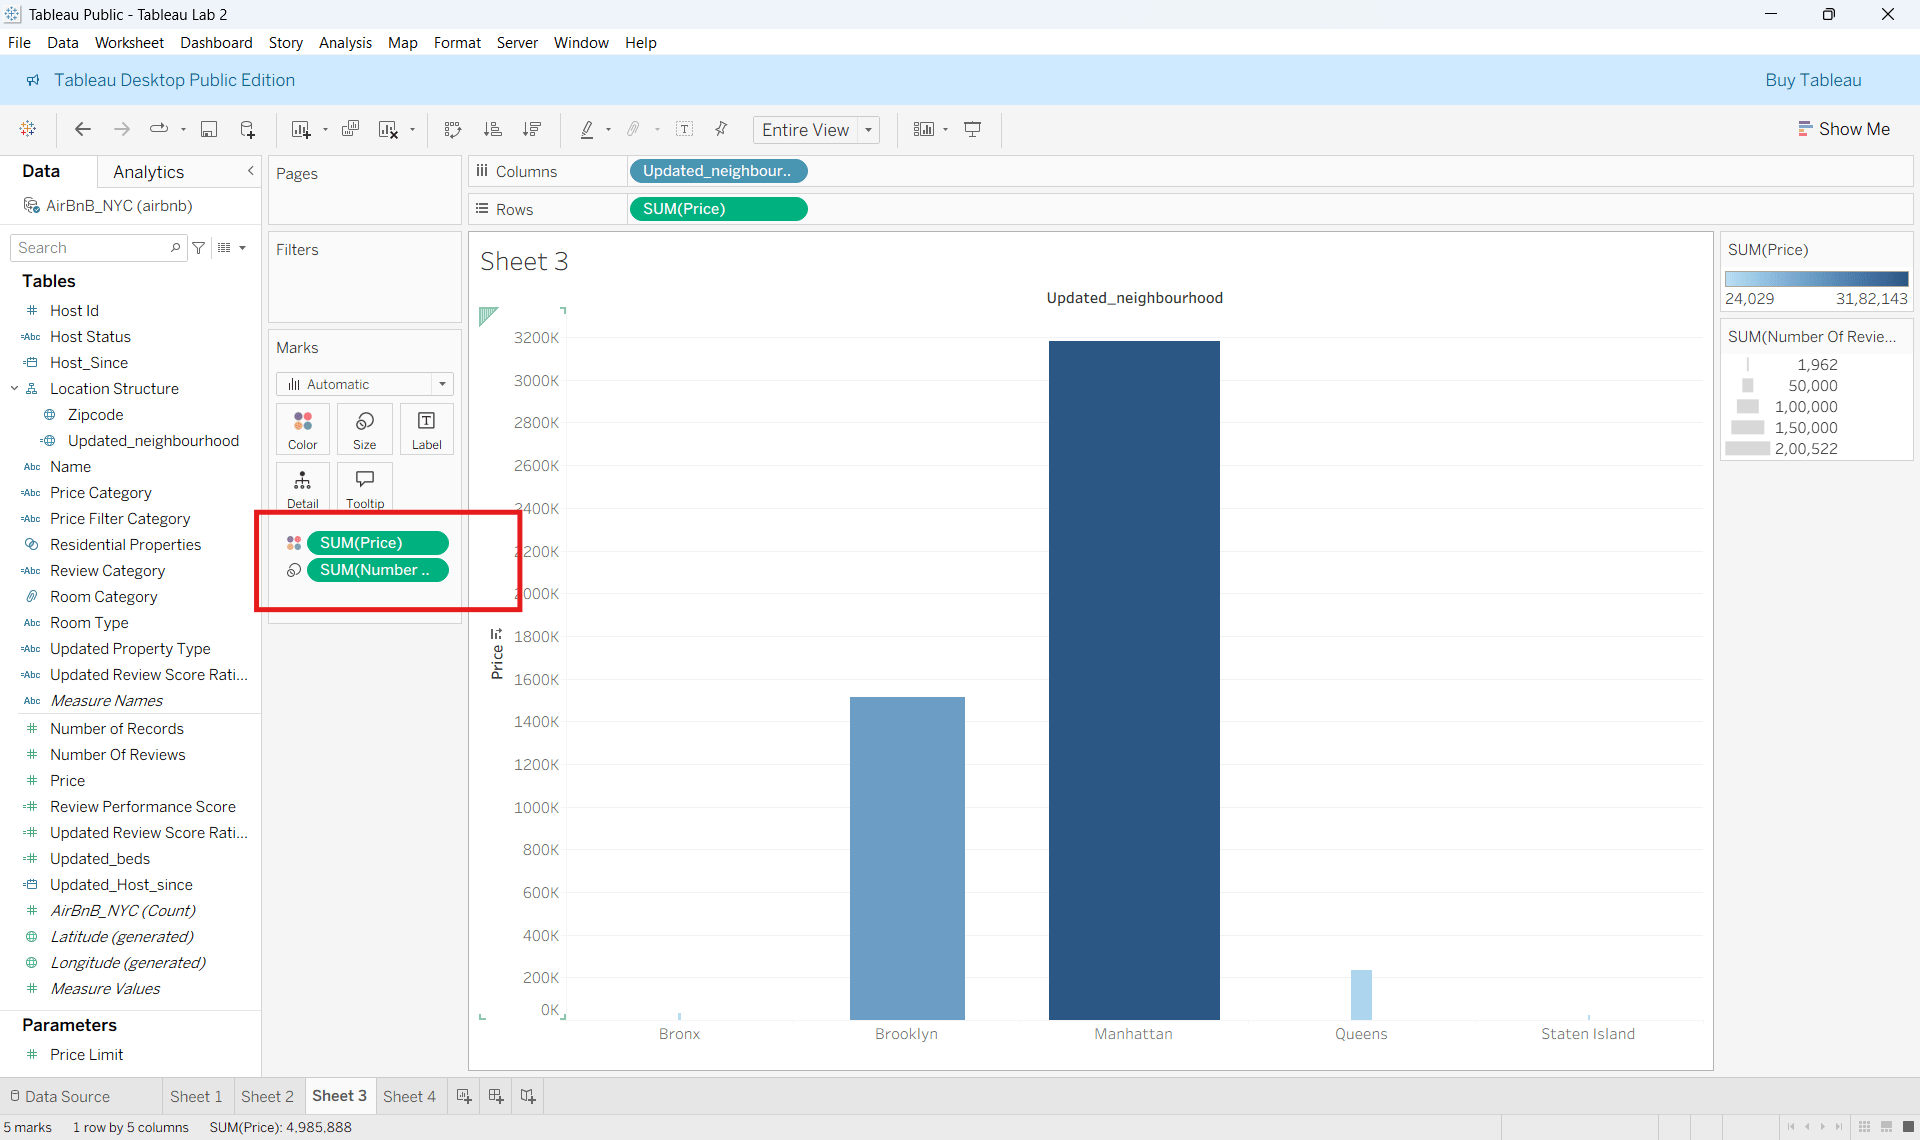
Larger visual markers indicate higher customer activity.
Add Operational Segmentation
d
Drag:
- Updated Property Type → Detail
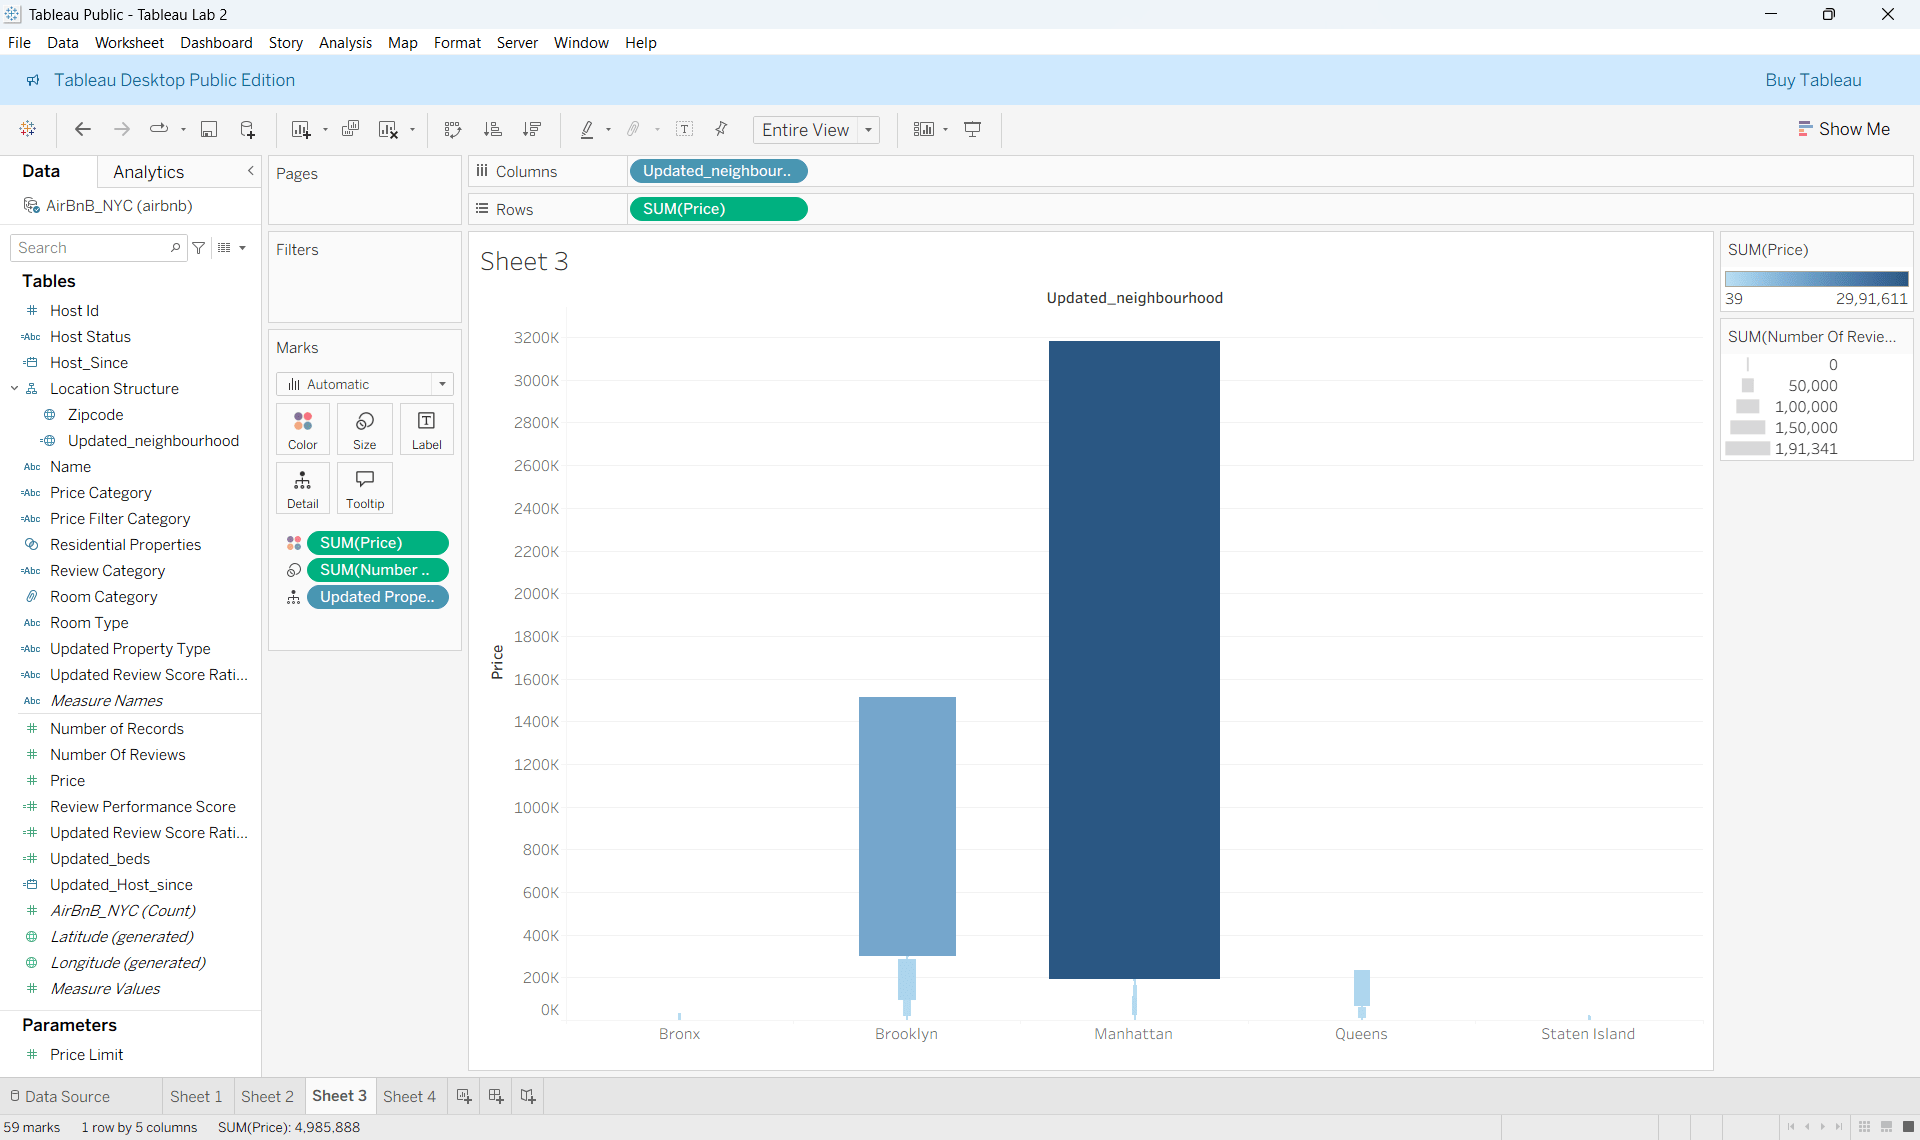
This allows business comparison between operational inventory categories.
Improve Visualization Readability
3
Organize Operational Rankings
Sort neighbourhoods from:
- Highest to Lowest listing concentration
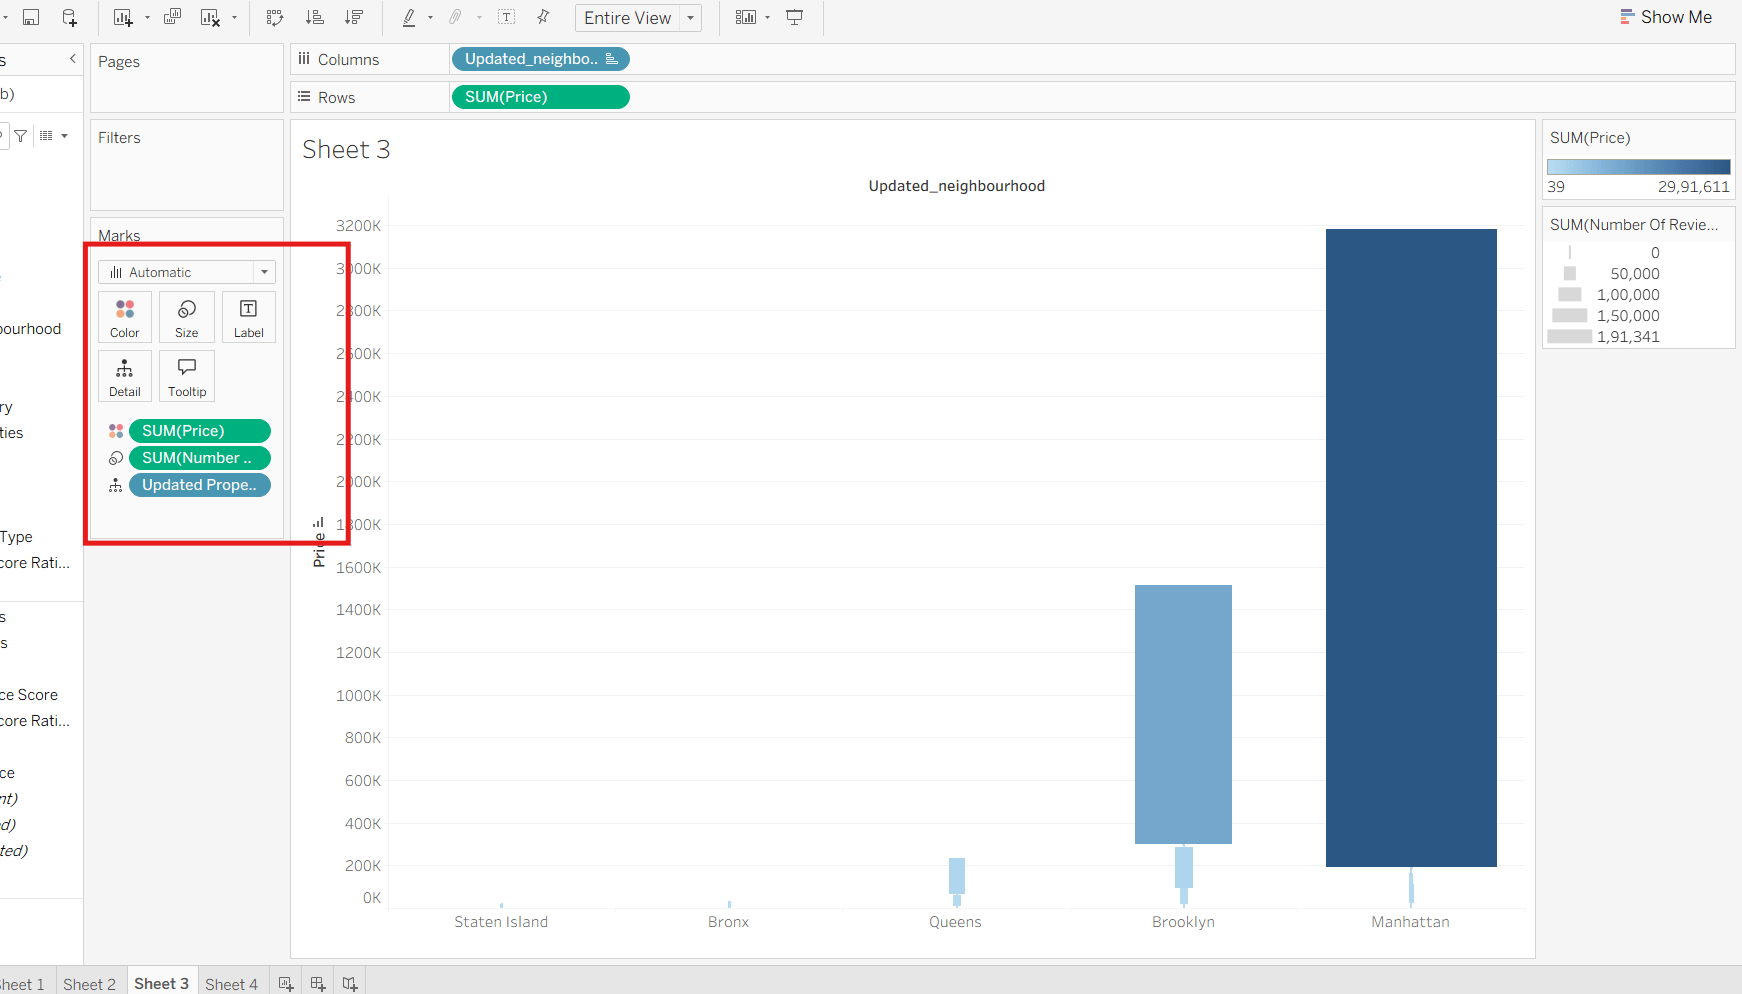
Task 3: Evaluate Property Inventory Contribution
The inventory management team wants to understand how Airbnb inventory is distributed across operational property categories and which business segments contribute the most operational value.
In this task, you will create advanced inventory distribution insights using property-based business fields.
Review Operational Property Categories
1
Observe Business Categories
Review fields such as:
- Residential Properties
- Updated Property Type
- Room Category
Observe major operational inventory categories.
Create Property Distribution Tree Map
2
Build the Tree Map Structure
a
Drag:
- Updated Property Type → Marks card → Label
- Number Of Records → Marks card → Size
Observe how Tableau creates a tree map representing operational inventory distribution.
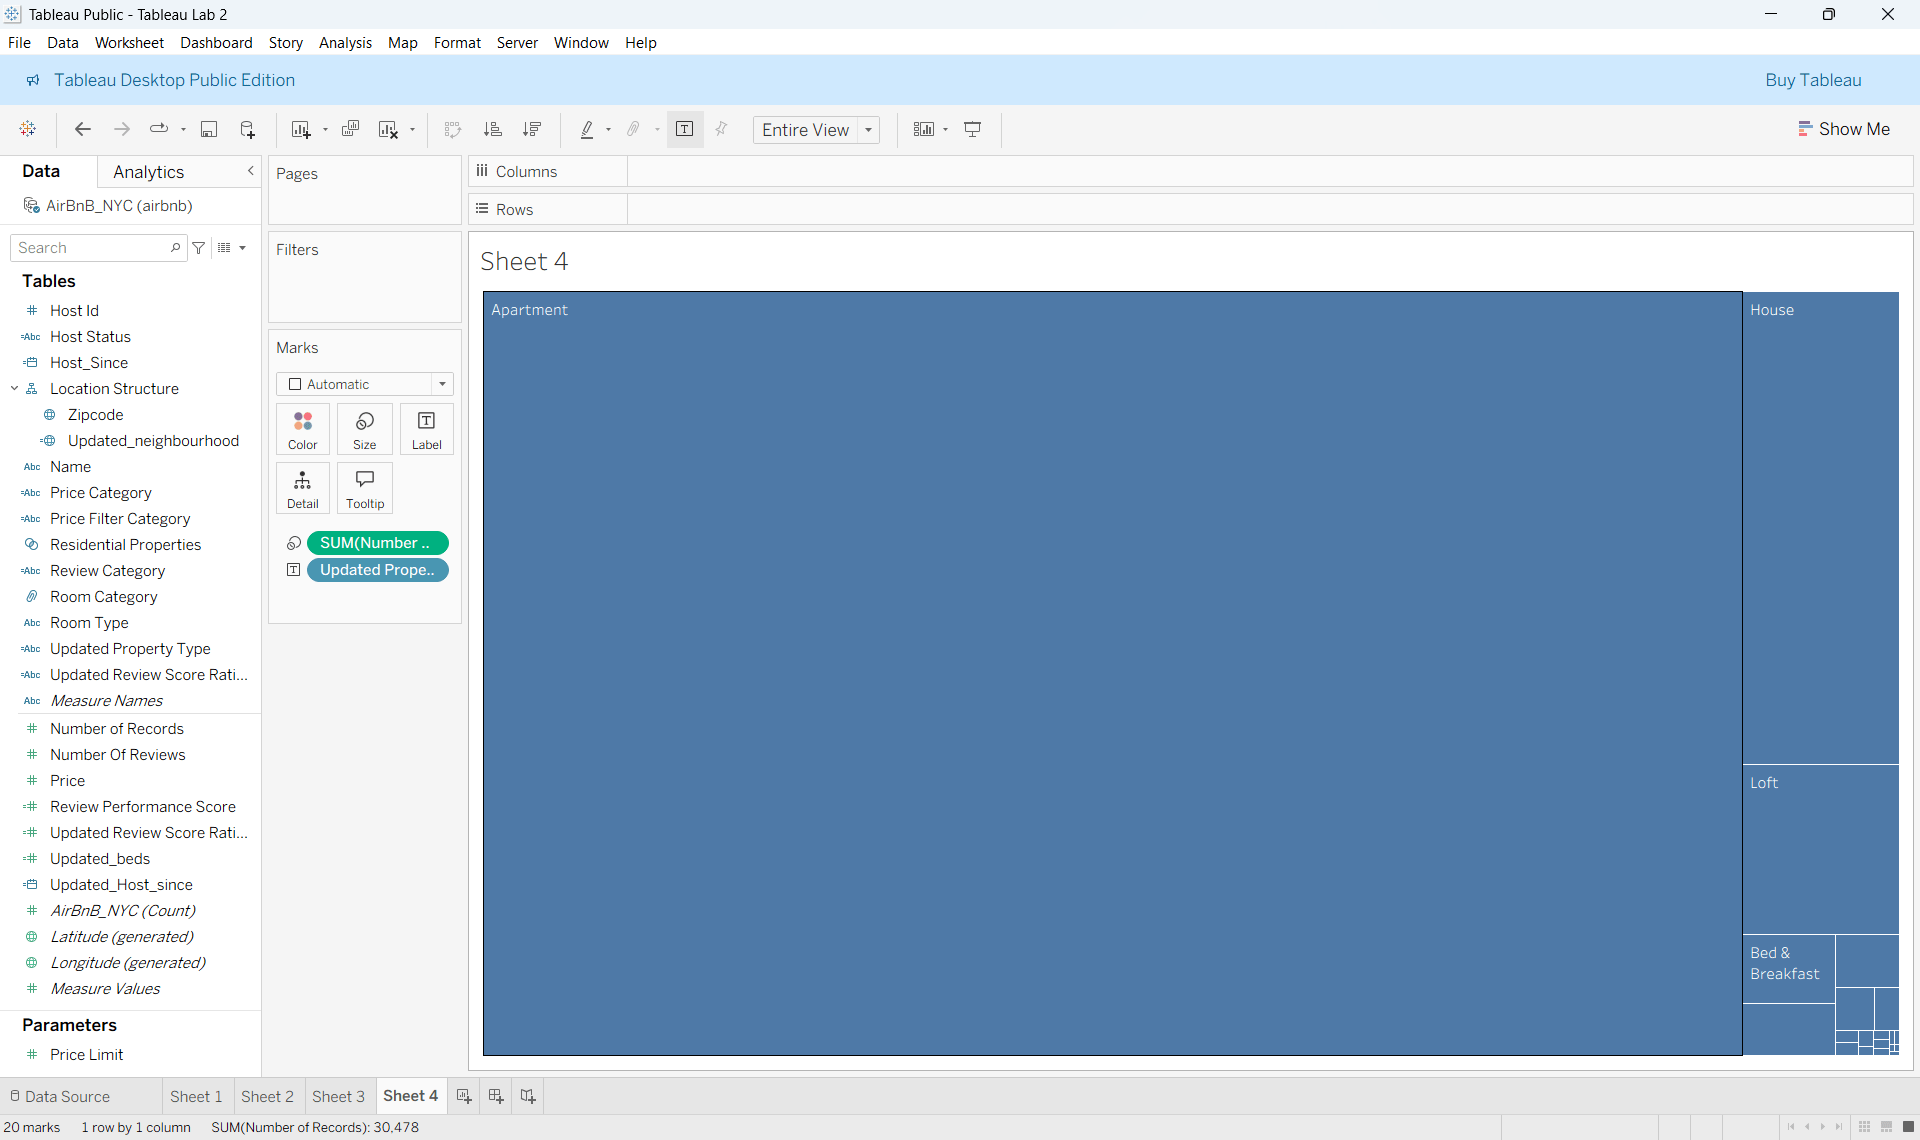
Larger sections represent property categories with higher listing concentration.
Add Pricing Intelligence
b
Drag:
- Price → Marks card → Color
Observe how pricing performance varies across property categories.
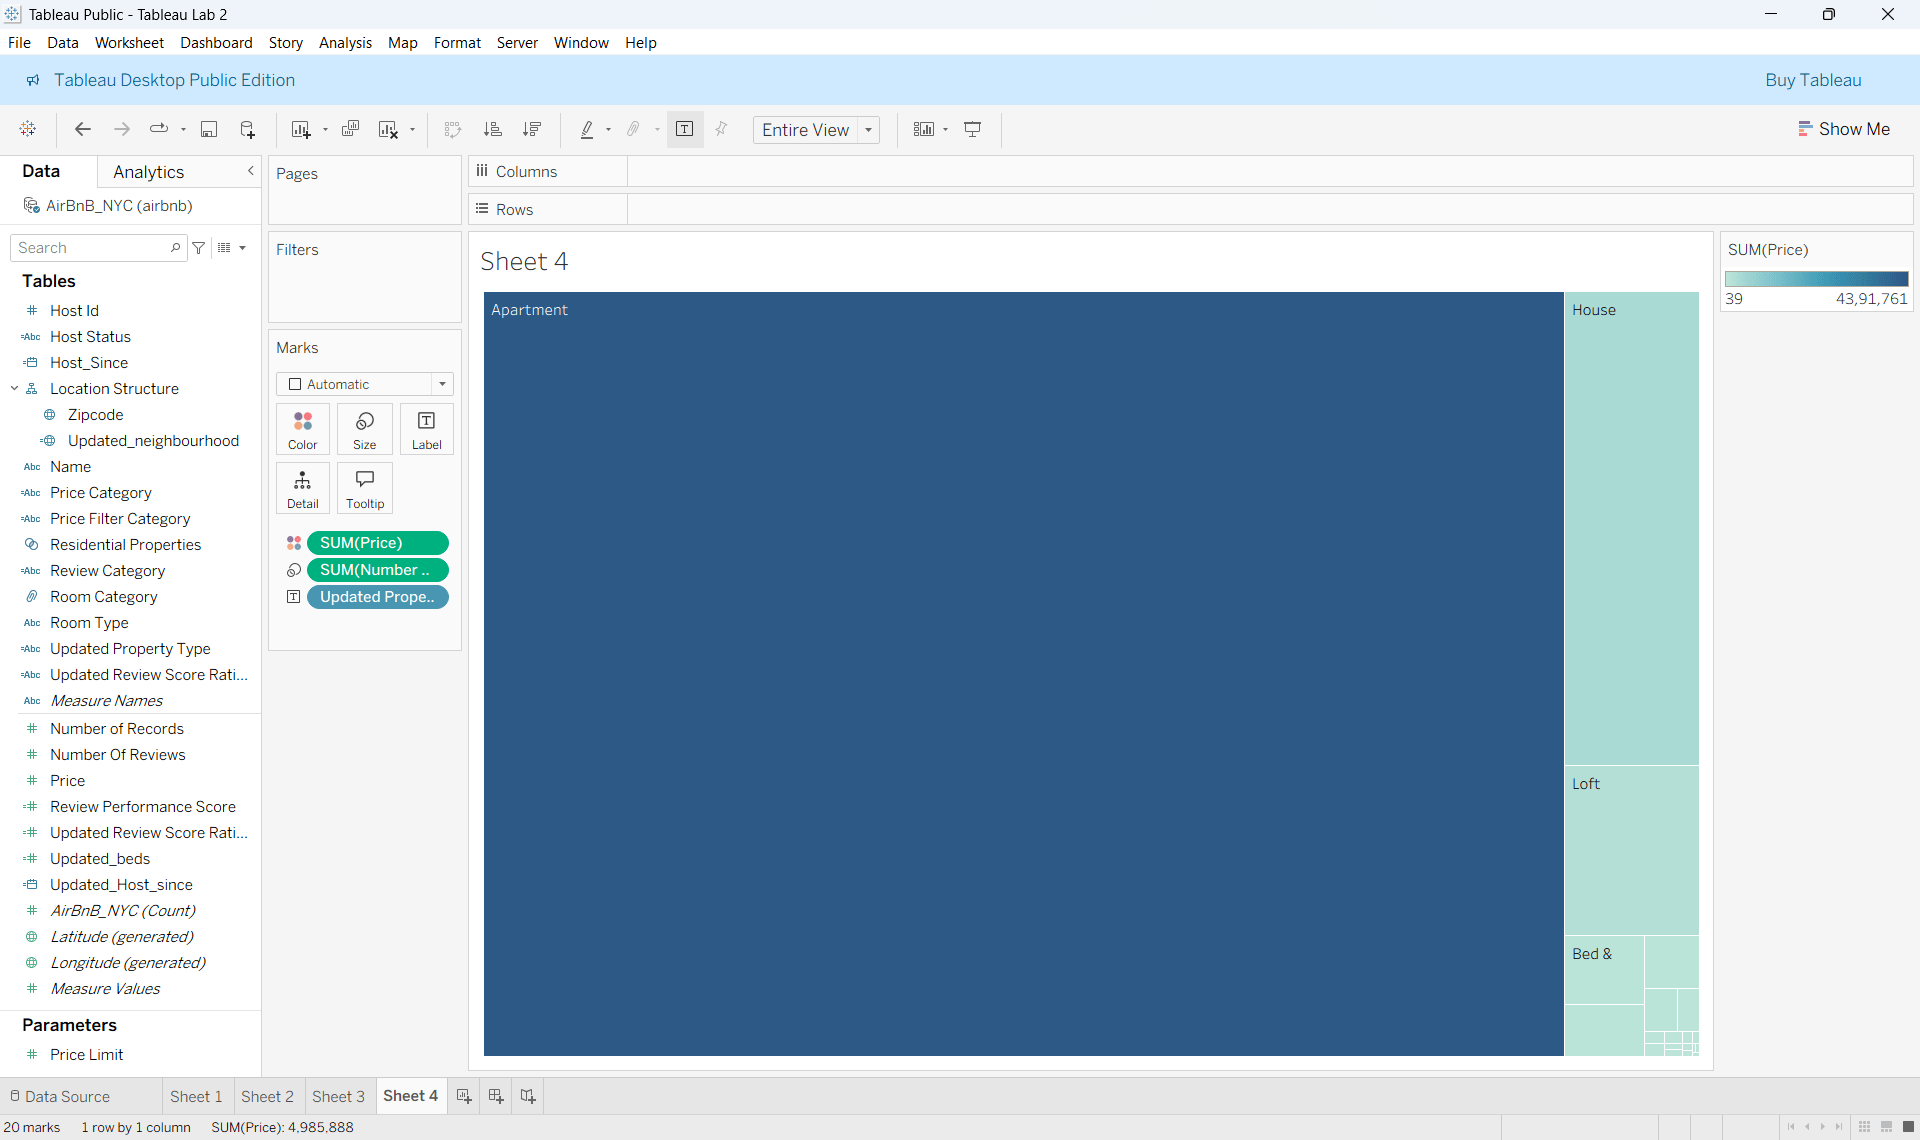
Higher color intensity represents stronger pricing contribution.
Add Customer Activity Insights
Drag:
- Number Of Reviews → Marks card → Detail
Observe how customer engagement differs between operational property categories.
c
Enhance Operational Analysis
3
Add Business Labels
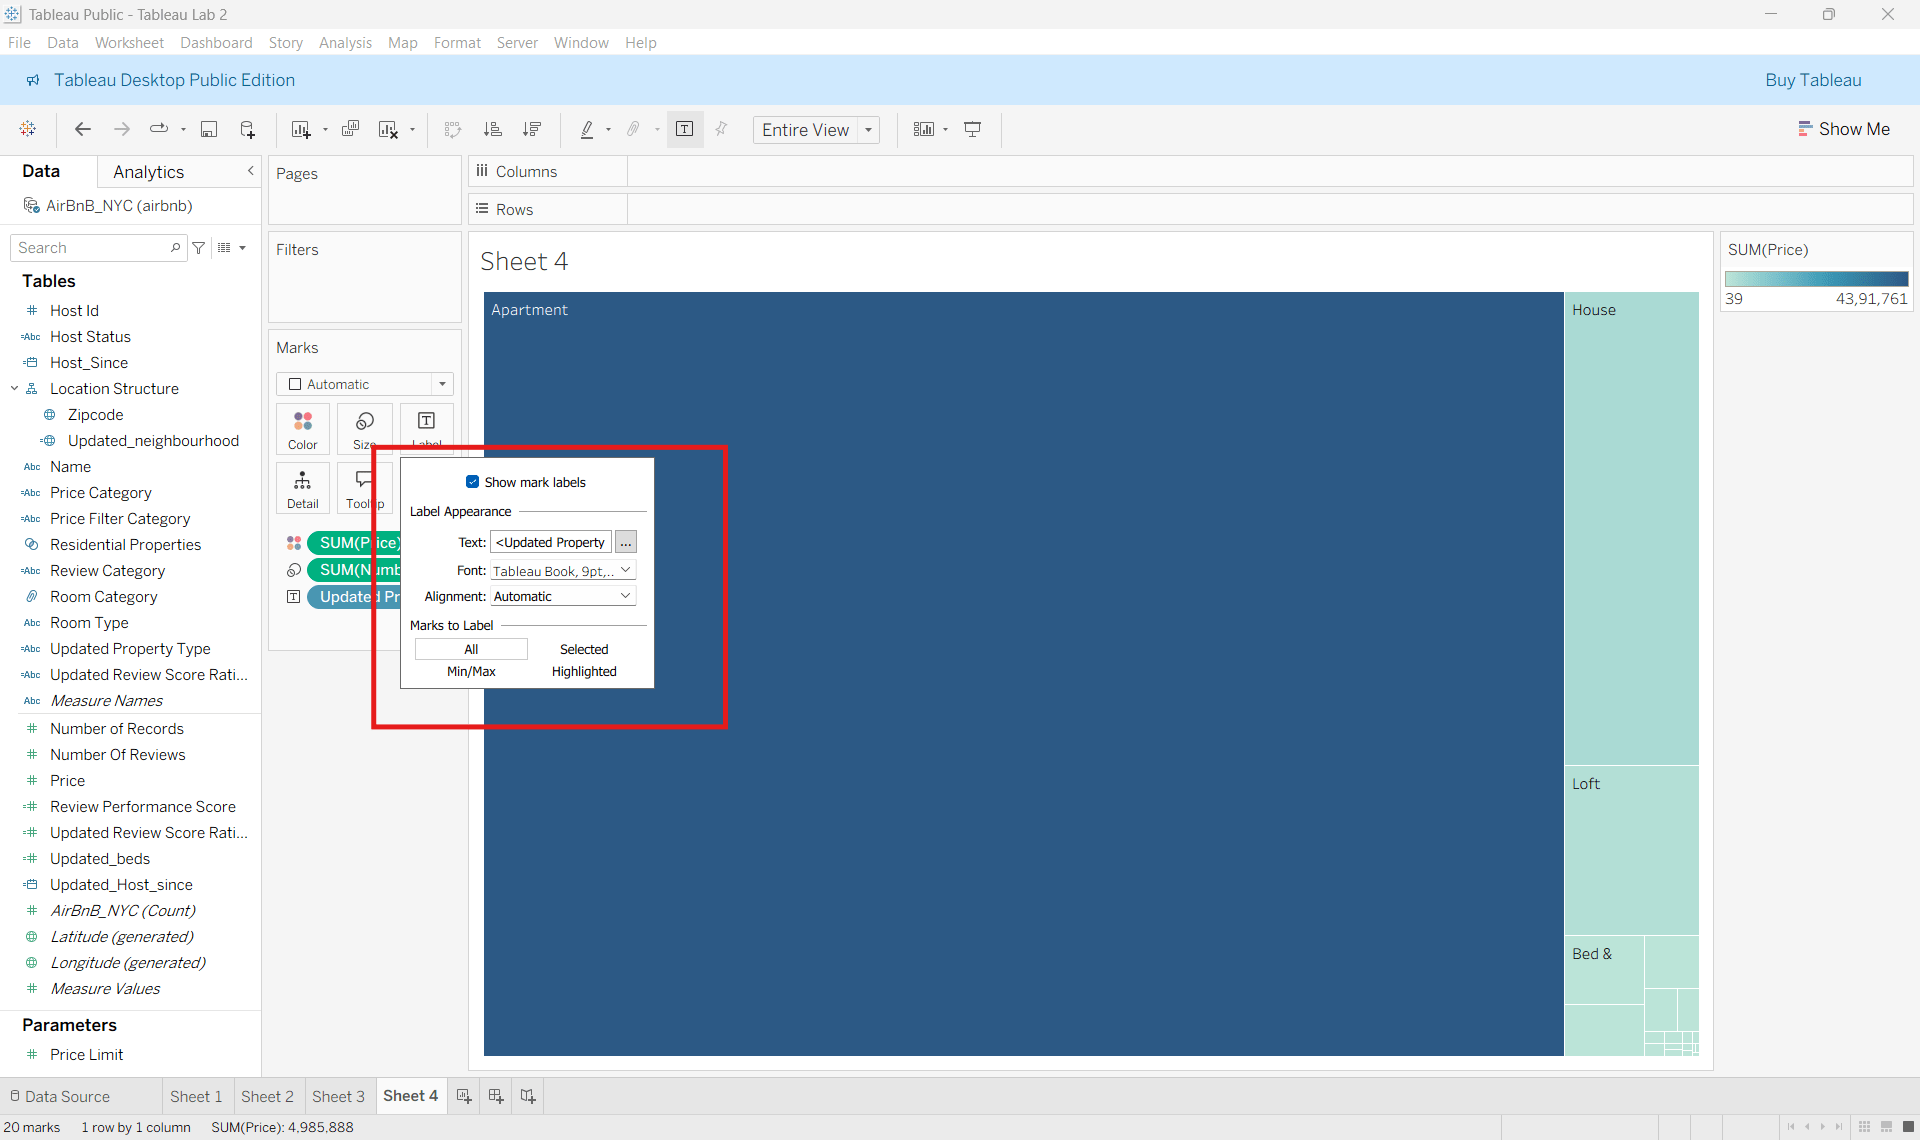
From the Marks card:
Enable:
- Label → Show Mark Labels
Observe how operational categories become easier to identify.
a
Task 1: Understanding BRD
Before you start building anything, you need to clearly understand what the client actually wants.So, let’s begin by understanding the BRD (Business Requirement Document) shared by the client.
BRD Full Form is Business Requirement Details.BRD like a plan for building a house. This plan helps the builder understand what to build.In the same way,BRD tells developers what the client wants to build
Click to download BRD : BiteBox_BRD.pdf
Activity
After going through BRD list down the Core Features and Web Pages in the tabulated Format as shown Below.
| Col 1 | Col 2 | Col 3 |
|---|---|---|
| Row 1 | ||
| Row 2 | ||
| Row 3 |
Formula
Profit = Revenue - Cost
Task 2: Create WireFrame
Now that you understand the requirements, don’t jump into coding yet. Before development, we always visualize the layout.
Now lets create a simple wireframe for the homepage.
A wireframe is like a layout plan of a house. Before building, you decide where rooms, doors, and windows will be placed.Similarly, a wireframe helps you plan where elements like headers, images, and buttons will appear on a webpage—before adding design or colours.
Task 3: Code Editor Installation
Good work on completing the planning phase.
Now we will start development. Before that, make sure your system is ready with the required tools.
In this step we will install the VS code editor that will help to Write code efficiently,Organize files , Run and test your application
Go to the visual studio code official website
1
Click to download Homepage Wireframe : Homepage Wireframe
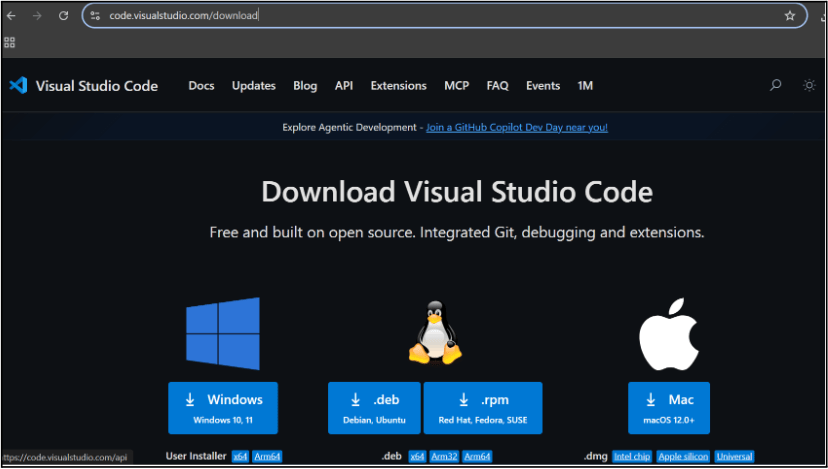
Choose your operating system(windows / Mac) and download the installation file.
Double click on the download app and Accept the agreement and click next
2
It is a long established fact that a reader will be distracted
b
Sub Steps
a
Double click on the download app and Accept the agreement and click next
public class MathSample {
    public static void main(String[] args) {
        int x = 10;
        int y = 20;
        int sum = x + y;

        System.out.println("The sum is: " + sum);
    }
}
public class MathSample {
public static void main(String[] args) {
int x = 10;
int y = 20;
int sum = x + y;
System.out.println("The sum is: " + sum);
}
}
public class MathSample {
public static void main(String[] args) {
int x = 10;
int y = 20;
int sum = x + y;
System.out.println("The sum is: " + sum);
}
}
Great job!
You have successfully completed your first lab on BiteBox Project Onboarding.
In this lab, you have: Understood the BRD, Created a wireframe, Set up your development environment, Organised your project structure, Run your first program
You are now ready to move to the next stage of development
Checkpoint
Next-Lab Preparation
Git Push
git push origin branchNameTopic : Working with a Text and Listin HTML
1) Power of HTML text tags
2) Customizing your style with CSS
3) Listing it right using HTML
4) HTML Link up , attributes of tag, block vs inline elements
Text box Width : 887
Business Scenario, Pre-lab Preparation, Next-lab Preparation, Task, Activity, Checkpoint : 90%.
Steps : 1,2,3 [Sub Steps - a,b,c]
Normal Text, Topic Name : 80%
Subtopic : 70%
Code Box font Size : 16px