Analysis of Macroeconomic Indicators

You are a Macro-Strategist at an institutional investment firm. Before your portfolio managers can select individual stocks to buy, they rely on you to provide a "Top-Down" view of the broader economy.
You must analyze the current trajectory of India's GDP growth, retail inflation (CPI), and the Reserve Bank of India's (RBI) interest rates. By interpreting how these three interconnected gears are turning, you will advise your team on which specific industry sectors (such as Real Estate, Auto, FMCG, or IT) are poised to benefit or suffer in the current economic climate.
Business Scenario

Pre-Lab Preparation
Topic : Fundamental & Ratio Analysis
-
Company analysis
-
Industry analysis
-
Macroeconomic analysis
-
Revenue and cost drivers
-
Liquidity ratios, Profitability ratios, Leverage ratios, Efficiency ratios
Task 1: Analyze GDP, Inflation, and Interest Rates
You must first gather the raw macroeconomic data before forming a thesis.
1
Access the Macro Dashboard
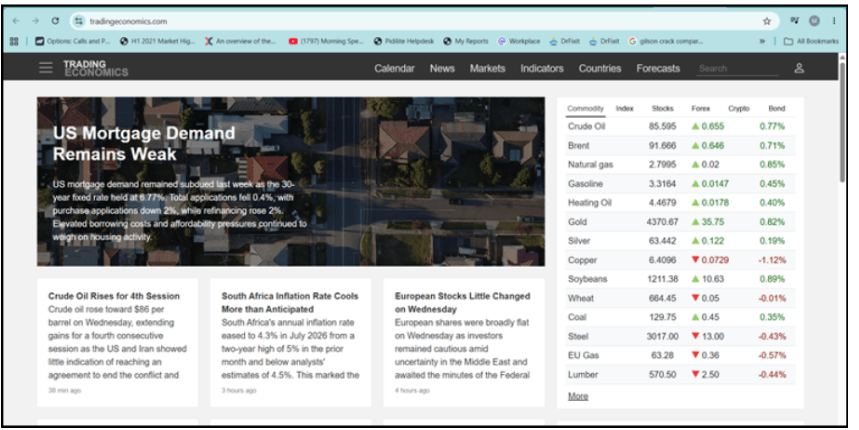
Open your web browser and navigate to TradingEconomics.com.
a
Why use Trading Economics?
It provides:
-
Current economic indicators
-
Historical data
-
Interactive charts
-
Forecasts
-
Economic calendars
-
Country comparisons
b
In the search bar at the top right, type India (or your target country)

2
Check Current Baseline Metrics
Locate the Overview Option on the dashboard

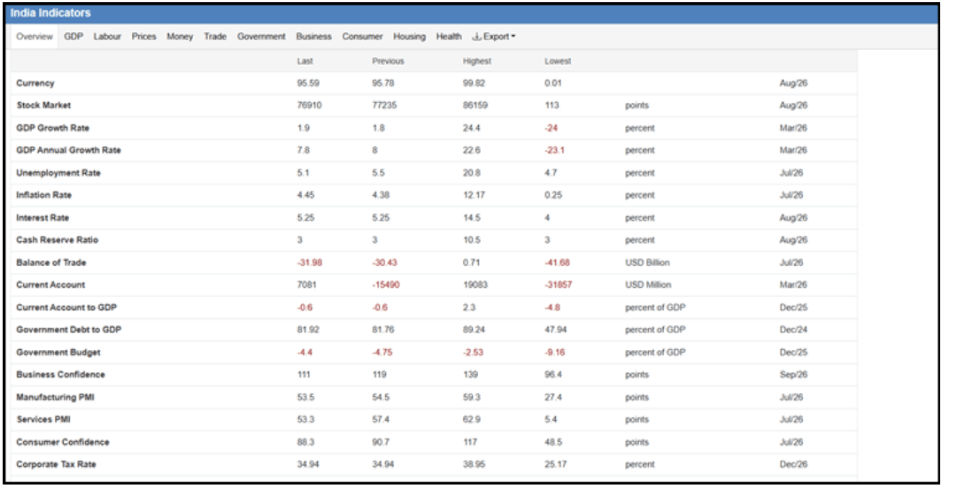
You can see macroeconomic figures for India:
Review the live indicator summary table on the dashboard and record India's core macroeconomic baseline:
| Macroeconomic Indicator | Live Dashboard Value | Economic Significance & Measurement |
|---|---|---|
| GDP Annual Growth Rate | 7.80% (Annual: ~6.7%–7.6%) | Tracks growth; India remains a fast-growing major economy. |
| GDP Growth Rate (Quarterly) | 1.90% | Sequential quarterly economic growth rate. |
| Macroeconomic Indicator | Live Dashboard Value | Economic Significance & Measurement |
|---|---|---|
| GDP Annual Growth Rate | 7.80% (Annual: ~6.7%–7.6%) | Tracks growth; India remains a fast-growing major economy. |
| GDP Growth Rate (Quarterly) | 1.90% | Sequential quarterly economic growth rate. |
| Inflation Rate (CPI YoY) | 4.45% | Retail inflation; closely aligned with the RBI’s medium-term tolerance midpoint (~4.0%). |
| RBI Interest Rate (Repo Rate) | 5.25% | Benchmark policy rate at which the RBI lends short-term funds to commercial banks. |
| Cash Reserve Ratio (CRR) | 3.00% | The mandatory cash balance commercial banks must park with the RBI. |
| Unemployment Rate | 5.10% | Percentage of the active labor force seeking employment. |
| Currency (USD / INR) | ~95.59 | Exchange rate impact on trade and exports. |
3
Chart & Analyze 5-Year Historical Trends
A. Charting the Inflation Rate (CPI)
-
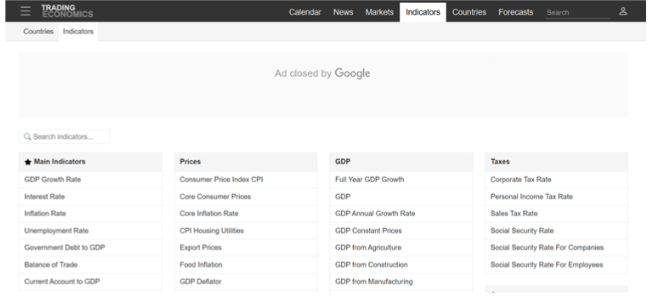
On the menu bar, click on the "Indicators" tab.
-
In the categories dashboard, click on "Inflation Rate" under the Main Indicators.
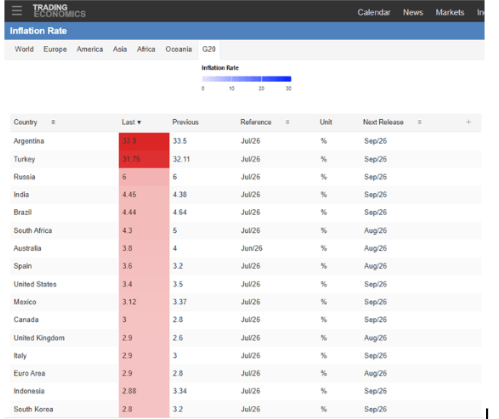
3 . On the global table, locate India and click directly on the blue text "India" to open its detailed chart page.
-
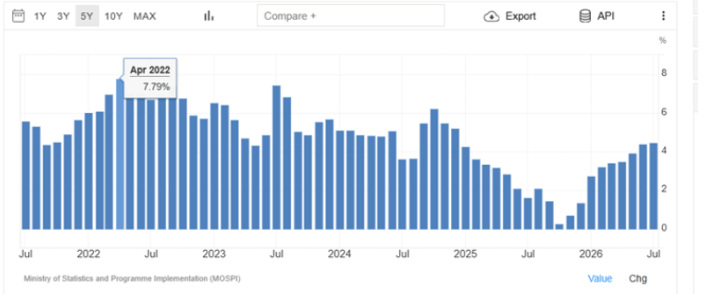
Select the chart timeline buttons above the graph to 5Y (5 Years) to observe past inflation peaks (such as the post-pandemic supply chain and energy price shocks around 2022–2023). Notice how the current trend behaves relative to the RBI's target.
Above the chart, select the 5Y (5 Years) button:
-
Observation Check (The Spike): Observe the peak in 2022–2023 (where inflation crossed 7.5% due to global commodity shocks and geopolitical supply bottlenecks).
-
Observation Check (The Cool-off): Notice how inflation moderated through 2025 (bottoming under 1.5%) before returning to the current 4.45% level.
B. Charting the RBI Repo Rate (Central Bank Policy Response)
-
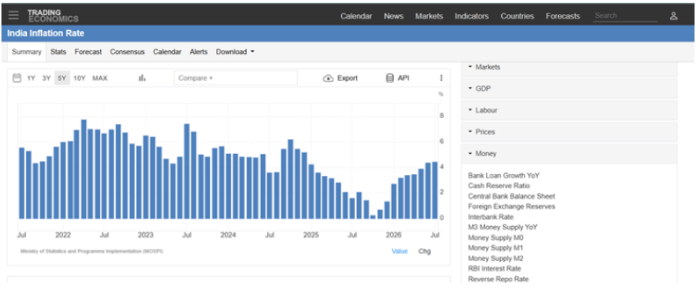
On the right-hand sidebar menu, locate and click the + Money category.
-
In the dropdown list under Money, click directly on RBI Interest Rate (or search India Interest Rate in the top search bar).
-
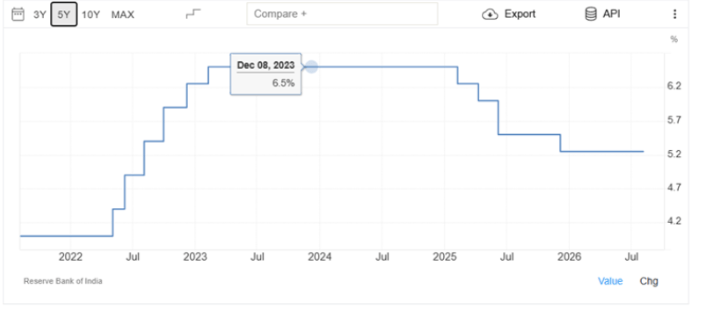
On the dedicated chart page, click the 5Y button above the line graph:
-
Observation Check (Policy Tightening): Observe how the RBI hiked the policy repo rate from 4.00% up to 6.50% during the 2022–2023 inflation spike to curb excess liquidity and stabilize prices.
-
Observation Check (Policy Easing / Pause): Observe the subsequent shift to a calibrated rate-cut / neutral cycle down toward 5.25% as price pressures cooled.
Task 2 : Interpret Macro Trends & Real Cost of Capital
Connect the gathered indicators to interpret the central bank's stance and the corporate financing environment:
1
Calculate the "Real Interest Rate"
Nominal interest rates do not show the actual real cost of borrowing. Calculate the Real Interest Rate:
-
Analytical Interpretation: A moderately positive real interest rate of +0.80% indicates a healthy equilibrium. Depositors receive a real return above inflation, while corporate borrowers are not burdened by restrictive monetary tightening.
2
The Macroeconomic Regime
-
GDP Growth (7.80%) + Stable Inflation (4.45%) + Repo Rate (5.25%):
This environment reflects a resilient domestic expansion phase
(often described as a Goldilocks economy), where economic output expands without triggering severe monetary tightening.
Task 3 : Study Sector & Industry Impact
Translate the macroeconomic environment into industry-level performance drivers:
1. Rate-Sensitive Sectors (Real Estate, Automobiles, NBFCs)
-
Mechanism: Consumers rely heavily on vehicle loans, consumer durable EMIs, and home mortgages.
-
Impact Check: With the repo rate steady at 5.25% (down from earlier peaks of 6.50%), borrowing costs are manageable, supporting retail credit disbursement and housing demand.
2. Defensive Sectors (FMCG, Pharmaceuticals)
-
Mechanism: Companies produce everyday consumer essentials with inelastic demand (e.g., ITC, HUL)
-
Impact Check: Controlled headline inflation (4.45%) keeps raw material costs (crude derivatives, packaging, agricultural commodities) predictable, protecting operating profit margins (OPM) without forcing aggressive price hikes.
3. Export-Driven / Currency-Linked Sectors (Information Technology)
-
Mechanism: IT services leaders (e.g., TCS, Infosys) earn the vast majority of their revenues in US Dollars (USD) while incurring operational expenses in Indian Rupees (INR).
-
Impact Check: A stable-to-depreciating domestic exchange rate against the USD provides top-line conversion support and margin defense for large IT exporters.
Macro-Strategist Verdict & Deliverables
Macro Strategy Summary
-
Monetary Equilibrium: India's macroeconomic setup is characterized by strong underlying GDP momentum paired with manageable retail inflation (4.45%), enabling the central bank to maintain an accommodative policy stance at 5.25%.
-
Corporate CapEx Outlook: Affordable real borrowing rates (+0.80%) support ongoing corporate capital expenditure and consumer credit expansion across urban and rural markets.
-
The Core Takeaway: Macro analysis bridges policy benchmarks and equity valuations interest rates determine the cost of capital, inflation determines margin pressure, and GDP dictates revenue demand.