Analysis of Cost Structure and Margins

You are working as a Financial Analyst at Zenith Smartwares Ltd., a consumer electronics company that manufactures the Zenith Smart Hub.
The CFO wants to understand:
-
How much does it cost to make one Smart Hub?
-
Which costs increase when more units are produced?
-
Which costs remain fixed every month?
-
How much does the company earn from each unit sold?
-
How many units must the company sell to avoid a loss?
Business Scenario


Pre-Lab Preparation
Topic : Fundamental & Ratio Analysis
-
Company analysis
-
Industry analysis
-
Macroeconomic analysis
-
Revenue and cost drivers
-
Liquidity ratios, Profitability ratios, Leverage ratios, Efficiency ratios
Lab File : Margins
-
What happens to profit when material costs increase?
-
Is spending more on marketing financially beneficial?
You will use Excel formulas to build a dynamic cost and profitability model and then test different business situations.
Task 1: Identify and Classify Costs
1
Create the Data Table Open a blank Excel workbook. In columns A and B, recreate the following raw data table:
| A1/B1 | Cost / Revenue Item | Amount (₹) |
|---|---|---|
| A2/B2 | Selling Price per Unit | 2500 |
| A3/B3 | Direct Materials per Unit | 800 |
| A4/B4 | Direct Labor per Unit | 400 |
| A5/B5 | Sales Commission per Unit | 150 |
| A6/B6 | Variable Manufacturing Overhead per Unit | 150 |
| A7/B7 | Fixed Manufacturing Overhead (Monthly) | 500000 |
| A8/B8 | Fixed SG&A Expenses (Monthly) | 300000 |
| A9/B9 | Estimated Monthly Sales Volume (Units) | 2000 |
2
Understand the Costs
Divide the costs into two groups.
Variable Costs change when the number of units produced or sold changes.
Examples:
-
Direct Materials
-
Direct Labor
-
Variable Manufacturing Overhead
-
Sales Commission
Fixed Costs generally remain unchanged in the short term, even if sales volume changes.
Examples:
-
Fixed Manufacturing Overhead
-
Fixed SG&A Expenses
3
Calculate Cost
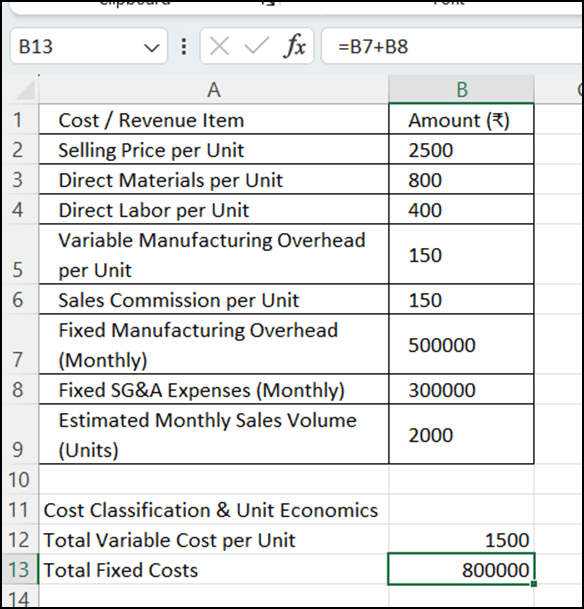
Calculate Cost Classification & Unit Economics
We must separate costs that change per unit (Variable) from costs that remain the same every month (Fixed).
Step 1: Set Up the Section
-
In cell A11, type: Cost Classification & Unit Economics
Step 2: Calculate Total Variable Cost
-
In cell A12, type: Total Variable Cost per Unit.
-
In cell B12, enter the formula to sum all the variable unit costs:
=B3+B4+B5+B6
Result: ₹1,500
Step 3 : Calculate Total Fixed Costs
-
In cell A13, type: Total Fixed Costs (Monthly).
-
In cell B13, enter the formula to sum all the fixed monthly costs:
=B7+B8
Result: ₹8,00,000
Task 2 : Calculate Margins:
A. Set Up the Section
-
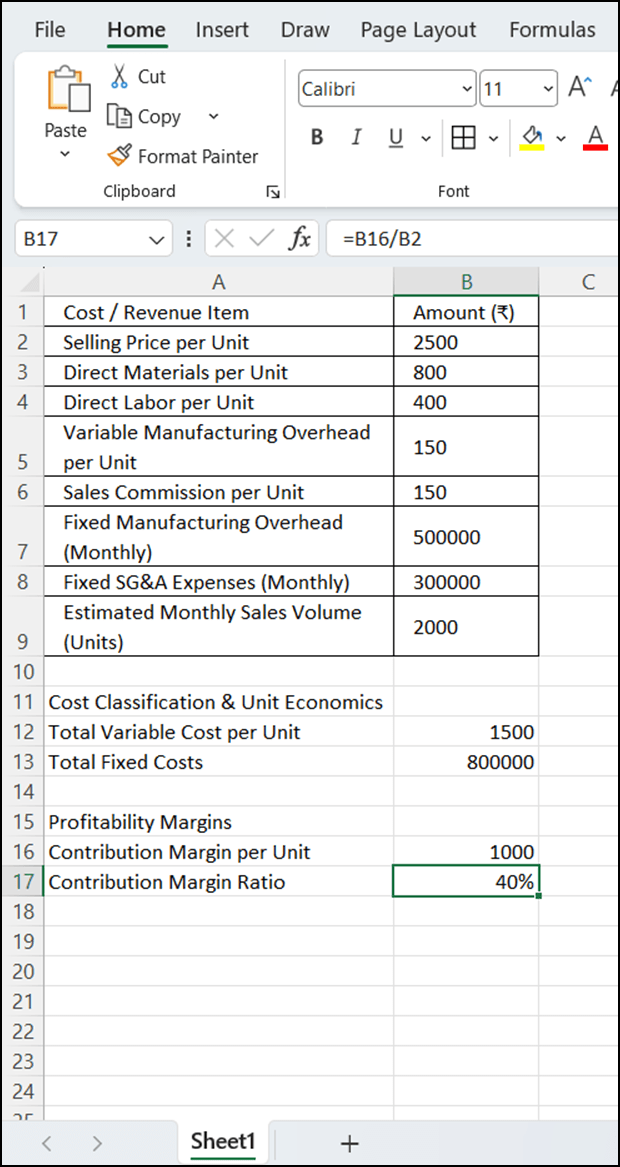
In cell A15, type: Profitability Margins (Make it Bold).
1
Contribution Margin per Unit
-
In cell A16, type: Contribution Margin per Unit.
-
In cell B16, calculate Selling Price minus Variable Cost per Unit:=B2-B12 Result: ₹1,000
2
Contribution Margin Ratio
-
In cell A17, type: Contribution Margin Ratio.
-
In cell B17, divide the Contribution Margin by the Selling Price:
=B16/B2
(Result: 0.40. Format cell B17 as a Percentage -> 40%)
B. Build the Monthly Profitability Schedule:
Let's calculate the total expected monthly profit based on selling 2,000 units.
1
Set Up the Schedule
-
In cell A19, type: Monthly Profitability Schedule.
2
Calculate Revenues and Costs
-
In cell A20, type: Total Sales Revenue.
-
In cell B20, multiply Selling Price by Sales Volume: =B2*B9 (Result: ₹50,00,000)
-
In cell A21, type: Total Variable Costs.
-
In cell B21, multiply Variable Cost per Unit by Sales Volume: =B12*B9 (Result: ₹30,00,000)
3
Calculate Operating Income
-
In cell A22, type: Total Contribution Margin.
-
In cell B22, subtract Total Variable Costs from Revenue: =B20-B21 (Result: ₹20,00,000)
-
In cell A23, type: Less: Total Fixed Costs.
-
In cell B23, link directly to your fixed costs calculation: =B13 (Result: ₹8,00,000)
-
In cell A24, type: Operating Income (EBIT).
-
In cell B24, subtract Fixed Costs from the Contribution Margin: =B22-B23 (Result: ₹12,00,000)
C. Calculate the Break-Even Point (CVP Analysis)
Management needs to know exactly how many units must be sold just to cover all expenses (where profit = ₹0).
1
Break-Even in Units
-
In cell A26, type: CVP & Break-Even Analysis (Make it Bold).
-
In cell A27, type: Break-Even Point (Units).
-
In cell B27, divide Total Fixed Costs by the Contribution Margin per Unit:
=B13/B16
Result: 800 Units
To understand the formula, you have to look at how the costs behave:
-
Total Fixed Costs (₹8,00,000): This is the "heavy burden." The company has to pay ₹8,00,000 every single month for rent, salaries, and insurance, regardless of whether they sell 0 units or 10,000 units.
-
Contribution Margin per Unit (₹1,000): Every time the company sells one Smart Hub for ₹2,500, they have to pay ₹1,500 in variable costs (materials, labor, etc.) to make it. That leaves exactly ₹1,000 of pure cash left over from each sale.
The Logic: The company takes that ₹1,000 from the first sale and puts it toward the ₹8,00,000 fixed debt. They do it again for the second sale. The calculation ₹8,00,000 ÷ ₹1,000 = 800 tells the CFO exactly how many units they have to sell to clear that fixed debt entirely.
2
Break-Even in Revenue
-
In cell A28, type: Break-Even Point (Revenue).
-
In cell B28, multiply Break-Even Units by the Selling Price:
=B27*B2
Result: ₹20,00,000
While the production team thinks in "units" (we need to build 800 hubs), the executive and sales teams think in "rupees." By multiplying the 800 units by the ₹2,500 selling price, the CFO knows that the sales team must bring in ₹20,00,000 in top-line revenue just to keep the lights on.
Task 3 : Analyze Impact (Scenario Analysis)
Scenario Analysis
Now you will test two different business situations.
The purpose of scenario analysis is to understand how changes in business assumptions can affect profitability.
Scenario A: Increase in Material Cost
Suppose the price of raw materials increases because of supply-chain inflation.
Direct Material Cost increases from:
₹800 → ₹900 per unit
What to do
-
Go to B3.
-
Change 800 to 900.
-
Observe how the entire model changes automatically.
-
Look at B27.
-
Record the new Break-Even Point.
Think About
Why does an increase in material cost increase the number of units the company must sell to break even?
Expected Analysis
New Variable Cost:
₹1,500 + ₹100 = ₹1,600
New Contribution Margin:
₹2,500 − ₹1,600 = ₹900
New Break-Even Point:
₹8,00,000 ÷ ₹900 = 888.89 units
Since the company cannot sell a fraction of a unit, it must sell approximately:
889 units
The company now needs to sell 89 more units than before to break even.
Important
After completing Scenario A, change B3 back to ₹800 before moving to Scenario B.
Scenario B: Increase Marketing Spending
The CMO wants to spend more money on digital advertising.
She proposes:
-
Fixed SG&A: ₹3,00,000 → ₹5,00,000
-
Monthly sales volume: 2,000 → 3,000 units
What to do
Step 1: Go to B8 and change : 300000 → 500000
Step 2: Go to B9 and change : 2000 → 3000
Step 3: Look at B24 – Operating Income (EBIT).
Record the new Operating Income.
Expected Analysis
Additional Fixed Costs:
₹5,00,000 − ₹3,00,000 = ₹2,00,000
New Contribution Margin:3,000 × ₹1,000 = ₹30,00,000
New Fixed Costs:
₹5,00,000 + ₹5,00,000 = ₹10,00,000
New Operating Income:
₹30,00,000 − ₹10,00,000 = ₹20,00,000
The company's operating income increases from:
₹12,00,000 → ₹20,00,000
That is an increase of:
₹8,00,000
Interpret the Results
1. Base Case – Current Situation
Zenith Smartwares sells each Smart Hub for ₹2,500.
-
Variable cost per unit = ₹1,500
-
Contribution from each unit = ₹1,000
-
Fixed monthly costs = ₹8,00,000
-
Expected sales = 2,000 units
-
Operating profit = ₹12,00,000
What does this mean?
For every Smart Hub sold, the company keeps ₹1,000 after paying the costs that directly change with production. This ₹1,000 is first used to cover fixed costs. Once fixed costs are covered, the remaining amount becomes profit.
The company needs to sell 800 units to break even. Since it expects to sell 2,000 units, it is comfortably above the break-even level and is making a healthy operating profit.
Scenario A – Material Cost Increases
Direct material cost increases from ₹800 to ₹900 per unit.
This increases the variable cost from:
₹1,500 → ₹1,600
Therefore, the contribution from each unit falls:
₹1,000 → ₹900
The break-even point increases:
800 units → 889 units
What does this mean?
The company now earns ₹100 less from every Smart Hub sold. Because of this, it has to sell 89 additional units just to cover its fixed costs.
Higher material costs reduce profitability and increase the company's risk because more units must be sold to break even.
Scenario B – More Marketing Spending
The company increases marketing expenses by ₹2,00,000, but expects sales to increase from 2,000 to 3,000 units.
The additional 1,000 units generate:
1,000 × ₹1,000 contribution = ₹10,00,000
After paying the additional ₹2,00,000 marketing cost, the company gains:
₹10,00,000 − ₹2,00,000 = ₹8,00,000
Operating income therefore increases:
₹12,00,000 → ₹20,00,000
What does this mean?
The marketing campaign appears financially attractive because the additional sales generate much more contribution than the additional marketing expense.
Overall Conclusion
| Situation | Col 2 | Col 3 |
|---|---|---|
| Base Case | ₹12 lakh profit | Business is comfortably profitable |
| Material Cost Increase | Break-even rises to 889 units | Higher costs increase risk |
| Marketing Campaign | Profit rises to ₹20 lakh | Additional sales more than cover marketing cost |
Final Analyst Conclusion
The company should approve the marketing campaign based on the assumptions in this case. The campaign increases monthly sales by 1,000 units and raises operating profit by ₹8,00,000.
However, management should closely monitor material costs, because even a ₹100 increase in material cost per unit reduces the contribution margin and increases the number of units the company must sell to break even.